3D genome landscape of primary and metastatic colorectal carcinoma reveals the regulatory mechanism of tumorigenic and metastatic gene expression
Introduction
Colorectal carcinoma (CRC) is the third most common cancer and the second-ranked cause of cancer deaths. The incidence and mortality rates of CRC are higher in Western countries than in Asia and Africa, and are rising rapidly in developing countries1, reflecting that both genetic and environmental factors play roles in its etiology. A total of 45% of CRC patients experience cancer metastasis. About 20% of newly diagnosed CRC patients have metastatic diseases and another 25% will develop metastasis later2. Although systemic and targeted therapies have improved the survival outcome of metastatic CRC (mCRC) patients, fewer than 20% of them currently survive beyond 5 years from diagnosis2.
Cancer metastasis is a multi-phase process where primary tumor cells invade the surrounding stroma, transit through circulatory vessels, and develop into metastatic lesions at distant sites3. Although the initial phases are thought to involve epithelial-mesenchymal transition that increases the motility and invasiveness of tumor cells, less is known about how circulating tumor cells manage to survive and proliferate in a new tissue environment3. As primary and metastatic tumors mostly share similar mutational landscape and driver genes4, non-genetic mechanisms have been suggested for metastatic progression, such as amplification of oncogenic pathways previously activated in primary tumors5, activation of developmental epigenetic programs6, and global alteration of chromatin accessibility7.
Higher-order chromatin structures and spatial genome organization are increasingly implicated in various diseases8. In recent years, new sequencing technologies such as ATAC-seq9 and high-throughput chromosome conformation capture (Hi-C)10 have been developed to investigate genome structures and organization. Chromatin is entangled in histones to form nucleosomes, and the degree to which nucleosomes are stacked together determines the accessibility of chromatin9. A/B compartments are two states of chromatin obtained after principal component analysis (PCA) of Hi-C data. Compartment A is usually enriched in active chromatin, while compartment B is usually enriched in silent chromatin10. At the megabase scale, chromatin folds to form mutually insulating spheres, named topologically associated domains (TADs). The interaction frequency within TADs is significantly higher than that between TADs, thereby mediating relatively independent elements regulation within TADs11,12. Finally, the CTCF/cohesin protein pulls two sites that are linearly far apart to form a spatially adjacent loop which often represents the interaction between enhancer and promoter (E-P loop)13.
Genetic mutations in the germline or somatic genome, such as point mutations and structural variations, were reported to markedly change chromatin folding maps in the cancer genomes. And gene expression was significantly changed in the recombinant regions14,15,16,17. The current 3D genome studies of clinical cancer are gradually covering a variety of cancer types, revealing the regulatory mechanism of the 3D genome in cancer. Structural variations in acute myeloid leukemia (AML) induce enhancer-hijacking and silencer-hijacking events and further lead to 3D genome organization and gene expression alteration18. Johnstone et al. identified a compartment at the interface between the canonical A and B compartments that is reorganized in colon tumors19. Subtype-specific transcription in muscle-invasive bladder cancers is accompanied by specific open chromatin, epigenomic marks, and 3D genome organizations20. Zhu et al. traced the evolution and malignant transformation of colorectal cancer by generating high-resolution chromatin conformation maps of 33 colon samples spanning different stages of early neoplastic growth and revealed a substantial progressive loss of genome-wide cis-regulatory connectivity at early malignancy stages, correlating with nonlinear gene regulation effects21.
Although these studies discover A/B compartment and loop differences between samples from patients and healthy donors, individual heterogeneity brings challenges to comparative analysis of the 3D genome dynamics during tumor development. Additionally, the changes in the three-dimensional structure of chromatin in cancer tissues at the TAD scale have not been fully studied. Due to the limited size and strict experimental requirements of clinical samples, there are few nuclear architecture studies of solid metastatic tumors. Recently, Ren et al. used normal human pancreatic epithelial cell lines (HPNE), primary pancreatic cancer cell lines (PANC-1), and metastatic pancreatic cancer cell lines (Capan-1) to study multiscale 3D epigenome reprogramming during pancreatic cancer metastasis22. The nucleus of cancer cells often displays abnormalities in many aspects, including nucleolus23, nuclear size, shape, and chromatin texture24. However, the changes and function of three-dimensional chromatin structure in clinical metastatic samples remain for further research.
Here we performed multi-omics profiling of matched normal colon, primary tumor, and liver metastasis from 13 CRC patients using Hi-C, ATAC-seq, and RNA-seq technologies. We integrated the quality-controlled 3D genome, chromatin accessibility and transcriptome data to explore the roles of genome organization in CRC.
Results
Comprehensive maps of chromatin topology, gene expression, and chromatin accessibility in matched normal tissues, primary tumors, and metastatic CRC
To investigate the dynamic 3D genome landscape of primary and mCRC, we collected matched normal colon and colorectal tumor samples from seven metastasis-free CRC patients, and matched normal colon, colorectal tumor, liver metastasis, lymph node metastasis, and normal liver samples from 6 metastasis CRC patients treated at Peking University Shougang Hospital (Fig. 1a). We conducted a follow-up survey on all patients for 6 months. According to the definition of synchronous metastasis, we chose metastasis CRC patients who have liver metastasis when diagnosed with CRC. We named patients who had not experienced liver metastasis within 6 months after surgery as metastasis-free CRC patients. We arranged the clinical information of patients (Table S1).

a Experimental design and data analysis workflow of this study. b Hematoxylin-eosin staining of matched normal colorectum, primary tumor, and liver metastatic tumor from six patients with a scale bar of 50 μm. c PCA of RNA-seq data in normal colon, colorectal tumor, liver metastasis, lymph node metastasis, and normal liver samples. N: normal colorectum, T: primary tumor, M: liver metastasis, LNM: lymph node metastasis, NL: normal liver. d PCA1 snapshot of Hi-C data.
Then, all samples were digested into single-cell suspension immediately after collection to construct Hi-C, RNA-seq, and ATAC-seq libraries for sequencing (“Methods”). Notably, the experimental conditions for clinical solid tissues are strict. For example, too few cells can result in lower Hi-C resolution, too long experimental time will lead to RNA degradation, and too low cell activity may reduce the enrichment of chromatin accessibility signal. Therefore, the quality control of multi-omics data for solid tissue samples is important.
Rigorous quality control was applied to our sequencing data. We screened qualified Hi-C data through quality control of sequencing quality (Table S2), alignment rate (Fig. S1a, b), fragment pairs distribution (Fig. S1c, d), valid interaction distribution (Fig. S2a, b), and distance vs. Hi-C counts (Fig. S2c, d). We also performed quality control on RNA-seq data by checking sequencing quality (Table S3), housekeeping gene coverage (Fig. S3a), read duplication (Fig. S3b), transcript integrity (Fig. S3c), and RPKM saturation (Fig. S3d). Further, we checked the ATAC-seq data (Table S4; Fig. S4) and observed enriched ATAC-seq signals at transcription start sites (TSS). A significant correlation was observed between chromatin accessibility of gene promoter and gene expression in our data (Fig. S5a). We found that increased promoter accessibility of cancer-related genes MYC and NOTCH1 is consistent with the upregulation of gene expression (Fig. S5b, c). Therefore, integrating ATAC-seq and gene expression profiles discovered global chromatin accessibility alteration coordinated with gene expression changes, and nominated candidate genes dysregulated in mCRC.
Overall, we provided high-quality maps of chromatin topology, gene expression, and chromatin accessibility in matched normal tissues, primary tumors, and metastatic tumors (Fig. S6). The hematoxylin-eosin staining of matched normal colon, primary tumor, and liver metastatic tumor reflects the phenotypic difference of cancer tissue types and proves the correctness of our sampling (Fig. 1b). All hematoxylin-eosin staining slides were double-checked by pathological experts, and they ensured the expected cells (normal, primary or metastatic tumor cells) were present in the obtained tissue. Next, PCA was applied to analyze RNA-seq and Hi-C data. We showed that transcriptome data of normal colon, colorectal tumor, liver metastasis, lymph node metastasis, and normal liver samples were grouped into separate clusters (Fig. 1c). Notably, previous studies based on cell lines have shown that normal cells are more similar to metastatic cancer cells than primary cancer cells by clustering transcriptome and three-dimensional genome data22. However, in our clinical data, the cell types are sorted according to the order of normal colon, colorectal tumor, lymph node metastasis, liver metastasis, and normal liver. The data of adjacent cell types are more similar, which is consistent with the development process of cancer cells. We also found that liver metastasis is more similar to the normal liver than other tissue types in the transcriptome, which may be one of the prerequisites for cancer metastasis. To check the robustness of our result, we collected published RNA-seq data of matched normal colon, primary tumor, lymph node metastasis, liver metastasis, and normal liver tissues25,26,27, and we used a consistent pipeline for data quality control and PCA (Fig. S7). The high-quality published data achieved similar PCA result with our data. According to the first principal component (PC1) track of Hi-C data, we confirmed the similarity of large-scale Hi-C features and specific differences in different tissue types (Fig. 1d). These high-quality clinical data provide a good basis for our research.
Primary tumor-specific and metastatic tumor-specific gene expression patterns
To find out the dynamic changes of the transcriptome during tumorigenesis and metastasis, we first identified differentially expressed genes in different types of samples (Fig. 2a). We obtained 5605 genes that were significantly changed in at least one of the pairwise comparisons, and 137 genes that were significantly changed in each of the pairwise comparisons of three different sample types (Figs. 2b and S8a). To understand what role these dynamically expressed genes play in the tumorigenesis and metastasis of CRC, we selected COL6A3, RP11-708H21.4, and ENO1 as examples. The patterns of upregulation and down-regulation of these genes in different samples differ from one another, but they are related to the prognosis of CRC patients (Figs. 2c and S8b, c). The P value of COL6A3 is the lowest among eight hub genes associated with poor prognosis in CRC, and in silico analysis of cell type‑specific gene expression and COL6A3 knockout experiments indicate the clinical relevance of COL6A3 in the development of CRC28. Down-regulation of long non-coding RNA RP11-708H21.4 is associated with poor prognosis for CRC and promotes tumorigenesis through regulating AKT/mTOR pathway29. In addition, the expression level of ENO1 may serve as a valuable diagnostic biomarker, as it is associated with patient outcomes, such as cancer survival and prognosis30,31,32. The highly dynamic changes of these genes among different samples reflect the complexity and dynamics of gene regulatory networks related to cancer courses.

a Clustering heatmap of significantly differentially expressed genes. Gene expression count was normalized with z-score. The threshold for significant differences in gene expression is p value < 0.1. b Venn diagram of significantly differentially expressed genes among different comparison groups. c Normalized count of COL6A3 gene expression in different samples. d Differentially expressed genes in primary tumor vs. normal colorectum. Red dots: significantly higher expression gene in the primary tumor, blue dots: significantly lower expression gene in the primary tumor. e OTOP2 and MMP7 gene expression in colorectal tumor and normal colorectum. The red filling represents the gene expression level of colon or rectal cancer, while the gray filling represents the gene expression level of normal colon and rectum. The red asterisk indicates that the absolute value of log2 (fold change) is greater than 1 and the p value is less than 0.01. f Differentially expressed genes in metastatic tumor vs. primary tumor. g Survival curve of CRC patients with different CXCL14 gene expression. h GSEA and GSVA enriched KEGG pathway in different comparison groups. The red font represents increased pathways, and the blue font represents decreased pathways.
To comprehensively analyze which pathways are enriched by dynamically changing genes and regulate tissue type-specific gene expression networks in the development of cancer, we analyzed the differences in the expression and pathways of primary tumors vs. normal tissues and metastatic tumors vs. primary tumors respectively. Firstly, we identified the top genes with significant differences in expression among different samples (Fig. 2d, f). Then we analyzed the expression of these differentially expressed genes in public CRC transcriptome data from the Cancer Genome Atlas (TCGA)33 with consistent results (Fig. 2e). Because of the poor prognosis and low survival rate beyond 5 years, we speculated that the differentially expressed genes in metastatic tumors vs. primary tumors were correlated to patient survival. We chose the most significantly differential expressed gene CXCL14 for survival analysis. As expected, the CXCL14 was significantly associated with survival in colorectal patients (Fig. 2g). The chemokine CXCL14 has been reported to play an important role in the progression of many malignancies, and tumoral CXCL14 expression levels were significantly correlated with TNM (Tumor-node-metastasis) stage, histodifferentiation, and tumor size34. The gene set enrichment analysis (GSEA)35 and gene set variation analysis (GSVA)36 showed enrichment pathways of differentially expressed genes among different samples (Figs. 2h and S8d, e).
Here we performed transcriptome profiling of matched samples from both metastatic and non-mCRC patients. Therefore, we can compare the difference in gene expression patterns between metastatic and non-metastatic patients in normal tissues and primary tumors, so as to explore the driving factors of cancer metastasis. By analyzing the different expression patterns of metastatic and non-metastatic patients, we found that the differential expressed genes in normal tissues are enriched in intestinal immune-related pathways, and the differential expressed genes in primary tumors mainly affect the metastasis-related pathways (Fig. S9), which revealed that the difference between different tissues in patients with metastasis and non-metastasis might be related to the occurrence of tumor metastasis.
Reorganization of A/B compartment is associated with the differential gene expression specific to primary and metastatic colorectal carcinoma
The dynamic change of three-dimensional chromatin structure provides a new perspective for the change of gene expression regulation in CRC metastasis. Previous studies have revealed the alteration of higher-order genome structures in colorectal cell lines and primary tumors, in which translocations induce genome reorganization and compartmental changes that may restrain malignant progression19. To further explore the 3D genome of metastatic tumors as well as its potential relationship with the progression of CRC, we first inspected the A/B compartment landscape of the samples, which correspond to transcriptionally active and inactive genome regions, respectively10. We showed the dynamic A/B compartment switch during the development of individual CRC (Fig. 3a). The proportion of compartments that switched A/B status between normal and tumor samples ranged from 4.73% to 18.99% and the proportion between primary and metastatic tumors ranged from 6.35% to 21.62% in individual patients (Figs. 3b and S10a, b). Interestingly, the greatest switches were observed in CRC-04, CRC-05, and CRC-13, all of which developed metastasis. To clarify the association between individual heterogeneity in the A/B compartment and tumor metastasis, we defined the compartment stability score for comparative research of A/B compartment switch events among different groups (1). A significantly higher compartment stability score was observed in patients without metastasis (Fig. 3c).
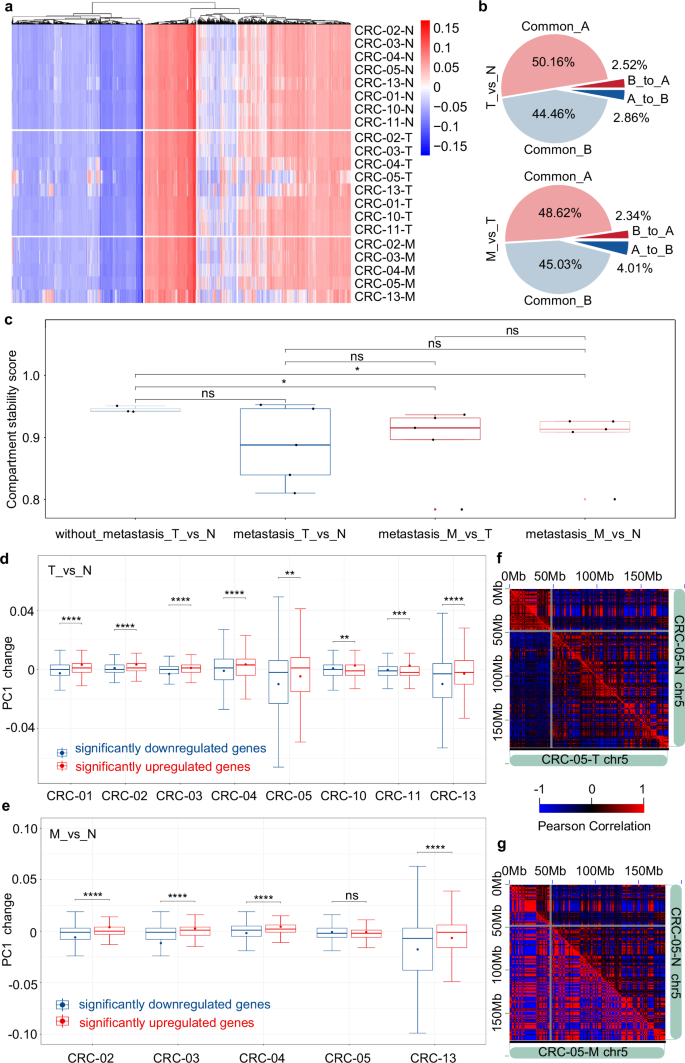
a Clustering heatmap of Hi-C PCA1 value in different samples. b Proportional distribution of A/B compartment switch in CRC-03 patient during the tumorigenesis and metastasis of colorectal carcinoma. c Compartment stability score in tumorigenesis or metastasis of patients with or without metastasis. *p ≤ 0.05, ns: no significance, Wilcox-test. d Box plot of PC1 changes of significantly downregulated and upregulated genes in colorectal cancer tumorigenesis. *p ≤ 0.05, **p ≤ 0.01, ***p ≤ 0.001, ****p ≤ 0.0001, ns: no significance, t-test. e Box plot of PC1 changes of significantly downregulated and upregulated genes in colorectal carcinoma metastasis. *p ≤ 0.05, **p ≤ 0.01, ***p ≤ 0.001, ****p ≤ 0.0001, ns: no significance, t-test. f Pearson correlation heatmap of chr5 in CRC-05-T and CRC-05-N samples. g Pearson correlation heatmap of chr5 in CRC-05-M and CRC-05-N samples.
Since the compartment stability score is a novel concept in our research, we then tested this concept on published clinical Hi-C data. We first tested the performance of the compartment stability score in measuring A/B compartment difference on CRC19 and AML18 samples (Fig. S11). We noticed that the compartment stability score could well quantify the difference in A/B compartment between tumor and normal samples. Moreover, the tumor samples always show more heterogeneity than normal samples, so we tested whether this phenomenon could be reflected in the compartment stability score. As expected, we showed that the compartment stability score of normal sample pairs was significantly higher than that of tumor sample pairs (Fig. S12). Overall, the compartment stability score is robust and stable in measuring A/B compartment difference and evaluating Hi-C data heterogeneity within datasets.
We next asked whether the compartment switching is relevant to the gene expression change in tumorigenesis or metastasis of CRC. Since the A/B compartment switch events are highly heterogeneous among CRC patients, we first focused on the PC1 changes of significant differentially expressed genes. As expected, the PC1 value of upregulated genes increased more significantly than that of downregulated genes (Fig. 3d, e). This suggested that gene expression changes during the tumorigenesis and metastasis of CRC are correlated with PC1 value. However, we noticed an exception in comparison between CRC-05-M and CRC-05-N. The PC1 change did not show a significant difference between downregulated and upregulated genes. To explore the particularity of A/B compartment pattern of CRC-05-M, we showed the Pearson correlation heatmap of CRC-05-N, CRC-05-T, and CRC-05-M (Fig. 3f, g). The significant enhancement of A/B compartment pattern was observed in CRC-05-M Pearson correlation heatmap. We suspected that the great genome-wide alterations in CRC-05-M might influence the correlation analysis between gene expression and PC1 values. Although the pre-surgical carcinoembryonic antigen of CRC-05 patients is extremely high (129.33, with an average of 9.595 for other patients), the mechanism of great A/B compartment alterations remains unknown.
To further demonstrate the impact of A/B compartment changes on gene expression, we divided the switch mode of A/B compartment into four categories: B compartment remains unchanged (B-B), A compartment switches to B compartment (A-B), B compartment switches to A compartment (B-A), A compartment remains unchanged (A-A). By comparing the gene expression changes of different types of A/B compartment switching, we observed significant gene expression differences (Fig. S13a). The genes converted from B compartment to A compartment tend to be upregulated in expression, while the genes converted from A compartment to B compartment tend to be downregulated in expression. During the tumorigenesis and metastasis of CRC, the switching of compartment structure was consistent with the change of expression, suggesting that the change of compartment structure was one of the factors affecting the tumorigenesis and metastasis of cancer. Although the gene expression is affected by the compartment structure, the compartment is a structure at the megabase scale. The expression of some genes is not consistent with the switching of A/B compartment (Fig. S13b). We reasoned that the gene expression regulation will also be affected by more detailed regulatory units such as TAD and loop.
TAD hierarchy and strength reorganized in tumorigenesis and metastasis of CRC
TADs are spatially self-interacting genomic regions, which physically restrict the interactions between promoters and regulatory elements within each TAD11. Disruption of TAD boundaries by structural variations results in gene expression dysregulation in developmental diseases and cancer16,37,38. However, topological boundaries were largely conserved across colon tumors, normal colons, and cell lines19,22. The similarity of TAD structure among normal tissue, primary tumor, and metastatic samples was also found in our data (Fig. 4a). Interestingly, we have noticed the differences in the internal substructures of TAD among different cell types, with subTADs nested within larger TADs, this structure was reported as TAD hierarchy in previous studies39. An et al. reported that gene expression of higher-level TAD was significantly higher than that of lower-level TAD and our previously developed TH-score algorithm was defined to represent the TAD level of each gene39,40. We further explored whether this change in TAD hierarchy was related to gene expression regulation. The TAD levels of all genes were first evaluated with TH-score. Based on TH-score and ANOVA test (p value < 0.05), we obtained genes with significant hierarchical TAD differences and performed Pearson correlation clustering (Fig. 4b). The heatmap showed good clustering of cell types based on TH-score, and the heterogeneity increased with the progression of CRC tumorigenesis and metastasis. Then significant differential TH-score genes were divided into two categories according to the changes in levels among different types of samples (Fig. 4c). The change in TAD levels was observed to be consistent with the change in gene expression (Fig. 4d), indicating that the TAD hierarchy also affected gene expression in tumorigenesis and metastasis of CRC.

a Snapshot of Hi-C heatmap in different samples. b Pearson correlation clustering heatmap based on TH-score. c Schematic diagram of TAD hierarchy reorganization classification based on TH-score. ANOVA test was performed to identify significantly differential TH-score genes. d Box plot of gene expression log2Foldchange between TH-score decrease and increase genes. Wilcoxon test, *p ≤ 0.05, **p ≤ 0.01, ***p ≤ 0.001, ****p ≤ 0.0001. e Number of significant reorganized TADs using diffDomain. f Box plot of gene expression log2Foldchange located in different types of reorganized TADs. Wilcoxon test, *p ≤ 0.05, **p ≤ 0.01, ***p ≤ 0.001, ****p ≤ 0.0001.
To further classify TAD reorganization types, we used the diffDomain41 to analyze the TAD domain difference between normal colon and primary tumor, between primary tumor and metastasis tumor, and between normal colon and metastasis tumor. All TAD reorganization events were classified into loss, merge, split, complex, zoom, strength_change_up, and strength_change_down (Fig. 4e). We next explored whether different TAD reorganization types were related to different gene expression change patterns. By overlapping significantly differentially expressed genes with reorganized TAD region, we found that gene expression in strength_change_up domain was significantly higher than that in strength_change_down domain (Fig. 4f). This suggested that TAD strength is related to gene expression during the tumorigenesis and metastasis of CRC. Overall, recombination of TAD hierarchy and TAD intensity occurs during CRC progression, which is associated with differential gene expression.
Enhanced SPP1 loop correlates with SPP1 upregulation during the progression of CRC
Chromatin loops are formed by architectural proteins including CTCF, YY1, cohesin complex, and transcription factors through a loop extrusion process42,43. They bring promoters and enhancers into spatial proximity and often correlate with gene transcription in biological and pathological processes44,45. To determine whether the progression of CRC is accompanied by dynamic chromatin loops, we first detected the differential loops for each patient using Juicer hiccupdiff46. We observed that the change in loop strength has a consistent correlation with the differential expression of loop anchor genes (Fig. S14). However, we did not find loops with consistent strength changes occurred in all patients. To identify the consistent loop changes during the tumorigenesis and metastasis of CRC, we merged our Hi-C data that belong to each of the normal tissue, primary tumor, and metastasis tumor categories to improve the data resolution for detecting loops. The average length of the loops was 225 kb (Fig. S15a). We identified 2657 enhanced loops and 649 weakened loops in primary tumors relative to normal tissue (Fig. S15b), and 477 enhanced loops and 2745 weakened loops in metastasis tumors relative to primary tumors (Fig. 5a). Genes whose TSS are located in the anchors of the enhanced loops (hereinafter referred to as loop-related genes.) were significantly upregulated (Figs. 5b and S13c). The enhanced loop-related genes in primary tumors were enriched in the cell cycle and proliferation pathways (Fig. S15d). In contrast, the enhanced loop-related genes in metastasis tumors were enriched in pathways of stem cell population maintenance and negative regulation of adhesion (Fig. 5c). These results suggest that the dynamic loops during CRC progression are involved in tumorigenesis and metastasis through regulating gene expression.

a Heatmaps of representative enhanced loops (left), common loops (middle), and weakened loops (right) comparing primary tumors (T) and mCRC (M). Top: the loops in the primary tumor, bottom: the loops in liver metastasis. The aggregated peak analysis (APA) scores measure the average loop strength. b Boxplots of average expression levels of the genes located in the anchors of enhanced and weakened loops (T vs. M) (Significance is based on paired one-tailed Wilcoxon test; the number of genes located in the anchors of weakened and enhanced loops are 1424 and 233, respectively). c Representative of most significant gene ontology terms enriched in genes within metastasis-enhanced loops relative to primary tumors. d The differential expression volcano plot of genes located in enhanced loop anchors. Red dots: significantly upregulated genes, blue dots: significantly downregulated genes, gray dots: not significantly differentially expressed genes. Horizontal dashed line: p-adjusted value equal to 0.05, Vertical dashed lines: log2Foldchange value equal to −1 and 1. e The interaction heatmap of the SPP1 loop in merged normal tissue (N), primary tumors (T) and mCRC (M). f The epigenomic and interaction of SPP1 loop. Top: genomic features of chromosome region containing the SPP1 loop; bottom: chromatin interactions in the normal tissue, primary tumor, and two metastatic samples of CRC-03. The increased interactions of the SPP1 promoter with nearby enhancers are accompanied with SPP1 expression increase during tumorigenesis and metastasis. Public CTCF and H3K27ac data are from Johnstone’s research. g Immunofluorescence staining of the SPP1 protein level in normal tissue, primary tumor, and liver metastasis of patients CRC-04 and CRC-13 with a scale bar of 500 μm. h Survival curves of TCGA primary COAD patients stratified by SPP1 expression level. Significance is based on a log-rank test.
Among the enhanced loops, 25 loops (Table S5) were shared between the normal vs. primary tumor and the primary tumor vs. metastasis tumor comparisons. We inspected the genes whose TSS is located within the anchor regions of these loops for their potential roles in CRC tumorigenesis or metastasis (Table S5). Then we explored whether these gene expressions changed in CRC tumorigenesis or metastasis (Fig. 5d). We noticed that the mRNA expression of SPP1 gene was significantly upregulated in both CRC tumorigenesis and metastasis. The cancer metastasis-related gene SPP147 (alias: OPN) is located at the anchor of an enhanced loop, which connects the SPP1 promoter to a region with strong enhancer signals (Fig. 5e, f). SPP1 encodes a secreted phosphorylated glycoprotein and high expression of SPP1 is related to tumor progression in gastric cancer and esophageal adenocarcinoma48,49. The SPP1 loop was weak in normal tissues, increased in primary tumors, and further enhanced in metastasis tumors (Fig. 5e, f). This loop was also enhanced in public Hi-C data of CRC relative to normal tissue (Fig. S15e). Concomitant with the increased loop strength, the SPP1 expression was continuously upregulated during the progression of metastasis CRC (Fig. S15f).
To confirm the clinical relevance of SPP1 upregulation, we performed SPP1 immunohistochemical staining of the samples from patients CRC-01, CRC-02, CRC-03, CRC-04, CRC-10, and CRC-13. The expression of SPP1 protein was very low in normal tissues, increased in tumors, and further enhanced in metastasis CRC (Figs. 5g and S15g). Survival analysis showed that higher expression of SPP1 is associated with poorer prognosis of CRC patients (Fig. 5h) and patients with adrenocortical carcinoma, liver hepatocellular carcinoma, and lung adenocarcinoma (Fig. S15h). Taken together, dynamic chromatin loops during CRC progression and metastasis are associated with the transcription of cancer-related genes, which may have clinical consequences.
To facilitate the usage of our generated data resources, we developed a filtering pipeline to prioritize genes that are potentially affected by the 3D genome during the tumorigenesis and metastasis of CRC (“Methods”, Fig. S16a). We classified these genes by their putative function and searched their relevant literature on involvement in cancer, and provided the information as a reference (Supplementary Data 1). To verify the biological function of the selected 3D genome-related genes, we selected 3 genes (ARL4C, FLNA, and RGCC) which are predicted to be the 3D genome-related oncogenes during the metastasis. Our filtering pipeline shows that these genes were significantly upregulated in metastasis samples and related to the survival period of CRC patients, while no significant epigenome difference and direct report in CRC metastasis. Therefore, we knocked down these genes by siRNAs in HCT116 cells (Fig. S16b), and evaluated the changes of cell migration and invasion by transwell assay, respectively (Fig. S16c, d). Results show that cell migration and invasion are significantly decreased after knocking down the genes (Fig. S16e, f), especially in the group of ARL4C and FLNA knockdown. These data demonstrated that those 3D genome-related genes are able to promote the migration and invasion properties of CRC cells.
Chromatin structural variations in the progression and metastasis of CRC are associated with altered chromatin accessibility and spatial interactions
Chromatin structural variations play an important role in tumorigenesis and metastasis, and are often regarded as decisive diagnostic characterization and therapeutic targets of cancer50,51,52,53. It has been reported that structural variations can lead to the alteration of chromatin structure, including the formation of new topologically associated domains54, induced enhancer-hijacking events55, and silencer-hijacking events18. To explore the dynamic changes of structural variations in the progression and metastasis of CRC, we used the EagleC56 to identify structural variations (Fig. 6a, Supplementary Data 2) and gene fusion events (Fig. 6b, Supplementary Data 3).

a The distribution of structural variation events called by EagleC. b The distribution of gene fusion events mediated by chromatin translocation events. c ATAC-seq signal and Insulation score enrichment in SV flanking region. d TH-score change in SV flanking region. ****p ≤ 0.0001, t-test. e A/B compartment, TAD and RNA-seq track in structural variation region between chr5:61600000-63100000 and chr5:121500000-124500000, between chr5:87300000-90500000 and chr5:124500000-13100000.
To explore the impact of structural variations on chromatin accessibility and spatial conformation alteration, we aggregated the ATAC-seq and insulation score profile in structural variation breakpoints flanking regions (Figs. 6c and S17a). We noticed that structural variations were consistent with high chromatin accessibility and low insulation, especially for translocations and genes located in SV flanking regions were evaluated using TH-score to quantify TAD hierarchy. We noticed that the TH-score of tumor-specific SV flanking genes was significantly higher than that of normal-specific SV flanking genes (Fig. 6d). This suggested that structure variation breakpoints tended to form new TAD boundaries and increase the TAD hierarchy of SV flanking genes. For example, we focused on an obvious translocation of chromosome 5 and comprehensively analyzed the A/B compartment, TAD level, and gene expression in the translocation region (Fig. 6e). We found A/B compartment was switched and the TAD hierarchy was remolded in chromatin translocation region. A new TAD boundary is formed at the structure variation breakpoint, and the genes located in the breakpoint flanking region are settled in the new subTAD structure, resulting in the increase of the TAD hierarchy of these genes. These structural alterations jointly affect the differential expression of CEP120, CSNK1G3, ZNF608, RGAMD2B, ALDH7A1, and other genes around the translocation region. CEP120 was reported to promote the expansion of the centrosome and the progress of gastric cancer through the ubiquitination of PLK4 mediated by USP5457. Cyclic RNA (circCSNK1G3) formed by the transcription of oncogene CSNK1G3 is highly expressed in renal cell carcinoma. Abnormal circCSNK1G3 promotes the growth and metastasis of cancer58. Furthermore, the ALDH7A1 gene is related to the development and prognosis of many kinds of cancer, and its overexpression promotes the metastasis of cancer cells59. We also observed upregulation of this gene in our metastatic cancer samples. Therefore, chromatin translocation is associated with chromatin structural remodeling and disorder of gene regulation.
To explore the potential impact of structural variation on chromatin structure of clinical CRC-related genes, we showed the following genes with structural variations (Fig. S17b). First, ZMIZ1 is overexpressed in a significant percentage of human breast, ovarian, and colon cancers, and ectopic expression of ZMIZ1 induces cutaneous squamous cell malignancies in a mouse model of cancer60. We found chromatin translocation around ZMIZ1 gene occurred in primary CRC samples and enhanced in metastasis, which may activate the expression of ZMIZ1 truncated transcript. Next, the TTC28 gene in CRC has been found to cause L1 element reverse transposon to change the gene expression of the insertion site, which is related to tumorigenesis and development of CRC61. We also found a gradually strengthened chromatin translocation signal with the development of cancer around the TTC28 gene site. Third, the CLN3 gene is overexpressed in CRC cell lines and tissues, and the overexpression of this gene is related to anti-apoptosis and promotes the growth and proliferation of cancer cells62. In our Hi-C data of CRC patients, we found specific chromatin translocation around CLN3 gene site in metastatic samples, which may drive CRC deterioration and further metastasis. Last, ABCG1 gene is highly expressed in CRC cells with rapid metastasis and aggregation. Inhibition of ABCG1 gene can reduce cell aggregation and tumor growth lowering cellular aggregation and tumoroid growth as well as hypoxia-inducible factor 1α in cancer cells around the central necrotic areas in tumors63. We also found significant chromatin translocation around ABCG1 only in mCRC samples. The chromatin translocations around these CRC-related genes are closely related to the tumorigenesis and metastasis of CRC.
Discussion
Cancer cell metastasis is a major cause of cancer recurrence, lethality, and poor prognosis64. Metastatic cancers differ from primary cancers at the genomic and transcriptional levels, with the genome of metastatic cancers being more unstable and mutated than that of primary cancers65. Chromatin structure bridges genomic variation with transcriptional regulation. At present, no clinical cancer metastasis Hi-C data is available. Here, we selected highly mCRC to build comprehensive maps of chromatin topology, gene expression, and chromatin state in matched normal tissues, primary cancers, and metastasis. We provided high-quality and multi-omics data for studying the mechanism of cancer metastasis from the perspective of the 3D genome.
By clustering the gene expression of normal colon, primary cancer, lymph node metastasis, liver metastasis, and normal liver samples of CRC, we found dynamic and continuous alteration of gene expression with the tumorigenesis and metastasis of CRC, which might be related to the “seed and soil” hypothesis proposed by Stephen Paget66. The dynamic gene expression supports the presence of dynamic changes in the metabolism of metastasizing cells, contributing to their ability to successfully transition through the changing microenvironments of the metastatic cascade67. Compared with normal colon, differentially expressed genes in primary cancer served as tumor markers, and differentially expressed genes in metastatic cancer correlated with patient survival cycle and prognosis in our research. Moreover, compared with the normal colon of patients without metastasis, the differentially expressed genes in the normal colon of patients with metastasis are mainly enriched in the intestinal immune-related pathways. This is consistent with the finding that activating a collaborative innate-adaptive immune response controls metastasis68. We showed that CRC patients with and without metastasis have expression differences in both the precancerous lesions and the primary cancer.
In the study of A/B compartment of CRC, we showed that A/B compartment switched during the tumorigenesis and metastasis of CRC and significantly affected gene expression. The A/B compartment with the larger absolute value of the first principal component is relatively stable, and the smaller one is more prone to A/B compartment conversion, which is consistent with the previous three-dimensional genome study of CRC. Johnstone et al. defined an intermediate genome compartment (I compartment) with higher convertibility, largely coinciding with hypomethylated blocks19. The switch from either A to B or B to A compartment was also found in our study, and the pattern of A/B compartment switch differed in different patients. We also noticed that A/B compartment is relatively stable in patients without metastasis, which may be due to the more unstable genome of metastatic tumors.
In the regulation of chromatin structure, TAD boundaries are conservative. Therefore, few changes in TAD structure were observed in the previous three-dimensional genome study of cancer, despite changes in gene expression within TADs14,18,22. From the TAD hierarchy perspective, we discovered the dynamic changes in TAD internal interactions and regulated gene expression during the development of CRC.
We identified and validated the dynamic changes in the SPP1 loop at the loop scale, which are consistent with the expression of the gene and protein. Identified the impact of loop structural changes on gene enrichment pathways. Based on the chromatin structure screening algorithm, the role of ARL4C, FLNA, and RGCC in the migration and invasion of cancer cell migration was found and verified in vitro.
Frequent structural variation of chromatin is a key feature of cancer cell genome69. Structural variation can induce dramatic changes in chromatin organization, thus creating specific signatures that are noticeable by visual inspection of interaction maps70. We found that structural variations were consistent with high chromatin accessibility and low insulation, especially for translocations. Moreover, structure variation breakpoints tended to form new TAD boundaries and increase the TAD hierarchy of SV flanking genes. We found structural variation of chromatin at multiple cancer metastasis-related gene sites in our Hi-C data. Overall, recognition of chromatin structural variation based on Hi-C requires low sequencing depth, while it can achieve high recognition accuracy and reflect spatial information. This approach builds a bridge between structural variation and regulatory function.
Genomic instability and high mutation are important characteristics of cancer71, but the mechanism of correlation between this instability and cancer occurrence and metastasis has not yet been fully revealed. Our study provides a three-dimensional genome map of clinical metastatic samples of CRC, providing a new perspective for understanding the dynamic changes in colorectal metastasis. Due to the lack of lineage differentiation information, our research has not been able to identify cancer-driving genes. The differential expression of a large number of genes in cancer cells may be related to the trend of more suitable cell migration and invasion in the development and evolution of cancer. We checked the in vitro effects of ARL4C, FLNA, and RGCC on cancer metastasis. The recent rapid development of lineage tracking and single-cell Hi-C technology could provide new tools for screening cancer-driving genes.
The 3D genome is a promising direction for studying cancer metastasis, not only because the 3D genome is closer to the upstream of expression regulation, but also because the rules of 3D genome regulation are conserved in normal, primary, and metastatic tumors. This provides a new idea for future research on stable anticancer drug targets. At present, the quantity and quality of clinical solid tissue sequencing data remain challenging. Although our sampling is random and we did not specifically select subgroup patients based on age, gender, or other variables, we could not completely exclude possible confounding factors. We advocate more clinical cancer metastasis samples, strict data quality control, and in vivo knockout experiments in future research.
Methods
Experimental design and subject information
Patients diagnosed with CRC and willing to participate in the present study were prospectively selected. Thirteen patients who underwent radical resection of CRC or synchronous resection of colorectal primary tumor and liver metastases between April 2018 and September 2018 at Peking University Shougang Hospital were included in the study. The inclusion criteria were as follows: (1) patients are diagnosed with colorectal adenocarcinoma; (2) primary CRC or CRC with liver metastases; and (3) no preoperative chemoradiotherapy, interventional radiology, or radio frequency. Patients with hereditary CRC or multiple primary CRC were excluded. Clinicopathological characteristics included gender, age, tumor histologic type, tumor size, lymph node status, histologic grade, and TNM staging (Table S1). The extent of disease (assessed by chest computed tomography, abdominal computed tomography, rectal or liver magnetic resonance imaging) was recorded. The application to access patient tissue was approved by the Peking University Shougang Hospital Ethics Committee, and informed consent was obtained from all the patients. All ethical regulations relevant to human research participants were followed.
Biospecimen collection and processing
To ensure the quality of biological samples, we obtained patients’ samples during surgery and stored them in a 1 mL DMEM medium containing 5% FBS on ice for short-term transportation. The samples are immediately transferred to the laboratory for procession. Firstly, fat, fibers, blood vessels, and other tissues are separated under a micromanipulator to reduce the contamination of non-tumor cells. Then transfer the cleaned sample into a 1.5 mL EP tube, cut it into a homogenized shape with scissors, mix each tube with 1.5% trypsin (PBS), place it at 37 °C for 1.5 h, and mix it gently every 15 min. After obtaining the single-cell suspension, we filter it once with a 70 μm filter, wash it twice with PBS solution, and then sort the tumor cells by CD326 MicroBeads (MACS, 130-061-101). Finally, the cells are dissolved in PBS solution immediately to construct sequencing libraries. The processing of biological samples is completed within 3 h to ensure the freshness of the sample for sequencing.
RNA-seq library construction
We used PureLinkTM RNA Mini Kit (Invitrogen, 12183018A) to extract total RNA from ~106 cells. The experimental procedure was performed according to the manufacturer’s protocol. The total RNA concentration was measured using a Qubit® 3.0 fluorometer (Invitrogen).
RNA-seq library construction was performed according to the manufacture protocol provided by NEBNext® Ultra™ RNA Library Prep Kit (NEB, #E7530). In brief, Poly(A) mRNA was isolated by NEBNext Poly(A) mRNA Magnetic Isolation Module (NEB, #E7490) from 0.2 to 1 μg of total RNA. Then the mRNA was fragmented to an average insert size of 200–400 bp at 95 °C for 15 min. Following fragmentation, random primers and reverse transcriptase (NEB, #E7530) were added to reverse transcribe the RNA fragments into single-stranded cDNA. The singled-stranded cDNA was then converted into double-stranded DNA. A portion of these cDNA fragments have 5′-phosphorylated dA-tailed ends, so end repairment and adapter ligation were subsequently performed. USER enzyme (NEB #E7350) was added to the ligation mixture to cut cDNA for the reason that circular cDNA was formed after adapters (NEB #E7350) in the NEB kit were ligated to the cDNA. The linear cDNA was purified by AMPure XP beads (Beckman Coulter, A63881) and amplified via 14 PCR cycles to generate the sequencing library. After quantification by Qubit® 3.0 fluorometer (Invitrogen) and fragment size inspection by Agilent Bioanalyzer 2100 (Agilent Technologies), the libraries were sequenced using the Illumina HiSeq X Ten platform (Illumina Inc.).
ATAC-seq library construction
The ATAC-seq library was constructed using the established method72. Briefly, 5 W cells were first separated into a clean 1.5 mL EP tube and centrifuged at 500 rpm, 4 °C, and the supernatant was discarded. 50 μl of ice-cold ATAC-seq lysate was added and pipetted to the cells, which were then left on ice for 5 min to lyse. The lysed cells were centrifuged at 1000 rpm, 4 °C to obtain a precipitate. Tn5 enzyme and buffer (Vazyme, TD501) were added, and the mixture was allowed to react at 37 °C for 30 min. Then, the DNA was purified using Qiagen MinElute PCR Purification Kit immediately. Finally, the sequencing library was constructed using Custom Nextera PCR Primer 1 and 2 (Vazyme, TD202) for 8 cycles of PCR amplification, purified using Qubit® 3.0 fluorometer (Invitrogen) and quality checked by Agilent Bioanalyzer 2100 (Agilent Technologies). The library was sequenced on the Illumina NovaSeq 6000 platform (Illumina Inc.).
Hi-C library construction
In situ, Hi-C library was constructed according to the previously established method13. Briefly, ~5 × 10⁶ cells were fixed with 1% formaldehyde for 10 min at room temperature and then quenched with 2.5 M glycine. The fixed cells were lysed on Hi-C lysis buffer for 30 min on ice, followed by Mbo I (NEB, R0147) digestion overnight. On the next day, the sample was treated at 62 °C for 10 min to inactivate Mbo I, and then biotin-14-dATP (Life Technologies, 19524-016) was added to label the digested ends. Then, we added ligation master mix (NEB, B0202 & M0202) to ligate proximal DNA ends overnight. On the third day, we used Covaris LE220 (Covaris) to break the end-ligated DNA fragments into a suitable length (300–500 bp), followed by size selection with AMPure XP beads (Beckman Coulter, A63881). Dynabeads MyOne Streptavidin T1 beads (Life Technologies, 65602) were used to pull down the biotin-labeled fragments, which represent spatial chromatin interactions. Finally, the pulled-down fragment was purified by AMPure XP beads (Beckman Coulter, A63881), and the sequencing library was constructed using Illumina primers and protocols (Illumina: https://support.illumina.com.cn/content/dam/illumina-support/documents/documentation/chemistry_documentation/samplepreps_truseq/truseq-stranded-mrna-workflow/truseq-stranded-mrna-workflow-reference-1000000040498-00.pdf). Specifically, twelve PCR cycles were used to amplify the DNA, which was then purified and the library concentration was measured using Qubit® 3.0 fluorometer (Invitrogen). The Agilent Bioanalyzer 2100 (Agilent Technologies) analyzed the library fragment distribution. If both concentration and length distribution passed the quality control, the library was then sequenced using the Illumina HiSeq X Ten platform (Illumina Inc.).
Cell lines and cell culture
The human CRC cell lines HCT116 were purchased from the American Type Culture Collection (Manassas, VA, USA), which were cultured in RPMI 1640 medium (GIBCO, Carlsbad, CA) supplemented with 10% fetal bovine serum (FBS; GIBCO, Carlsbad, CA), 100 U/mL penicillin(HyClone), and 100 μg/mL streptomycin (HyClone) at 37 °C in an atmosphere of 5% CO2. The cultured HCT116 cells were tested by MycAway-Color Kit (Yeasen, Cat. No. 40611) according to the manufacturer’s protocol and the result showed there was no contamination of mycoplasma.
RNA interference and transfection
SiRNAs targeting human ARL4C, FLNA, RGCC, and negative control siRNA were designed and synthesized by Gx-health (Suzhou, China). Transfection of three mixed siRNAs (8 pM) was carried out using LipofectamineRNAiMAX (Invitrogen) according to the manufacturer’s recommendations. The target sequences for siRNAs are listed in Table S6.
RNA extraction and RT-PCR analyses
Total RNA from cells was extracted using TRIZOL reagent (Invitrogen). For RT-PCR, RNA was reverse transcribed to cDNA by using a Reverse Transcription Kit (Takara, Beijing, China). RT- PCR was performed using Power SYBR Green (Takara, Beijing China). The 2−ΔCT was calculated for every sample and normalized to GAPDH. The primer sequences are listed in Table S6.
Cell migration and invasion assay
The migration and invasion of CRC cells were evaluated by Transwell assay (8-μm pore; BD Biosciences). 4 × 10⁴ cells in serum-free medium were placed into the upper chamber of an insert for migration assays and invasion assays with 0.2% Matrigel (Corning, New York, USA). Medium containing 10% FBS was added to the lower chamber. After 36–48 h of incubation, the cells that had migrated or invaded through the membrane were fixed in 4% paraformaldehyde and stained by DAPI (4′,6-diamidino-2-phenylindole) and counted under microscope (Olympus) in five different fields. The results represent the average cell number in three wells per cell line.
RNA-seq data analysis
RNA-seq reads were first aligned to the hg19 reference genome with Hisat2 (v2.2.1, parameters: –dta-cufflinks)73. The aligned files were converted to binary files using samtools (v1.11, parameters: view -h -bS)74. The binary files were further sorted and indexed using samtools (v1.11, with default parameters). The sorted files were then performed quality control using RSeQC (v4.0.0, reference genome: hg19)75. The sorted files were then used for transcript assembly, transcript quantification, and expression matrix extraction using StringTie (v2.2.1, parameters: -B -e)76. The batch effects in gene expression matrix were removed and differentially expressed genes were screened by DEseq2 (v1.34.0, parameter: padj < 0.1)77. Gene set enrichment and variation analysis were performed by R package RNAseqStat2 (v0.1.0.9993). The differential expression and survival effects of genes in TCGA and GTEx databases were verified by GEPIA278.
The filtering pipeline and parameters for high-quality RNA-seq data were as follows. To ensure transcript integrity and avoid significant RNA degradation, we used transcript integrity number (Tin > 50) and gene body coverage skewness (cutoff > −2) to choose high-quality RNA-seq data. All RNA-seq data with low quality were excluded from our research (Fig. S6). Public RNA-seq data were also quality-controlled with the same pipeline. Data obtained from SRA database with accession number SRR13234223, SRR13234224, SRR13234225, SRR13234228, SRR13234229, SRR13234230, SRR13234222, SRR975580, SRR975560 and SRR975562 reached standard.
ATAC-seq data analysis
ATAC-seq reads were first trimmed with TrimGalore (v3.4, parameters: –phred33 –fastqc –stringency 3 –length 20 -e 0.1). Next, the trimmed fastq files were aligned to the hg19 reference genome with Bowtie2 (v2.3.5.1, parameters: –very-sensitive-local –no-unal –no-mixed –no-discordant –phred33 -I 10 -X 700)79. The aligned files were indexed using samtools (v1.11, with default parameters)74. The aligned files were performed quality control using ATACseqQC (v1.16.0)80. MACS2 (v2.2.7.1)81 was used for peak calling with the following parameters: –nomodel, –shift -100, -extsize 200.
Hi-C data analysis
Hi-C reads were first trimmed with TrimGalore (v3.4, parameters: –phred33 –fastqc –stringency 3 –length 20 -e 0.1). Next, the trimmed fastq files were processed using the HiC-Pro software (v2.11.4, parameters: genome_fragment = hg19haeiii.bed, ligation_site = GGCC)82. To eliminate the impact of sequencing depth, the output valid data of different tissues in each patient were downsampled to the same amount. The distance vs. Hi-C counts plots and Hi-C data heatmaps were generated using HiCExplorer (v2.2.1.1, command: hicPlotDistVsCounts)83. Then, A/B compartments were recognized by R package HiTC (v1.36.0, resolution: 500 kb)84. TAD hierarchical structure was identified using OnTAD (v1.2, parameters: resolution 40 kb, -maxsz 50, -minsz 1, -penalty 0.100, -lsize, -ldiff1.960000)39. The gene TAD hierarchical score (TH-score)40 was calculated using the coverage command of bedtools (v2.30.0, parameter: -mean)85. Insulation score was calculated using matrix2insulation.pl (v1.0.0, parameters: -is 500000 -ids 200000 -im mean -bmoe 3 -nt 0.1 -v)86. TAD reorganization events were detected using diffDomain41 at 40 kb resolution. Chromatin loops were called using HICCUPS (parameter: -r 1000, -p 2, -f 0.1)46. We performed aggregated peak analysis (APA) to assess the quality of the detected loops. The interaction signals surrounding a group of chromatin loops were pooled and represented by a 10 × 10 bin matrix by dividing the observed contact number by the expected contact number. In brief, the APA scores were determined by dividing the center square value by the median value of the nine squares at the lower-right corner. To identify differential loops, we merged all loops across the sample categories to generate a combined loop list and calculated APA scores for each loop in all the sample categories. APA scores were pairwise compared and fold change FC ≥ 1.5 was used as the cutoff for differential loops. Differential loops for each patient were detected using Juicer software with hiccupdiff command. The visualization of Hi-C data was performed using HiCExplorer (v2.2.1.1)83 and Juicer (v1.11.08)46 software.
Filtering pipeline for candidate 3D genome-related genes
A filtering pipeline was developed based on multi-omics data.
Firstly, differential A/B compartment, TAD, TAD score, and loop anchor regions in primary and metastatic tumors were merged. Genes whose TSS falls on the merged chromatin region were selected for further filtering. Detailed differential definitions are as follows. All chromatin bins were first assigned according to PC1 value. The label of bin equals to 1 when the PC1 value of bin is greater than zero. The label of bin equals to 0 when the PC1 value of bin equals to zero. The label of bin equals to −1 when the PC1 value of is less than zero. Then sum of tumor labels minus all controlled normal colon labels. If the subtraction result of one bin is greater than 8, this bin is classified as BtoA and differential compartment region. And if the subtraction result of one bin is less than −8, this bin is classified as AtoB and differential compartment region. Differential TADs are defined as at least one of two TAD boundaries that are differential. So, we merged all TAD boundaries as candidate differential boundaries, then if one TAD boundary is recognized as boundary in greater than 4 normal samples and recognized as boundary in less than 2 normal samples, this TAD boundary is classified as loss and differential boundary. If one TAD boundary is recognized as boundary in less than 2 normal samples and recognized as boundary in greater than 5 normal samples, this TAD boundary is classified as gain and differential boundary. TAD score was defined as interaction within TAD divided by the sum of interaction between TAD region and whole genome. For TADs with unchanged TAD boundaries in tumor and normal samples, the significance of TAD score between tumor and normal samples was calculated using DEseq2 (v1.34.0, parameter: padj < 0.05). Loops were first filtered with FDR < 0.1 and distance of anchors greater than 4 kb. For all loop anchor candidates, if the number of times a loop anchor appears in tumor samples minus the number of times the loop anchor appears in normal samples greater than 3 or less than −3, this loop anchor is defined as differential loop anchor.
Secondly, the genes located in chromatin structure differential regions intersected with differentially expressed genes. The significance of differentially expressed genes was called using DEseq2 (v1.34.0, parameter: padj < 0.05).
Next, to eliminate the effect of epigenetic modification, we filtered out genes with significant differences in H3K27ac or H3K27me3. H3K27ac and H3K27me3 with significant differences were calculated based on the signal of H3K27ac and H3K27me3 peaks. We filtered out all differential peaks with padj < 0.01 and |log2foldchange| > 1.
At last, the remained genes were intersected with genes in TCGA that significantly affected the survival period of CRC patients. The significance of the survival period was analyzed using R package survminer (v0.4.9, parameter: p < 0.1).
Chromatin structural variations analysis
Chromatin structural variation breakpoints were identified using EagleC56 (v0.1.8) with command predictSV (parameters: –hic-5k, –hic-10k, –hic-50k, -g hg19, –balance-type Raw, –prob-cutoff-5k 0.8, –prob-cutoff-10k 0.8, –prob-cutoff-50k 0.8). The output 5K_combined files were used for data analysis. Gene fusion events were annotated using EagleC (v0.1.8) with command annotate-gene-fusion (parameters: –buff-size 10000 –skip-rows 1 –ensembl-release 75 –species human).
Chromatin translocations were visualized using Hi-Cbreakfinder87.
Statistics and reproducibility
Comparisons of mean differences between two groups of samples were performed by the t-test for unpaired data. Details of performed statistical analyses are reported in the figure legends and Methods. Data are presented as mean ± SD. P value < 0.05 was considered statistically significant. All samples were included when comparing the differences among groups, which determined the sample sizes. At least three biological replicates can be used for the significance test. To ensure reproducibility, all the information regarding participants and experimental design can be found in the “Methods”.
Reporting summary
Further information on research design is available in the Nature Portfolio Reporting Summary linked to this article.
Responses