High-performance Na3V2(PO4)3/C cathode for efficient low-temperature lithium-ion batteries
3/C cathode for efficient low-temperature lithium-ion batteries")
Introduction
Lithium-ion batteries (LIBs) become widely popular for various applications due to their high energy density, long cycle life, and low self-discharge rate1,2,3. However, low temperatures (LT) inhibit LIBs performance and limit their application at high altitudes and cold weather. This poses severe challenges for the use of LIBs in aerospace, hybrid electric vehicles (HEVs), and electric vehicles (EVs)4. The main reason for the performance drop at low temperatures is the change in the properties of the liquid electrolyte and its low freezing point, which inhibits Li-ion conductivity between the cathode and anode, thereby reducing the electrochemical reaction rate2,5. Nevertheless, improving only electrolyte properties is insufficient, since changes in the properties of electrodes also limits performance of LIBs. In order to compensate for low Li-ion conductivity and sluggish interfacial charge transfer kinetics, the cathode should have a small particle size and a structure with high ionic and electronic conductivity6,7. For example, Zhao et al. increased specific capacity at −20 °C from 78.2 to 112.6 mAh g−1 by decreasing the particle size of lithium iron phosphate (LFP)8. The well-known cathode materials such as LFP and lithium cobalt oxide (LCO) were successfully commercialized due to their excellent room temperature (RT) performance. However, the low-temperature performances of both LFP and LCO are restricted by lithium-ion conductivity within one-dimensional (1D) and two-dimensional (2D) channels, respectively9,10,11. For example, LFP (Zhao et al.)12 shows 58.7% retention of RT capacity at 0.5 C at −20 °C, and LCO (Dong et al.)13 can deliver 30% capacity retention after 100 cycles at 1 C at −25 °C.
In contrast, poly-anion Li3V2(PO4)3 (LVP) features three-dimensional (3D) lithium-ion channels, which enable faster ionic mobility. LVP can form rhombohedral (r-LVP), known as a LISICON (lithium superionic conductor) structure, and monoclinic (m-LVP) phases, among which the former has a single potential plateau and faster ionic conductive structure and therefore is more suitable for LT LIBs. But since r-LVP is less thermodynamically stable than the monoclinic phase (m-LVP), r-LVP can be obtained through the Na–Li ion-exchange process from the corresponding sodium analogue Na3V2(PO4)3 (NVP). Among various sodium-based cathodes, Na3V2(PO4)3 (NVP) has garnered significant attention due to its NASICON-type structure, which provides 3D channels for fast Na-ion diffusion and high structural stability. These properties make NVP especially promising for low-temperature applications, as sluggish ion transport and interfacial charge transfer typically limit performance under such conditions14,15,16. Yang et al. presented a composite of r-LVP obtained through ion-exchange method and carbon nanofibers which remarkably maintains 69 mAh g−1 even at 100 C rate as a cathode material17. To enhance the degree of ion exchange, Jian et al. performed the process twice, achieving reversible capacities of 97.7 and 76 mAh g−1 at 2 C and 5 C, respectively18.
Li et al. synthesized rhombohedral Li2.4Na0.6V2(PO4)3/C nanoplates using a simple sol-gel method with a capacity retention of 76.7% after 500 cycles at 10 C in the 3.0–4.3 V range19. Qin et al. reported that the rhombohedral phase of Li3V2(PO4)3 exhibited 80% RT capacity retention at −30 °C due to 3D lithium-ion channels20. Liang et al. synthesized Mo-doped NVP/C in pouch-type full cells with commercial Li4Ti5O12 (LTO), maintained approximately 72.5% of RT capacity at −25 °C21. To overcome lithium loss during centrifugation and washing, ion-exchange can be conducted inside of the battery by using a lithium metal anode with increased standing time. This approach simplifies and accelerates the assembly process. Song et al. improved specific capacity from 128 to 148 mAh g−1 by increasing the standing time from 1 to 24 h22. To decrease particle size and improve electronic conductivity modified Pechini method can be used, which includes a polycondensation reaction between ethylene glycol and citric acid leading to the formation of a polymeric matrix that inhibits the growth of particles and creates conductive carbon coating23. Table 1 shows LT performance of LIBs with different cathodes.
Herein, we synthesized Na3V2(PO4)3/C by a modified Pechini method as a cathode material for LIBs. The study investigated the electrochemical, structural, and surface chemical alterations of NVP/C with lithium metal. The NVP/C electrode shows remarkable rate performance with a discharge capacity of 85.77 mAh g−1 at 5 C, 79.57 mAh g−1 at 10 C, and 63.46 mAh g−1 at the rate of 30 C. Even after 800 cycles at 1 C at RT, 86.6% of the initial capacity was retained, meaning superior structural stability. Furthermore, at the temperature of −20 °C a discharge capacity of 83.05 mAh g−1 was obtained at 0.2 C, which equals 84.33% capacity retention of room temperature.
Experimental part
Synthesis of Na3V2(PO4)3/C
The Na3V2(PO4)3/C cathode material was synthesized by the modified Pechini method17 that involves polycondensation of ethylene glycol and citric acid, leading to the formation of a polymeric matrix that prevents the growth of particles. The oxalic and citric acids were used as the reducing, chelating agents and carbon source. A vanadium (V) oxide V2O5 was used as one of the most abundant vanadium-containing reagents. The analytical grade reagents, V2O5 (Sigma-Aldrich, 98%), oxalic acid (Sigma-Aldrich, 99%), citric acid (Sigma-Aldrich, 99%) and NaH2(PO4) (Sigma-Aldrich, 99%), were taken in a molar ratio of 1:6:6:3, separately dissolved in water and ethylene glycol with a volume ratio of 3:7 and subsequently mixed together. After adding oxalic and citric acid to the V2O5, the yellow color of the solution changes to blue, showing the reduction of vanadium from V+5 to V+3. After mixing all reagents the mixture was kept upon heating for 7 h (80 °C). Then, the solution was heated to 300 °C for 2 h in a muffle furnace. The obtained residue was mortared into powder and two-step annealing in an argon atmosphere at 600 °C for 10 h and at 800 °C for 2 h in the tube furnace.
Materials characterization
The phase identification of all samples was conducted by X-ray diffraction (XRD) analysis using a Rigaku Miniflex 600 diffractometer. Rietveld refinement of the XRD data was performed using SmartLab studio II (Rigaku). The morphology was observed by scanning electron microscopy (SEM, Carl Zeiss, Crossbeam 540) and a spherical aberration-corrected scanning transmission electron microscope (Cs-STEM, JEOL, JEM-ARM200F). Element distribution was analyzed by scanning electron microscopy (SEM, JEOL, JSM-IT200(LA)) equipped with energy dispersive spectroscopy (EDS). The Raman spectrum was measured on a Raman Spectroscope LabRAM (Horiba) with a 532 nm excitation laser. The carbon content was determined using a CHNS analyzer (vario MICRO cube Elementar). An XPS analysis was conducted using an X-ray Photoelectron Spectrometer (XPS) – NEXSA (Thermo Scientific) in an ultra-high vacuum, which utilizes a Monochromated low power Al Ka X-ray source – 1486.6 eV source and 180°, double-focusing, hemispherical analyzer with 128-channel detector. Data processing was performed using the Thermo Avantage software.
Electrochemical tests
The working electrodes were prepared by homogeneously casting a slurry, containing 80 wt.% NVP/C, 10 wt.% polyvinylidene fluoride (PVDF) and 10 wt. % Super P conducting agent dissolved in N-methyl-2-pyrrolidone, on an Al foil and subsequently dried in a vacuum at 80 °C for 12 h. The electrode mass loading was measured by Ultramicrobalance (XP Micro, Metler Toledo) and made about 2 mg cm−2. The coin cells (CR2032) were assembled in an argon-filled glove box (Mbraun, Labmaster Pro DP) with lithium metal as anode and counter electrode, Whatman GF/D glass microfiber filter as separator and 1 M LiPF6 in a mixture of ethyl carbonate (EC), dimethyl carbonate (DEC) and dimethyl carbonate (EMC) (1:1:1 in v/v) as an electrolyte. For the ion-exchange process, the standing time of coin cells was set for 24 h.
Galvanostatic charge/discharge tests were carried out at a 0.2 C rate with a voltage window of 3.0–4.3 V vs. Li+/Li by using the Neware Battery Testing System at RT and −20 °C. Cyclic voltammogram (CV) measurements was conducted using VMP3 Biologic in the voltage range of 3.0–4.3 V at a scan rate of 0.1 mV s−1. The galvanostatic intermittent titration technique (GITT) was carried out at 0.1 C pulse for 10 min and with 30 min interruption between each pulse to calculate the ionic diffusivities.
Results and discussion
SEM, EDS, and TEM analysis were carried out to characterize the morphology, elemental content, and structural features of synthesized powder particles. SEM images of the NVP/C powder (Fig. 1a) demonstrated rounded nanoparticles distributed in the 50–150 nm range. The perfectly spherical shape and small size of these particles can be attributed to the polycondensation reaction between ethylene glycol and citric acid, which effectively inhibits particle growth during the synthesis process and should improve LT performance8. EDS of the powder depicted in Fig. 1b confirmed the homogeneous distribution of the elements in the active material. TEM further observed the microstructure and morphology of NVP/C. From Fig. 1c, it can be noticed that the NVP particles are well coated with the carbon matrix. Figure 1d, f also confirmed a thick and perfectly coated carbon layer of about 12 nm, which can be attributed to the high molar ratio of citric and oxalic acid, and considered essential for the modified Pechini method. In addition, these HRTEM images revealed a high crystallinity of the NVP/C with the interplanar d-spacing of 0.624 nm, which corresponds to the (012) interplane of rhombohedral NASICON-type NVP24.
3/C cathode for efficient low-temperature lithium-ion batteries")
a SEM image, b EDS map, c TEM image, and (d, f) HRTEM images of NVP/C powder.
The phase purity and crystallinity of the NVP/C pristine powder and NVP/C//Li electrode after 1st сharge-discharge cycle at 0.2 C (NVP//Li charge-discharge) was characterized by XRD (Fig. 2a). XRD analysis of lithiated NVP was conducted to investigate the success of the ion-exchange process and formation of r-LVP inside the coin cell. The cells were dismantled in an argon-filled glove box, and the extracted electrodes were washed with DMC and then dried under a vacuum. The peaks of NVP powder coincide well with the reference PDF card №00-062-0345 of NVP, indicating the absence of any impurities25, which shows that NVP obtained by the modified Pechini method was synthesized successfully. Since sodium cannot be fully substituted by lithium even ex-situ, the NVP/C//Li after 1st сharge-discharge cycle was compared with Na0.18Li2.82V2(PO4)3 (PDF card №04-025-5879) obtained by Qin et al.17. Lithiated NVP also showed clear peaks, indicating the successful ion-exchange process. The Rietveld refinement method was utilized for detailed analysis to gain a deeper understanding of the structural changes induced by the Na+/Li+ ion-exchange process (Fig. 2b, c). From the calculated lattice parameters for NVP/C and NVP/C//Li presented in Table 2, it can be concluded, that parameters a and b, and subsequently, volume of the unit cell decreased by ~0.4 Å and 87.569 Å3 in the cycled NVP/C//Li, which more likely attributed to the smaller radius of the Li+ (0.76) ions than that of the Na+ ions (1.06 Å).

a XRD spectra of NVP/C before and after charge-discharge cycling with a lithium metal anode. Rietveld-refined XRD patterns of (b) NVP/C and (c) NVP/C after charge-discharge cycling with a lithium metal anode, where observed data are indicated by red circles, the calculated pattern by a black line, and the difference pattern by blue. The residual discrepancy is shown in blue. d Raman spectra of NVP/C.
According to the CHNS analysis, the carbon content of the NVP/C cathode was 13 wt.%. Such a high carbon content can be attributed to the high molar ratio of citric and oxalic acid. The Raman spectrum of the NVP/C is shown in Fig. 2d. Two Raman peaks at 1335 and 1586.5 cm−1, are attributed to disordered carbon electronic configuration (D band) and sp2 carbon electronic configuration (G band), respectively26. The intensity ratio between the D band and G band (ID/IG) for NVP/C is equal to 1, indicating a balanced amount of disordered and graphitic carbon structures27.
Furthermore, electrochemical tests have been performed in order to evaluate the performance of the cathode under different temperatures. As shown in Fig. 3a, CV cycles of NVP/С//Li registered two oxidation peaks at ∼3.8 V and ∼4.0 V and two overlapping reduction peaks at ∼3.6 V and ∼3.8 V at RT. Sodium ions are larger and heavier than lithium ions and, therefore, should have a higher reduction peak. Therefore, the oxidation peak at ∼4.0 V and reduction peak at ∼3.6 V can be attributed to the extraction/insertion of the residual sodium. The complete disappearance of the reduction peak at ∼4.0 V after the 1st cycle can be explained by the vast excess of lithium ions, which inhibits the reduction of sodium22. Hence, a pair of oxidation/reduction peaks at ∼3.8 V/∼3.6 V is attributed to the extraction/insertion of lithium ions, which is a sign of the formation of a rhombohedral phase of LVP instead of a monoclinal phase with several peaks17. At −20 °C, NVP/C//Li demonstrated one oxidation peak at ∼4.2 V and two reduction peaks at ∼3.5 and ∼3.3 V. This indicates that an oxidation peak shifted from ∼3.8 V at RT to ∼4.2 V at −20 °C and two reduction peaks from at ∼3.6 V and ∼3.8 V at RT to at ∼3.5 V and ∼3.3 V at −20 °C. In general, the increase in polarization at LT can be a result of a decrease in the ionic conductivity of electrolytes and a slowdown of the electrochemical reactions28,29. Figure 3b shows the initial charge-discharge profile of activation at 0.2 C in the potential range of 3.0–4.3 V for 3 cycles with discharge plateaus at around 3.8 V and additional on the first cycle at 4.0 V versus Li+/Li. Consequently, the discharge plateau at 3.8 V corresponds to the removal of two equivalent Li of r-LVP, and the discharge plateau at 4.0 V in the 1st cycle can be explained by desodiation. As shown in Fig. 3b, NVP/C//Li delivers an initial charge capacity of around 200 mAh g−1 and a reversible discharge capacity of 102 mAh g−1 at 0.2 C. High irreversible capacity on the first cycle as explained previously can be attributed to the extraction of residual sodium and formation of an SEI layer30. Figure 3c shows a charge-discharge profile in the potential range of 3.0–4.3 V at 0.2 C during cycling at −20 °C. As can be seen in Fig. 3с, the initial charge curve started at ∼4 V and then gradually climbed down to ∼3.9 V. High initial polarization can be explained by the low temperature of the coin cell, which then increases affected by heating during cycling31. Figure 3d displays rate performance at RT with discharge capacity 104.64, 103.91, 101.05, 97.13, 85,77 79.57, 70.45, and 63.46 mAh g−1 at rates of 0.1, 0.2, 0.5, 1, 2, 5, 10, 20 and 30 C, respectively. After reducing the current back to 0.1 C, the discharge capacity was restored. At −20 °C, NVP/C shows discharge capacity 91.38, 81.49, 67.14, 53.32, 38.92, and 18.24 mAh g−1 at rates of 0.1, 0.2, 0.5, 1, 2 and 5 C, respectively. These results correspond to 90.62, 80.81, 66.58, 52.88, 38.6, and 18.09% of the RT capacity at 0.2 C, respectively. Figure 3e shows the cycling performance of the NVP/C//Li at RT and −20 °C during 100 cycles, and at −25 °C during 20 cycles at 0.2 C after activation. As can be seen, when cycled at RT, the discharge capacity for 100 cycles dropped from 100.53 mAh g−1 to 95.7 mAh g−1 (4.8%). At −20 °C, discharge capacity faded from 83.05 mAh g−1 (84.33% of RT capacity) in the 1st cycle to 69.14 mAh g−1 (70.21%) in the 20th cycle and then slowly decreased to 67.75 mAh g−1 (62.70%) by the 100th cycle. At −25 °C, the discharge capacity decreased from 82.11 mAh g−1 (79.30%) in the 1st cycle to 58.17 mAh g−1 (56.18%) in the 20th cycle. The primary cause of the increased capacity decay at −25 °C can be attributed to changes in the physical properties of the electrolyte and its low freezing point, which impede the movement of lithium ions between the electrodes and slow down the kinetics of electrochemical reactions. The existing capacity decay during LT cycling can be partially caused by lithium plating and the growth of the solid electrolyte interface (SEI) layer32,33,34,35,36.

a CV scans of the NVP/С at a scan rate of 0.1 mV s−1 at RT and −20 °C. Galvanostatic charge/discharge curves of the NVP/С in the potential range of 3.0–4.3 V vs. Li+/Li at (b) RT and (c) −20 °C at 0.2 C. d Rate performance of the NVP at RT and −20 °C. e Cycling performance of the NVP/С at RT, -20 °C and −25 °C at 0.2 C. f Cycling performance of the NVP/С at RT at 1 C.
After tests at −20 °C and −25 °C, the coin cells were again tested at RT and showed excellent capacity retention. Figure 3f shows the cycling performance of the NVP/C//Li at RT during 800 cycles at 1 C after activation. As can be seen, discharge capacity was reduced from 94.8 mAh g−1 to 82.1 mAh g−1 (13.39%). Overall, the good electrochemical performance of NVP/C//Li at both RT and LT can be attributed to 3D structure and small particle size, which facilitate ion transportation and carbon coating, which increases electronic conductivity.
To further understand the lithium-ion diffusion in the developed electrode at RT and LT, the galvanostatic intermittent titration technique (GITT) was performed as can be seen in Fig. 4. The cell was first charged at 0.1 C for 10 min followed by an open circuit relaxation for 30 min at RT and −20 °C. This process was repeated in the range of 3–4.3 V37.
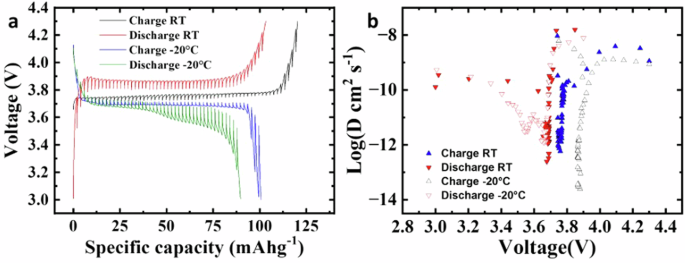
a GITT curves of the NVP cathode at RT and −20 °C. b The Li+ diffusion coefficients calculated from the GITT curves for the NVP electrode as a function of cell voltage during charge and discharge processes at RT and −20 °C.
Lithium-ion diffusion coefficient can be determined by Fick’s second law of diffusion. After a series of assumptions and simplifications, the diffusion coefficients can be calculated by the following equation:
Where mB(g), VM(cm3 mol−1), and MB(g mol−1) are the active mass, molar volume, and molecular weight of the NVP, respectively; A (cm2) and L (cm) are the surface area and the thickness of the electrode, respectively. In calculations, it is assumed that these parameters remain stable with the ion exchange process and during charge/discharge in the NVP, and the changes are ignored. ΔEs(V) is the difference between the original voltage E0 and the steady-state voltage Es, ΔEτ(V) is the total change in cell voltage during a single step, and τ(s) is the titration time. Equation (1) can be further simplified to:
The voltage–capacity curves of the GITT shown in Fig. 4a conveyed the polarization of the NVP//Li between 3 V and 4.3 V at RT and −20 °C, respectively. The lithium-ion diffusion coefficients calculated from the GITT curves of the NVP//Li as a function of voltage during charge and discharge at RT and −20 °C are shown in Fig. 4b, respectively. The log(DLi+) vs. voltage plots at RT demonstrate 1 minimum in both charge and discharge processes at ∼3.8 V and ∼3.7 V, respectively. At −20 °C, they exhibited one minimum in the charging process at ∼3.9 V and two minima in the discharge process at ∼3.65 V and ∼3.55 V. It can be clearly seen that NVP/C undergoes a two-phase transition during the discharge process at −20 °C. Na+ ions start to deintercalate after depletion of lithium-ion which cannot be replaced fast enough due to decrease of viscosity of electrolyte at LT at about 3.45 V38. In the charge process, the DLi+ app values were in the range of 5.86 × 10⁻¹³ to 9.19 × 10⁻⁹ cm2 s−1 at RT and from 2.48 × 10⁻¹⁴ to 6.14 × 10⁻⁹ cm2 s−1 at −20 °C. In the discharge process, the DLi+ app values were in the range from 2.46 × 10⁻¹³ to 1.58 × 10−08 cm2 s−1 at RT and from 1.22 × 10⁻¹² to 7.85 × 10⁻⁹ cm2 s−1 at −20 °C. The results were interrelated to the charge/discharge curves from CV peaks (Figs. 3a, 4a). The findings indicate that at low temperatures, Li ion diffusivity in the synthesized material is comparable to that at room temperature.
The formation of the cathode–electrolyte interphase (CEI) between the cathode and the electrolyte is crucial for the stability of LiB, especially for LT cycling39,40,41. To investigate chemical composition of the surface and the formation of the CEI layer, powder and electrodes were analyzed using XPS. The samples were: powder (NVP), fresh uncycled electrode (NVP electrode), and electrode after 1 cycle сharge-discharge at 0.2 C with lithium before (NVP//Li) and after etching (NVP//Li after etching). The cells were dismantled in an argon glove box, and the extracted electrodes were washed with DMC and then dried under a vacuum. As displayed in Fig. 5a, XPS survey spectra of NVP verified the absence of Na after cycling on surface and an insignificant amount of Na after etching which shows successful ion-exchange after the first cycle. The high-resolution C 1 s spectrum was analyzed (Fig. 5b), where three distinct peaks at binding energies of 284.42, 285.44, and 288.13 eV was noticed. These peaks corresponded to the presence of C=C, C-O/C-O–P, and C=O bonds, respectively42. The fresh NVP electrode shows an additional peak at 290.38 eV attributable to CF2 (PVDF)43. After cycling (NVP//Li), one can see the increase of C=O, C-O/C–O–P peaks due to the formation of CEI layer. The presence of oxygenated functional groups was further confirmed by peaks at 532.62 and 534.9 eV in the deconvoluted O 1 s spectrum, which represented by C-O/C-O–P and C=O/P=O bonds, respectively (Fig. 5c)44. Formation of C–O, C=O bonds during cycling shifted these peaks to 532.38 eV and 535.53 eV, respectively45. Additionally, the peaks at 530.63 and 531.1 eV indicated the existence of phosphate groups in NVP/C. The P-O-C bond in NVP/C was prominently displayed by a peak at 133.37 eV in the deconvoluted P 2p spectrum (Fig. 5d), with two additional peaks at 132.62 and 133.86 eV representing P=O and phosphate moieties, respectively. Cycled NVP/C demonstrated additional LiF (136.69 eV) and LixPOyFz(135.35 eV) peaks, which also show the formation of the passivation layer46. After etching, an additional peak of P-P at 130.35 eV could be formed due to the decomposition of phosphates47. Figure 5e also indicates LiF (685.7 eV) and LixPOyFz (686.12 eV) peaks after cycling. The high-resolution XPS spectrum of V 2p (Fig. 5f) exhibited two peaks at 517.07 and 524.2 eV, corresponding to the V 2p3/2 and V 2p1/2 transitions, respectively48. As expected, these peaks demonstrated a decrease of intensity due to the CEI layer. In summary, the NVP/C displayed a complex surface chemistry after cycling, characterized by the presence of P–O–C bonds and various phosphate moieties. These surface features likely contribute to the structural stability and efficient charge transfer of the electrode, making it suitable for extended cycling.
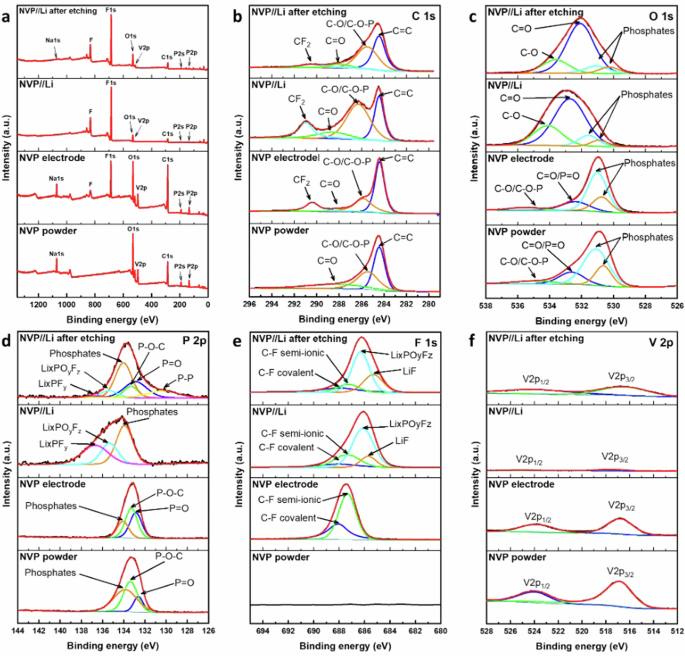
a Survey XPS spectra and deconvoluted XPS spectra of (b) C 1 s, (c) O 1 s, (d) P 2p, (e) F 1 s and (f) V 2p of fresh and cycled NVP/C.
Finally, post-mortem EDS and HRTEM analyses were carried out to characterize the morphology, elemental content, and structural features of NVP/C//Li after cycling at RT and −20 °C for 100 cycles. The EDS of the electrode, depicted in Fig. 6a, c, confirmed the unchanged homogeneous distribution of elements in the cathode. The presence of fluoride indicates the formation of a CEI (cathode electrolyte interphase) layer, and small amounts of aluminum likely originate from the aluminum current collector.

EDS mapping of NVP/C//Li after cycling at (a) RT and (c) −20 °C. (c) HRTEM images of NVP/C//Li after cycling at (b) RT and (d) −20 °C with FFT pattern.
The HRTEM in Fig. 6b, d show an interplanar d-spacing of 0.364 nm at RT and −20 °C, which corresponds to the (00-6) plane of r-LVP with residual amount of sodium49. Figure 6b, d also demonstrates no significant changes in morphology and structure after RT and LT cycling, confirming the structural stability of NVP/C//Li.
Conclusion
NASICON-structured Na3V2(PO4)3 was successfully synthesized using a modified Pechini method and evaluated for its performance as a cathode in LIBs. The synthesized NVP/C exhibited a well-dispersed morphology with rounded nanoparticles and a thick carbon layer, contributing to its structural stability. Characterization through XRD, XPS, and other techniques confirmed the successful synthesis of NVP/C and provided insights into its structural and surface chemical changes during Li+/Na+ intercalation/deintercalation. The NVP/C electrode displayed a complex surface chemistry with the presence of P-O-C bonds and various phosphate moieties, contributing to its structural stability and efficient charge transfer.
The electrochemical test results demonstrated remarkable rate performance, cycling stability, and low-temperature capability, making the NVP electrode a promising candidate for applications in lithium-ion batteries, particularly in challenging conditions such as low temperatures. At RT, the NVP/C electrode exhibited promising electrochemical properties, including discharge capacities of 85.77, 79.57, and 63.46 mAh g−1 at 5 C, 10 C, and 30 C, respectively. The specific capacity decreased by only 4.9% after 100 cycles at 0.2 C, and a retention of 86.6% of the initial capacity was achieved after 800 cycles at 1 C. The outstanding rate capability and low-temperature performance were attributed to the fast ionic conductive structure and reduced particle size of the NVP electrode.
Even under low-temperature conditions (−20 °C and −25 °C), the NVP electrode maintained a discharge capacity of 87 mAh g−1 and 82.11 mAh g−1 at 0.2 C, corresponding to 86% and 79.3% of its room temperature capacity, respectively. Moreover, after cycling and returning to room temperature, the battery recovered its original capacity, further highlighting the robustness and resilience of the NVP electrode in harsh environments. The superior cycling stability, rate capability, and exceptional low-temperature performance underscore the potential of NVP/C in applications where reliable operation under challenging conditions is crucial, including low temperatures.


Responses