Enhanced superconductivity near a pressure-induced quantum critical point of strongly coupled charge density wave order in 2H-Pd0.05TaSe2

Introduction
It is widely documented that superconductivity (SC) emerges near the quantum critical point (QCP) of various symmetry-broken phases1,2,3,4. Defined as a continuous phase transition occurring at absolute zero temperature (T = 0), the QCP and its corresponding fluctuations are currently believed to promote superconductivity in various quantum materials. For example, QCPs of antiferromagnetic orders have been found near the superconducting phase in various cuprates1 and heavy fermion superconductors2,3. Similarly, it is well known that fluctuations arising from nematic QCPs are correlated to the superconductivity of iron pnictides and chalcogenides4. A charge density wave state, which forms periodic spatial modulations of charge carrier densities, has also been found alongside superconductivity in many systems so far, ranging from cuprates1 to the recently investigated topological kagome systems5. Therefore, similar to the other neighboring orders, one can naturally question whether low-energy fluctuation of CDW order might also be closely associated with the formation of the Cooper pair.
However, contrary to the other orders, the exact role of CDW fluctuation on the emergence of SC is far from complete understanding. While competing behavior between CDW and SC has been well established since the early 1970s6, the mechanism for stabilizing superconductivity or the origin of a dome shape in the superconducting properties is still poorly understood7,8. One of the major bottlenecks is the scarcity of the material family that exhibits a QCP of CDW order. While materials that exhibit CDW are not rare, most CDW systems have been found to exhibit a 1st order quenching of the CDW order by external tuning parameters, resulting in merely an extended region of superconductivity after the suppression of CDW order without showing an optimization of SC9,10,11. Therefore, it is highly desirable to search for systems in which the CDW order exhibits a continuous phase transition at zero temperature and the optimization of superconducting order parameters.
One promising approach of inducing such a QCP of the CDW order (CDW-QCP) is to tune a temperature dependent 2nd order CDW transition to 0 K, which has been successful in provoking CDW QCPs with chemical doping/substitution as in e.g., Lu(Pt1−xPdx)2In12 and (CaxSr1−x)3Rh4Sn1313. In this regard, 2H-TaSe2, a van der Waals material with a 2nd order CDW transition at a CDW transition temperature TCDW = 122 K14 and SC with a superconducting transition temperature Tc = 0.14 K15, can be another candidate for observing the QCP by applying an external tuning parameter. However, the CDW-QCP has not been induced by intercalation or doping of other chemical element yet as TCDW remains robust; for instance, TCDW is reduced by only ~16 K with Pd intercalation between the TaSe2 layers16, and by ~ 42 K by S doping in the Se site17 before the CDW order is smeared by disorder effects or destabilized in a first order manner, respectively.
Closely related to this robustness of TCDW, recent studies have shown that the CDW order in 2H-TaSe2 exhibits various physical properties that can’t be described by a weak-coupling Peierls-type CDW instability18,19,20,21,22,23,24. For example, a large gap of 2Δ = ~6.4 kBTCDW = ~66 meV has been found at ~20 K below TCDW by the angle resolved photoemission spectroscopy (ARPES), and the gap feature with 2Δ = ~20 meV persists even at 290 K, far above TCDW18. This behavior suggests the presence of short-ranged CDW or local lattice distortions even far above TCDW, which have been independently found by X-ray diffraction19 and nuclear magnetic resonance20 studies. Consistent with these observations, an inelastic X-ray scattering study has found evidence of the Kohn anomaly, namely, substantial softening of an acoustic phonon mode near the CDW q-vector, even at 300 K14,21. This characteristic Kohn anomaly has resulted in the persistent, strong intensity of the two-phonon Raman scattering spectra even at room temperature22,23. All these observations consistently support the strongly coupled CDW state in 2H-TaSe218,19,20,21,22,23,24,25, indicating that q-dependent electron-phonon coupling linked to the formation of periodic local lattice distortions are the main driving force of the CDW formation, rather than the conventional Fermi surface nesting picture26.
In this regard, application of hydrostatic pressure (P) is expected to effectively tune the crystal lattice, which may in turn suppress the local lattice distortions and the corresponding CDW energy scales continuously. Moreover, it should be emphasized that pressure can control the system without introducing substantial disorders to the lattice, contrary to other chemical methods e.g. doping or intercalations. To better understand the interplay between strong coupling CDW and SC, we therefore employ electrical transport and Raman scattering measurements at high-pressure conditions to uncover clear evidence of pressure-induced CDW quantum critical point in a Pd 5% intercalated 2H-Pd0.05TaSe2 single crystal.
Materials and methods
Single crystal growth and X-ray diffraction measurements
Single crystals of 2H-Pd0.05TaSe2 were grown by the chemical vapor transport method using SeCl4 as a transport agent as described in our previous report16. It has been confirmed that the Pd intercalation does not alter the 2H structure of the pristine compound, as shown in the X-Ray diffraction (XRD) pattern of the 2H-Pd0.05TaSe2 in Supplementary Figure 1. For the XRD measurements, XRD θ-2θ scans of grinded powders of single crystalline 2H-Pd0.05TaSe2 were performed using a high-resolution x-ray diffractometer (EmpyreanTM, PANalytical).
In-plane resistivity and Hall effect measurements
In-plane resistivity and Hall effect measurements were performed in the PPMSTM (Quantum Design) using a standard van der Pauw configuration. For the ambient pressure measurements, the electrical contacts were attached by silver paint (Dupont 4929 N). The high-pressure measurements were performed inside a homemade NiCrAl diamond anvil cell using a pair of diamonds with a culet size of 300 μm. Silicon oil was used as a pressure transmitting medium. For the high-pressure measurements, the electrical contacts were attached by using silver epoxy (Circuitworks, CW2500). It is noted that the silver epoxy is known for providing reliable electrical contacts under high pressure conditions and has been thus widely used in the high pressure measurements involving liquid media27,28. The applied pressure was estimated from the fluorescence line of ruby particles inserted inside the gasket near the sample.
Raman spectroscopy measurements
For the Raman measurements, two pieces were cut out from a large piece of sample #3 (S3) and were used for acquiring the low temperature and room temperature spectra independently. The samples were mechanically cleaved to obtain fresh surfaces before the measurements. The Raman spectra at ambient pressure were measured by a commercial Raman spectrometer (Nanobase, XperRam200) equipped with a Nd:Yag laser with a 532 nm wavelength. For high-pressure Raman measurements performed at room temperature, a diamond anvil cell was employed using 300 μm culet diamonds. Fine-grounded NaCl was used as a pressure-transmitting medium and the pressure was determined from the shift of the ruby fluorescence line. The Raman scattering spectra were obtained by using a 532 nm laser beam. For high-pressure Raman measurements performed at low temperatures, Neon gas was used as a pressure-transmitting medium and the Raman scattering spectra were obtained by using a 488 nm laser beam. Pressure was determined from the shift of the ruby fluorescence line.
Results
Figure 1a shows the crystal structure of 2H-Pd0.05TaSe2, which consists of two hexagonal 1H-TaSe2 layers stacked along c-axis with in-plane orientation of one layer rotated by an angle of 180° to another layer. In each 1H-TaSe2 layer, one Ta ion is located in the center of a trigonal prism created by six adjacent Se ions to form in-plane covalent bonding between each other. The intercalated Pd ions are located between the van der Waals layers, indicated by a red shaded area. To measure various physical properties, we have taken three samples S1, S2 and S3 from the same batch. Figure 1b displays the temperature (T)-dependent in-plane resistivity ρab(T) of 2H-Pd0.05TaSe2 of S1, which exhibits a variety of electronic phase transitions upon the temperature being lowered. Notably, ρab(T) exhibits quite linear T-dependence at high temperatures below 300 K down to TCDW, indicating an unconventional metallic state associated with the periodic lattice distortions and the pseudogap behavior29. As the temperature is further lowered, a hump near TCDW = 115 K appears with the formation of a CDW phase, followed by a superconducting (SC) transition near Tc = 2.6 K. It is noted in the 2H-PdxTaSe2 system that the intercalation of Pd ions effectively results in electron doping30, increased lattice constants a and c16, and a reduced c/a ratio31. As a result, Pd intercalation moderately suppresses the CDW phase in 2H-Pd0.05TaSe2 (TCDW = 115 K) while it sharply enhances the SC phase (Tc = 2.6 K), as compared to those of pristine 2H-TaSe2 (TCDW = 122 K and Tc = 0.15 K)14,15.

a The 2H crystal structure of Pd0.05TaSe2 composed of two layers of 1H-TaSe2. The red shaded area represents the positions of the intercalated Pd ions. b Temperature dependence of in-plane resistivity, ρab, of the sample S1 of 2H-Pd0.05TaSe2 at 0 ≤ P ≤ 34.7 GPa. The black arrow marks the CDW transition temperature TCDW. c Temperature dependence of dρab/dT of S1 for 0 ≤ P ≤ 21.5 GPa. Plots are shifted downwards by a constant value for clarity. The colored arrows indicate dips in the dρab/dT data realized at TCDW. d Temperature dependence of the Hall coefficient RH measured in the sample S2 at 0 ≤ P ≤ 31.8 GPa. RH is obtained from a linear fit to the Hall resistivity measured at magnetic fields of -4 T ≤ μ0H ≤ 4 T applied along the c-axis. The red colored arrow denotes the TCDW estimated from the RH curve; the temperature where a negative drop in the RH curve starts in is determined by linear extrapolations of high and low temperature traces.
To investigate the effect of pressure on the CDW order, we have measured ρab(T) at various pressures. It can be seen that the resistivity at 300 K decreases by almost 50% from 0.18 mΩ cm at ambient pressure to 0.10 mΩ cm at P = 34.7 GPa, indicating that pressure plays a role of increasing electrical conductivity. Furthermore, with increase of pressure, the hump feature in ρab(T) curves becomes weak and TCDW decreases monotonically to lower temperatures, suggesting the gradual suppression of the CDW order. We can identify TCDW as a dip from the dρab/dT curve, which shifts to lower temperatures down to ~45 K at 20.4 GPa (Fig. 1c). Figure 2a presents the traces of TCDW as determined from the dip position (solid circles, sample S1). Another independent measurement on S2 provides a similar trace. This dip fades out near a critical pressure Pc = ~21.5 GPa, implying the disappearance of the CDW order at the quantum phase transition realized at Pc.

a Electronic phase diagram of 2H-Pd0.05TaSe2 with pressure. The filled blue circles represent TCDW as obtained from the ρab(T) measurements of S1 while the unfilled purple triangles represent the TCDW estimated from the RH measurements in S2. A dashed black curve represent a guide to the eye. The filled green triangles represent the Tc as obtained from ρab measurements from S1. Tc is plotted after being multiplied by a factor of 3 for clarity. b Pressure-dependence of the Hall coefficient RH (purple diamonds, left axis) at 10 K shown in Fig. 1d. Pressure dependence of the integrated intensity of the two-phonon Raman scattering at 300 K (right axis) presented in Fig. 5e. c Pressure dependence of (({left|{boldsymbol{d}}{{boldsymbol{H}}}_{{boldsymbol{c}}{boldsymbol{2}}}^{{boldsymbol{c}}}/{boldsymbol{dT}}right|}_{{{boldsymbol{T}}}_{{bf{c}}}}/{{boldsymbol{T}}}_{{boldsymbol{c}}}))1/2 obtained from the analysis of Fig. 3. A vertical dotted line indicates the critical pressure Pc ~ 21.5 GPa.
The temperature-dependent Hall coefficient RH measured at various pressures between 0 ≤ P ≤ 31.8 GPa provides further insight into the electronic structure evolution with the pressure. At ambient pressure, RH is positive and exhibits a weak T-dependence above TCDW (Fig. 1d). Near the onset of the CDW transition as determined by the dρab/dT, RH steeply decreases toward lower values to become negative, which is attributed to the opening of the CDW gap near the K-barrel (a hole pocket) of the Fermi surface according to the ARPES results18,32. It is noticed that the abrupt change in RH found below ~TCDW shifts toward lower temperatures and becomes broader with the pressure increase. To estimate the TCDW from the RH curve, the temperature below which a negative drop in the RH curve starts was determined by linear extrapolations at both high and low temperature traces of the RH curves. The inverted triangles in Fig. 2a summarize TCDW estimated from the drop of RH curves, which shows nearly consistent behavior with TCDW estimated from the ρab data.
The RH values measured at 10 K (Fig. 2b) also provides the insight into the pressure driven evolution of the CDW states. RH values above TCDW at ambient pressure are positive and nearly temperature-independent, indicating the transport dominated by hole carriers above TCDW. On the other hand, below TCDW, RH starts to develop a downward shift, indicating that electron pockets contribute to the transport more significantly. The negative contribution increases as temperature is lowered; at 10 K, RH reaches nearly a saturating value of −4.7 × 10⁻¹⁰ m3/C. With increase of pressure, RH around 10 K increases systematically to positive values until the P reaches 22.1 GPa, and at the pressure above 22.1 GPa, it stays nearly constant, indicating that the suppression of CDW state leads to the disappearance of the negative contribution. The almost P-independent RH from 22.1 to 31.8 GPa confirm complete suppression of the CDW order near 22.1 GPa. The linear extrapolation of the RH data at a low-pressure regime provides an estimated critical pressure of 22.8 ± 1.4 GPa, which is close to the Pc = 21.5 GPa of the CDW quantum phase transition estimated from the ρab(T) measurements.
While the CDW state is continuously suppressed by pressure application, Tc is found to be maximized near Pc. This behavior is illustrated in the low temperature ρab(T) as shown in Fig. 3a. At ambient pressure, a clear drop in ρab(T) to zero value is found, indicating Tc = 2.6 K as defined by the 50% resistivity criterion. With the application of pressure, Tc increases from 2.6 K at ambient pressure to attain a broad maximum value of ~8.5 K around Pc = 21.5 GPa (~8.2 K at 20.4 GPa and ~8.4 K at 22.8 GPa) and then decreases to ~7.2 K at 34.7 GPa. The Tc vs. P curves summarized in the phase diagram of Fig. 2a indeed demonstrate that the Tc trace forms a dome shape centered around Pc = 21.5 GPa, showing optimized superconductivity in the vicinity of Pc. The overall phase diagram in Fig. 2a also suggests that at ambient- and low-pressure regimes, the CDW and SC phases in 2H-Pd0.05TaSe2 might coexist each other. As pressure increases toward Pc, Tc is systematically enhanced with the simultaneous suppression of TCDW, thus exhibiting competing nature of the CDW and superconducting orders.

a Low temperature behavior of ρab in 2H-Pd0.05TaSe2 (S1) for 0 ≤ P ≤ 34.7 GPa. b Temperature dependence of upper critical fields μ0({{boldsymbol{H}}}_{{boldsymbol{c}}{boldsymbol{2}}}^{{boldsymbol{c}}}) at the magnetic field applied along the c-axis for 0 ≤ P ≤ 34.7 GPa. Also plotted are the best fit results of the single-band Werthamer–Helfand–Hohenberg (WHH) model. Pressure dependence of (c) the upper critical field at zero temperature μ0({{boldsymbol{H}}}_{{boldsymbol{c}}{boldsymbol{2}}}^{{boldsymbol{c}}})(0) and d the in-plane superconducting coherence length ξab,0 obtained from the WHH fit results. A vertical dotted line indicates the critical pressure Pc =~ 21.5 GPa.
To further characterize the optimized superconductivity near Pc, we have measured the P,T-dependent upper critical fields under magnetic fields H applied along the c-axis, μ0({H}_{c2}^{c})(T), (Fig. 3b). In order to extract the pressure evolution of the μ0({H}_{c2}^{c})(T = 0), we have fitted the μ0({H}_{c2}^{c})(T) curves in each pressure by employing the Werthamer–Helfand–Hohenberg (WHH) equation33,
Here, t is the reduced temperature T/Tc, (bar{h}) = (4/π2)(Hc2(T)/|dHc2/dT | Tc), λso is the spin-orbit scattering constant, and α is the Maki parameter. The best fit results for a minimal model of λso = α = 0, which neglects the spin-orbit coupling and assumes a pure orbital limiting case, are shown in dashed lines in Fig. 3b. The pressure dependence of μ0({H}_{c2}^{c})(T = 0) is clearly maximized from 0.87 T at 2.2 GPa to a 7-fold increased value of 6.3 T at 21.5 GPa, and then decreases back to 2.8 T at 34.7 GPa. As a result, P-induced evolution of μ0({H}_{c2}^{c})(0) plotted in Fig. 3c shows that they are sharply enhanced near Pc = 21.5 GPa. The P dependence of the superconducting coherence lengths ξab(0)’s, estimated by the Ginzburg-Landau expression34 μ0({H}_{c2}^{c})(0) = Φ0/2πξab(0)2, consistently shows that the minimum ξab(0) of 7.23 nm is realized at Pc (Fig. 3d). Therefore, along with the dome-shape in Tc centered at Pc, μ0({H}_{c2}^{c})(0) (ξab(0)) values exhibit a sharp maximum (minimum) at Pc.
Figure 2c summarizes the pressure dependence of the (({|d{H}_{c2}^{c}/{dT}|}_{{{boldsymbol{T}}}_{{bf{c}}}}/{T}_{c}))1/2 obtained from the analysis of Fig. 3, where ({|d{H}_{c2}^{c}/{dT}|}_{{{boldsymbol{T}}}_{{bf{c}}}}) represents the (d{H}_{c2}^{c})/dT values obtained near Tc. It has been shown by the Ginzburg-Landau theory that if the Fermi wavevector of Bogoliubov quasiparticles is smoothly varying over pressure variation, the relationship ({|d{H}_{c2}^{c}/{dT}|}_{{{boldsymbol{T}}}_{{bf{c}}}}/{T}_{c}) (propto) m*2 holds35,36,37. Here, m* is the average effective mass of the quasiparticles in the ab-plane. Therefore, the sudden peak behavior in ({|d{H}_{c2}^{c}/{dT}|}_{{{boldsymbol{T}}}_{{bf{c}}}}/{T}_{c}) indicates that the effective mass of the quasiparticles in the superconducting state is peaked at Pc. This supports that the CDW-QCP and associated critical fluctuation can increase the effective mass near the critical pressure.
All these evolutions of the TCDW and Tc with pressure clearly show that the optimization of the superconductivity occurs at or in close vicinity to Pc, suggesting that the suppression and fluctuation of the CDW order expected at the CDW-QCP could be helpful in enhancing the superconducting pairing strength. This is a rare case of observing a CDW-QCP linked to the optimization of superconductivity among the class of 2D van der Waals materials. Note that most of other 2D transition-metal chalcogenides with CDW instability often exhibit a first-order transition of the CDW state that mostly competes with SC under variation of external turning parameters9,10 or mere coexistence of SC with the CDW state without showing any evidence of a link between the optimized superconducting properties and a putative CDW-QCP38,39.
In order to check whether the fluctuation of CDW order expected at the CDW-QCP can affect the electrical transport in the normal state before forming the Cooper pair, we have applied external magnetic field along the c-axis (μ0({H}^{c})) of 9 T to investigate ρab(T) behavior above ~1.8 K at each pressure (Fig. 4a). Note that Tc becomes always less than 3 K at μ0({H}^{c},)= 9 T, allowing us to investigate more easily transport of the normal state at lower temperature regions. At ambient pressure, ρab at μ0({H}^{c},)= 9 T can be successfully described by a quadratic power law fit ρab(T) = ρ0 + AT2 (black solid line), at least up to ~10 K, defined here as an effective Fermi liquid temperature TFL. Above the TFL, the experimental data steeply increase upward, deviating from the Fermi liquid behavior. This suggests that the electron-electron scattering inherent to the Fermi liquids dominate the transport for 2H-Pd0.05TaSe2 at ambient pressure below TFL while the extra scattering, i.e., electron-phonon scattering starts to contribute more conspicuously above TFL.

a The ρab curves of S1 measured at a magnetic field of μ0({{boldsymbol{H}}}^{{boldsymbol{c}}}) = 9 T applied along the c-axis. The data in the normal state are fitted by a quadratic power law of ρ = ρ0 + AT 2 (black lines). The plots of (ρab – ρ0) vs. T2 for (b) 0 ≤ P ≤ 21.5 GPa and c 22.8 ≤ P ≤ 34.7 GPa. The black lines are linear guidelines. Black arrows mark the deviating temperature from the linear behavior for each pressure, TFL, below which the Fermi liquid behavior starts. d The pressure dependence of TFL. The pressure-evolution of fitting parameters e ρ0 and f A1/2 obtained from the best fit to ρ = ρ0 + AT 2 curves below TFL.
It turns out that such a quadratic power law behavior is persistently found at all the pressure ranges investigated in the low temperature region of the ρab(T) curves at μ0({H}^{c},)= 9 T. Figure 4b, c shows the (ρab – ρ0) vs. T2 plots of 2H-Pd0.05TaSe2, confirming that (ρab – ρ0) exhibit linear behavior to T2 below TFL. With the application of pressure, it is found that TFL does not change up to 19.5 GPa, indicating negligible P-dependence of the Fermi liquid properties. However, from 20.4 GPa, TFL starts to exhibit an increase to ~13 K and exhibit a maximum TFL ~ 15 K near Pc = 21.5 GPa, indicating an enhanced Fermi-liquid energy scale just below and at Pc. Above Pc = 21.5 GPa and up to ~25.6 GPa, the TFL is slowly decreased down to ~13 K and becomes nearly saturated up to 34.7 GPa (see, Fig. 4d). Moreover, ρ0 determined by extrapolation of ρab(T) to 0 K exhibits negligible change with pressure up to 19.5 GPa and subsequently a systematic drop at 19.5 GPa ≤ P ≤ 22.8 GPa, roughly consistent with the pressure window of exhibiting the TFL increase (Fig. 4e). Moreover, at the regime at 22.8 GPa ≤ P, ρ0 maintains nearly constant values initially up to 25.6 GPa but slowly decreases above. This reduced residual resistivity and the increased TFL far above Pc as compared with those far below Pc could be related to the expected recovery of the Fermi surface with the suppression of the CDW gap in a mean field level. However, there exist a pressure window of exhibiting the extra increase of TFL beyond the expected behavior of a constant increase across the collapse of the CDW state, which is roughly between 19.5 and 25.6 GPa. This indirectly indicates that the fluctuation of the CDW order expected at the CDW-QCP may affect the low-T transport behavior near Pc.
It is also surprising to find that the square root of the quadratic power law coefficient A1/2, which is 3.3 ×10⁻⁵ Ω1/2cm1/2/K at ambient pressure, gradually increases to 6.3 ×10⁻⁵ Ω1/2cm1/2/K at 19.5 GPa and is quickly enhanced to 7.1 ×10⁻⁵ Ω1/2cm1/2/K in a pressure window between ~19.5 GPa and ~25.6 GPa near Pc (Fig. 4f). Namely, A1/2 exhibits a sharp peak at Pc = 21.5 GPa but is enhanced in an extended P region of ~6 GPa near Pc. According to the Kadowaki-Woods relation40 of A = αKW γ02 and the expression of the Sommerfeld coefficient41 γ0 = 1/3π2kB2(1+λep+λee)N(εF), which is valid for the Fermi liquid states, A1/2 should be proportional to N(εF)(1+λep+λee). Here, αKW is the Kadowaki-Woods ratio, kB is the Boltzmann constant, N(εF) is the electronic density of states, and λep (λee) is the electron-phonon (electron-electron) coupling constant. Note that while electron-phonon coupling might be important for pairing mechanism for the superconductivity within the BCS mechanism, many-body effects resulting in the enhancement of the Sommerfeld coefficient might also include both electron-phonon and electron-electron interactions. As a result, 2H-Pd0.05TaSe2 exhibits the enhancement of N(εF) (1+ λep + λee) by a factor 2.15 near Pc. All these observations suggest that the CDW-QCP and associated critical fluctuation can increase the effective mass (Sommerfeld coefficient) of the normal state carriers in an extended P region near Pc at low temperatures.
Note that our observation of the Fermi liquid behavior near the CDW-QCP is in contrast to the magnetic QCP case wherein the non-Fermi liquid behavior is often observed, for example, ρab(T) = ρ0 + AnT n with n ~ 1. In previous studies investigating transport behavior near the CDW-QCP with the fitting scheme of ρab(T) = ρ0 + AnTn12,35,42, it was found that n exhibits a minimum value between ~1.8 and 2.1 near the CDW-QCP while it is systematically increased up to toward higher values ~ 2.8–3.0 as the system reaches the phase regions far away from the CDW-QCP. When we apply a similar fitting scheme of ρab(T) = ρ0 + AnTn to the data between the temperature window of ~1.8 and 20 K shown in Fig. 4a, we also find out a similar behavior in the evolution of n with pressure (see, Supplementary Note 2 for further details).
To find spectroscopic signatures on the evolution of CDW order with temperature and pressure, Raman scattering measurements have been performed in a single crystal of 2H-Pd0.05TaSe2. Figure 5a presents the temperature-dependent Raman shift in a frequency window of 10–100 cm−1 at ambient pressure. At T = 20 K, three CDW related modes can be identified; following similar modes at 82, 64, and 49 cm−1 as reported in a pristine 2H-TaSe222, they can be assigned as an A1g amplitudon mode ({{boldsymbol{A}}}_{{boldsymbol{1}}{boldsymbol{g}}}^{{boldsymbol{amp}}}) (yellow triangles) at 80 cm−1, an A1g phason mode ({{boldsymbol{A}}}_{{boldsymbol{1}}{boldsymbol{g}}}^{{boldsymbol{pha}}}) (gray arrow) at 57 cm−1, and an E2g amplitudon mode ({{boldsymbol{E}}}_{{boldsymbol{2}}{boldsymbol{g}}}^{{boldsymbol{amp}}}) at ~45 cm−1, respectively. On the other hand, the E2g phason mode, found at 41 cm−1 in 2H-TaSe222, can’t be discerned in this study, possibly because it may be too close to the ({{boldsymbol{E}}}_{{boldsymbol{2}}{boldsymbol{g}}}^{{boldsymbol{amp}}}) mode or lower than our frequency limit of ~10 cm−1. Upon raising the temperature close to TCDW = 115 K, the frequency of ({{boldsymbol{E}}}_{{boldsymbol{2}}{boldsymbol{g}}}^{{boldsymbol{amp}}}) mode particularly shifts to lower frequencies close to zero, thereby proving the suppression of the CDW excitation energy nearly to zero with T approaching TCDW. By fitting the peak frequency of the ({{boldsymbol{E}}}_{{boldsymbol{2}}{boldsymbol{g}}}^{{boldsymbol{amp}}}) mode to the T-dependent power law, TCDW = ~ 115 K (green arrow) could be extracted, being consistent with the TCDW = 115 K from the ρab(T) in Fig. 1. (see, Supplementary Figure 3 for the detailed fitting results). Note that although the ({{boldsymbol{A}}}_{{boldsymbol{1}}{boldsymbol{g}}}^{{boldsymbol{amp}}}) mode frequency also shows a steep decrease with T increase, the mode intensity gets too small at T > ~ 70 K, making the ({{boldsymbol{A}}}_{{boldsymbol{1}}{boldsymbol{g}}}^{{boldsymbol{amp}}}) mode untraceable at higher temperatures. Moreover, the A1g phason mode shows a slight decrease upon T being increased to TCDW before disappearing. As a result, the frequency of the ({{boldsymbol{E}}}_{{boldsymbol{2}}{boldsymbol{g}}}^{{boldsymbol{amp}}}) mode seems to be most sensitively reflecting the systematic suppression of the CDW excitation energy with T evolution.
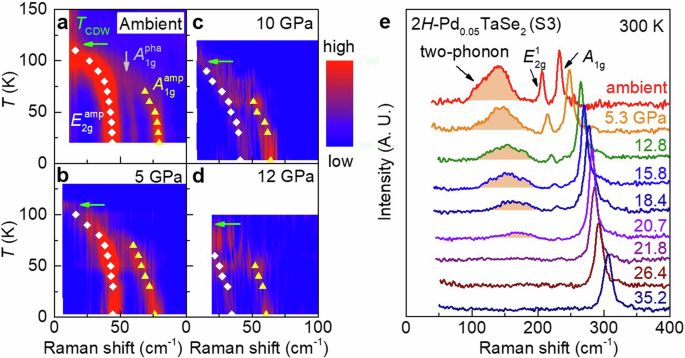
a–d Color contour plots of the temperature-dependent Raman shift at 0 ≤ P ≤ 12 GPa. The yellow triangles and white diamonds represent the frequencies of the CDW amplitudon modes A1gamp and E2gamp, respectively. The A1g phason mode, A1gpha, is only detected at ambient pressure, possibly due to the higher signal-to-noise ratio. The green arrows mark TCDW as obtained by the in-plane resistivity measurements shown in Fig. 1. e Raman spectra of 2H-Pd0.05TaSe2 at pressures between 0 ≤ P ≤ 35.2 GPa at room temperature. The curves have been vertically shifted for clarity. The orange shaded areas indicate that the broad two-phonon peak systematically decreases its intensity with application of P up to 20.7 GPa and disappears above 21.8 GPa.
To investigate how the CDW excitation energy will evolve with pressure close to Pc, we have performed low-temperature Raman scattering under high-pressure conditions. Figure 5b–d presents the Raman shifts vs. temperature summarized at 5, 10, and 12 GPa, respectively. The ({{boldsymbol{A}}}_{{boldsymbol{1}}{boldsymbol{g}}}^{{boldsymbol{amp}}}) and ({{boldsymbol{E}}}_{{boldsymbol{2}}{boldsymbol{g}}}^{{boldsymbol{amp}}}) modes can be clearly identified at 3 K for all three pressures studied. Notably, the frequencies of both the amplitudon modes are found to decrease with applied pressure; the ({{boldsymbol{A}}}_{{boldsymbol{1}}{boldsymbol{g}}}^{{boldsymbol{amp}}}) from 80 cm−1 at ambient pressure to 61 cm−1 at 12 GPa, and ({{boldsymbol{E}}}_{{boldsymbol{2}}{boldsymbol{g}}}^{{boldsymbol{amp}}}) from 45 cm−1 at ambient pressure to 35 cm−1 at 12 GPa. Upon raising the temperature, the frequency of ({{boldsymbol{E}}}_{{boldsymbol{2}}{boldsymbol{g}}}^{{boldsymbol{amp}}}) modes for each pressure, shifts to lower frequencies close to zero, indicated by the green arrows corresponding to the TCDW obtained by the resistivity measurements in Fig. 1. However, the CDW amplitudon modes could not be traced above 12 GPa, as the mode intensity becomes weak and its shape gets broadened with increase in pressure (see, Supplementary Figure 4 for the raw data). As a result, from the temperature-dependent Raman measurements, both the amplitudon peak energies and TCDW are confirmed to be suppressed with pressure at least up to 12 GPa.
In order to trace a continuous change in the lattice dynamics up to Pc ~ 21.5 GPa by the suppression of the CDW order, we have further investigated the pressure evolution of the two-phonon scattering resulting from the Kohn anomaly in the room-temperature Raman spectra (Fig. 5e). The three peaks observed in the ambient-pressure spectrum can be assigned as a two-phonon mode at 141.5 cm−1, an in-plane E2g1 vibrational mode at 206.0 cm−1, and an out-of-plane A1g mode at 232.3 cm−1, based on the comparison with the data in a pristine sample22. Here, we highlight the evolution of the two-phonon mode with pressure, which can effectively show the presence of the Kohn anomaly coming from the CDW correlation at room temperature14,23. It has recently been shown by an inelastic X-ray scattering study that the Kohn anomaly in 2H-TaSe2, i.e., the anomalous softening of the longitudinal acoustic phonon dispersion at qCDW = (0.3, 0, 0) in the momentum space, is persistently found at T far above TCDW and survives even at room temperature. The Kohn anomaly shortens the bonding between the three Ta atoms, thereby increasing the intralayer overlap of Ta-5({{boldsymbol{d}}}_{{boldsymbol{xy}}}) and Ta-5({{boldsymbol{d}}}_{{{boldsymbol{x}}}^{{boldsymbol{2}}}{boldsymbol{-}}{{boldsymbol{y}}}^{{boldsymbol{2}}}}) orbitals24. The prevailing two-phonon Raman scattering at high temperatures directly support the presence of the short-range CDW correlation with local lattice distorting involving three Ta sites, a characteristic of a CDW state in a strong coupling regime.
As indicated by the orange-shaded area in Fig. 5e, the intensity of the two-phonon Raman mode exhibits a systematic decrease with application of pressure. With increase of pressure from ambient pressure up to 20.7 GPa, the intensity progressively decreases and disappears above 21.8 GPa. As a result, when the intensity of the two-phonon mode is integrated with a liner background subtracted, the integrated intensity summarized in Fig. 2b (right axis) exhibits a nearly linear decrease. Upon a linear extrapolation, the critical pressure of reaching zero integrated intensity is estimated as 21.7 ± 0.6 GPa, which is quite close to Pc = 21.5 GPa, the critical pressure where the QCP of the CDW state is realized at low temperatures. Namely, the two-phonon Raman scattering at room temperature, i.e. the Kohn anomaly due to the short-range CDW correlation, truly disappears at the pressure close to Pc. Our observations support that the local lattice distortion as a main characteristic of short-range CDW correlation also controls the stability of the CDW state near the QCP. Therefore, it is concluded that both short-range and long-range CDW state can be continuously suppressed by squeezing lattice isotopically by the pressure, leading to the nearly same critical pressure of Pc. In this regard, the pressure seems to be an effective tuning parameter for suppressing continuously the local three Ta site distortions, the building block of the strong-coupling CDW state realized in 2H-TaSe2 at both room and low temperature regions.
Discussions
A noteworthy aspect in the temperature-pressure phase diagram of 2H-Pd0.05TaSe2 (Fig. 2) is that the Pc = 21.5 GPa showing optimal superconductivity in 2H-Pd0.05TaSe2 is lower than the Pc = ~23–28 GPa showing optimal superconductivity in a pristine 2H-TaSe243. As our results indicate that superconductivity optimatized at the CDW-QCP in 2H-Pd0.05TaSe2, this strongly suggests that a CDW-QCP should exist in the pristine 2H-TaSe2 as well, presumably near the critical pressure of ~23–28 GPa. While the full suppression of the TCDW had not been traced in a previous work in 2H-TaSe243, it is found that the TCDW = 122 K of 2H-TaSe2, which is higher than the TCDW = 115 K of 2H-Pd0.05TaSe2 at ambient pressure, evolves to TCDW = ~ 90 K at 20 GPa. This TCDW of 2H-TaSe2 at the high pressure is indeed higher compared to the TCDW = 52 K (45 K) of 2H-Pd0.05TaSe2 at 19.5 GPa (20.4 GPa), supporting the scenario that a CDW-QCP should exist at higher pressures in the pristine 2H-TaSe2. Therefore, these observations strongly suggest that the pressure for optimized superconductivity should be linked to the critical pressure for the CDW-QCP in both 2H-TaSe2 and 2H-Pd0.05TaSe2.
A generic origin for the sharply enhanced N(εF)(1+λep+λee) near Pc in pressurized 2H-Pd0.05TaSe2 needs further considerations. One natural outcome of the continuous suppression of CDW state is the increase of effective carriers across Pc to result in the increase of N(εF) above Pc. However, with the fluctuating CDW amplitude expected near Pc, the effective bandwidth of the system can be reduced sharply near Pc to possibly induce a sharp enhancement in N(εF) in a mean field level near Pc, thereby resulting a maximized Tc at Pc. However, the enhancement via the many-body effects should be also considered. Although a sharp enhancement of λep near Pc can’t be ruled out, it is usually expected that the electron-phonon interaction is more or less fixed in one crystal structure. If so, it is more likely that fluctuating CDW amplitude might cause an additional effective increase of λee near Pc44. Whichever scenarios are suitable for the microscopic mechanism, our observations unambiguously point out that the CDW fluctuations expected at the CDW-QCP can be helpful in optimizing superconductivity in the 2H-TaSe2 as well as Pd intercalated 2H-TaSe2.
Conclusion
In conclusion, the pressure-dependent electrical transport and Raman scattering spectra have been investigated in 2H-Pd0.05TaSe2. Through comprehensive analysis of the resistivity and Hall effect, we have demonstrated the continuous suppression of CDW order with pressure-increase, resulting in TCDW approaching to zero Kelvin at a pressure-induced QCP at Pc ~ 21.5 GPa. At this QCP, both the superconducting transition temperature Tc and the upper critical field Hc2 reach their maximum values. The simultaneous disappearance of the CDW amplitudon mode and the suppression of two-phonon scattering under pressure further corroborate the existence of a CDW-QCP. These observations provide direct evidence for the formation of a CDW-QCP at Pc, indicating that charge and lattice fluctuations associated with the QCP of strongly coupled CDW order can enhance SC in pressurized 2H-Pd0.05TaSe2.


Responses