Kinetic origin of hysteresis and the strongly enhanced reversible barocaloric effect by regulating the atomic coordination environment

Introduction
Hysteresis, an intrinsic property of first-order phase transition (FOPT) materials, is a complex phenomenon that involves a material’s response to external stimuli, e.g., stress, temperature, or magnetic fields. Hysteresis is prevalent in caloric effect materials with a FOPT, and it is difficult to predict and control, which has always perplexed researchers1,2,3,4,5,6,7,8. Various attempts, such as doping, introducing porosity, and applying hydrostatic pressure, have been made to reduce hysteresis loss. A marked reduction in hysteresis loss in Heusler NiMnCoIn alloys has been achieved by using a multicaloric cycle combining a magnetic field with hydrostatic pressure2. Moreover, a magnetic‒electric multicaloric cycle in an FeRh/BaTiO3 heterostructure was proposed, and a reduction in hysteresis loss was observed3 when magnetic and electric fields were simultaneously applied during the demagnetization process. Furthermore, a nonvolatile reduction in hysteresis loss was realized in FeRh/PMN-PT via the strain memory effect provided by the PMN-PT substrate4. In particular, elemental substitution is a powerful tool for investigating hysteresis behavior because different elements can modify the magnetism/phase transition behavior after entering the lattice/interstitial positions. The discontinuous behavior of the phase transition induced by external fields in FOPT materials is related to a thermoelastic martensitic phase transformation, a feature that provides a large caloric effect and is widely believed to be the source of the hysteresis effect. Furthermore, the peak temperature of the forward martensitic transformation decreases with increasing cooling rate, which is a typical form of thermal hysteresis that occurs during the thermally activated growth process5. According to the thermal activation model of FOPTs6,7, the system transforms from one structure to another (i.e., the state corresponding to the local minimum of the free energy) because of local instability during a FOPT under external stimuli. This process thermodynamically determines the height of the two-phase transition barrier and profoundly affects the hysteresis width of the transition6,7. Specifically, the origin of hysteresis can be divided into intrinsic contributions related to electronic properties at the atomic scale and extrinsic factors related to the microstructure8. Extensive research has been conducted on extrinsic factors contributing to hysteresis; however, the intrinsic origins of hysteresis remain poorly understood. In terms of the intrinsic factors contributing to hysteresis, the most critical parameter is magnetism in addition to the order of the transition, which not only controls the magnetostructural coupling but also affects the hysteresis width. It is therefore necessary to understand the characteristics of magnetic ordering within the framework of complex electronic structures.
MnCoGe compounds with a ferromagnetic ground state undergo a martensitic transition from the Ni2In-type hexagonal (space group P63/mmc) to the TiNiSi-type orthorhombic (space group Pnma) structure. As a candidate material for magnetic refrigeration at room temperature, MnCoGe-based ferromagnets have attracted much attention owing to the following advantages: (i) strong magnetostructural coupling that can be easily established and highly tuned between the Curie temperatures of two phases by elemental substitution, the introduction of vacancies, and hydrostatic pressure9,10,11; (ii) a paramagnetic–ferromagnetic-type magnetostructural transition (MST) that gives rise to the same sign of enthalpy change during the martensitic and magnetic transitions, leading to a greater entropy change than other MCE materials12; and (iii) compounds with desirable compositions that can be easily produced. However, the first two points present disadvantages for the MnCoGe-based system, i.e., the first-order nature of the MST inevitably results in the occurrence of thermal and magnetic hysteresis, which usually reduces the cooling efficiency13,14 and even disrupts the thermal dynamic cycle2,15. For MnCoGe-based alloys, previous research has shown that incorporating dopants with different radii and valence electron numbers at magnetic (Mn, Co) or nonmagnetic sites (Ge) can regulate the strength of magnetostructural coupling, as well as crystallographic stability, in turn manipulating hysteresis16,17,18. For example, in (Mn1−xCrx)CoGe, the hysteresis increases from 10–20 K as x increases from 0.04–0.25 owing to magnetostructural coupling16. However, the evolution of hysteresis in this system is difficult to understand, mainly owing to the lack of clarity regarding its regulatory mechanisms at the atomic scale.
In this work, we report a detailed study of the kinetic origin of hysteresis in MnCoGe-based alloys by combining ab initio calculations and neutron powder diffraction (NPD) with magnetic and calorimetric measurements. By taking MnCoGe as the starting material, nonmagnetic In atoms with a large atomic radius and low electron number are introduced to partially (2%) replace the magnetic sites (Co) and nonmagnetic sites (Ge), respectively, under a constant Mn atom content, which provides the main magnetic moment. We aimed to determine the relationship between hysteresis and the intrinsic properties of the material. Our first-principles calculations revealed that the substitution of Ge sites with In atoms has a lower energy barrier than the replacement of Co sites does, indicating a narrower hysteresis. This theoretical result has been verified by our experimental observations. We synthesized MnCo(Ge1−xInx) and Mn(Co1−xInx)Ge (x = 0.02) with In atoms introduced to replace the same amount of Ge and Co, respectively. Our NPD measurements confirmed the occupancies of In atoms in different samples. The measured thermal hysteresis of MnCo(Ge0.98In0.02) was markedly lower than that of its Mn(Co0.98In0.02)Ge counterpart, which is consistent with the theoretical results. Furthermore, electronic localization function (ELF) calculations indicated that the difference in hysteresis stems from the adjustment of electronic localization by the atomic coordination environment, where the substitution of In atoms at Ge sites, in contrast to Co sites, results in weaker Co–Ge bonds. On this basis, the influence of regulated hysteresis on the barocaloric effect (BCE) is experimentally studied in detail. We find that the barocaloric entropy change (ΔSP) of 20.6 J · kg−1 · K−1 for MnCo (Ge0.98In0.02) is slightly smaller than that of 25.1 J · kg−1 · K−1 for Mn(Co0.98In0.02)Ge at 1 kbar, but it results in a more desirable reversible isothermal entropy change (∆Srev) of 15.9 J · kg−1 · K−1. This value is ∼1.7 times larger than that of Mn(Co0.98In0.02)Ge (9.2 J · kg−1 · K−1) because of the advantages of narrower hysteresis, thus making it more promising for solid-state refrigeration. Our findings provide a new approach for tailoring the functional properties of novel caloric materials from electronic properties at the atomic scale, particularly for metal alloys.
Materials and methods
DFT and ELF calculations
Our density functional theory (DFT) calculations were performed via the Vienna ab initio simulation package with the all-electron projector augmented wave method19. The spin-polarized generalized gradient approximation (GGA) exchange‒correlation functional developed by Perdew and Wang (PW91)20 was used for these calculations. To examine the hysteresis behavior, orthorhombic (denoted as orth) TiNiSi-type and hexagonal (denoted as hex) Ni2In-type structures are considered. The corresponding relationships between their axes and volumes are aorth = chex, borth = ahex, corth = (surd 3)ahex, and Vorth = 2Vhex10. To simulate the In-doping effect, a 2 × 3 × 2 supercell including 48 f.u. was constructed for MnCo(Ge0.98In0.02) and Mn(Co0.98In0.02)Ge. The valence states 3d64s1 for Mn, 3d84s1 for Co, 4s24p2 for Ge, and 5s25p1 for In were used with an energy cutoff of 500 eV for the plane wave basis set. Brillouin zone sampling is performed via a 3 × 3 × 2 k-point grid for the total energy and electron localization function (ELF) calculations. The electronic density of states (DOS) was calculated via Gaussian smearing with a broadening energy of 0.02 eV and 5000 grid points on which the DOS was evaluated. The underlying dynamic process for the phase transformation from orth toward hex structures was explored via the modified climbing image nudged elastic band (CI-NEB) method21,22. Convergence criteria used for the electronic self-consistent relaxation and the ionic relaxation were set to 10−6 eV and 0.01 eV/Å for energy and force, respectively.
Sample preparation
Polycrystalline alloys with nominal compositions of MnCo(Ge1−xInx) and Mn(Co1−xInx)Ge (x = 0.02) were prepared by arc melting under an Ar atmosphere with appropriate amounts of high-purity (99.9%) raw materials 3–4 times. To ensure their homogeneity, the as-cast ingots were sealed in quartz tubes filled with Ar, annealed at 875 °C for 6 days, and then quenched in liquid nitrogen.
NPD measurements
The NPD measurements were performed on the “time-of-flight” general-purpose powder diffractometer of the China Spallation Neutron Source (CSNS). This diffractometer has three detector banks: a backscatter detector group (bank1) centered at 150° diffraction, a middle angle detector group (bank2) centered at 90° diffraction, and a small angle detector group (bank3) centered at 30° diffraction, covering a wide d-spacing of 0.05 Å < d < 50.48 Å. The wavelength band of the neutrons used for our measurement was in the range of 0.05–4.298 Å. The occupation information of each atom in the samples was refined by the General Structure Analysis System suite of programs according to the Rietveld method.
Magnetic and barocaloric measurements
Temperature-dependent magnetization (M–T) curves at 0.01T were measured with a superconducting quantum interference device magnetometer. All the calorimetry measurements were performed at a temperature ramping rate of 1 K/min on a commercial high-pressure differential scanning calorimeter (DSC). This device allows isotropic compression from high-purity N2 (99.999%), with a pressure range of 0–1 kbar. The specific heat capacity (Cp) at atmospheric pressure was also measured with this calorimeter.
The entropy (S–T curves) at different pressures can be calculated via the following equation23,24:
where (frac{{rm{dQ}}left({rm{T}},{rm{P}}right)}{{rm{dt}}}) and (frac{{rm{dT}}}{{rm{dt}}}) are the heat flow and temperature sweep rates, respectively. Entropy is calculated via the measured heat flow after the baseline is subtracted, and Cp(T, P) is approximated as Cp(T) at ambient pressure (see Supplementary Materials S4 for details). The barocaloric entropy change (ΔSP) and adiabatic temperature change (ΔTP) can be derived from the following equations: ΔSP(T, P1→P2) = S(T, P2) − S(T, P1), ΔTP(S, P1→P2) = T(S, P2) − T(S, P1)24. The reversible entropy change (ΔSrev) is calculated as the overlap of ΔSP under pressurization and depressurization, whereas the reversible adiabatic temperature change (ΔTrev) can be similarly obtained according to refs. 25,26.
Results and discussion
Theoretical calculations of the phase transition and magnetism
To investigate the correlation between the atomic occupation and hysteresis, the kinetic process of magnetostructural phase transitions of compounds, where In replaces Co [Mn(Co0.98In0.02)Ge] and Ge [MnCo(Ge0.98In0.02)], was studied via ab initio calculations with the modified CI-NEB method21,22. During the phase transition, the orth TiNiSi- and hex Ni2In-type structures were considered simultaneously, and the 3D structures are shown in Fig. 1a, b. The projected atomic arrangements along the b and a crystal directions for both phases are depicted in Fig. 1c–f, where notable local distortion of neighboring atoms is attributed to the presence of larger In atoms. Specifically, in the orth phase of MnCo(Ge0.98In0.02), a slight positional shift between the Co atoms occurs near the In atom (see the comparison of the dashed ellipse I with Iʹ in Fig. 1c). In contrast, in the orthorhombic phase of Mn(Co0.98In0.02)Ge, more displacement between Ge atoms is observed (see the comparison of II with IIʹ in Fig. 1d). This difference suggests that the local lattice distortion in Mn(Co0.98In0.02)Ge is more pronounced than that in MnCo (Ge0.98In0.02), possibly because Ge has a smaller atomic radius than Co does (rGe ≈ 122 pm, rCo ≈ 125 pm) and a bigger atomic mismatch with neighboring In atoms (rIn ≈ 167 pm). Similar phenomena are observed in the hex phases of MnCo(Ge0.98In0.02) (Fig. 1e) and Mn(Co0.98In0.02)Ge (Fig. 1f), with atomic shifts occurring at counterpart positions III (III′), IV (IV′), V (V′), and VI (VI′). Clearly, the magnitude of the atomic shift in hex MnCo(Ge0.98In0.02) is also less than that in hex Mn(Co0.98In0.02)Ge.

Atomic configurations for orthorhombic TiNiSi- and hexagonal Ni2In-type structures in (a) MnCo(Ge0.98In0.02) and (b) Mn(Co0.98In0.02)Ge. The blue, yellow, pink, and purple balls denote Mn, Co, Ge, and In atoms, respectively. c and (e) Orthorhombic TiNiSi- and hexagonal Ni2In-type structures, respectively, for MnCo(Ge0.98In0.02), and (d) and (f) show corresponding structures for Mn(Co0.98In0.02)Ge. Note that the dashed ellipses denote the distortions induced by In atoms in their coordination environments.
Based on the modified CI-NEB method21,22,27, the changes in total energy and magnetic moment were calculated along the pathways. Figure 2a, b show the structural evolution process from the orth to hex structure, including an intermediate state for MnCo(Ge0.98In0.02) and Mn(Co0.98In0.02)Ge, respectively. Figure 2c shows the change in the calculated total energy of MnCo(Ge0.98In0.02) and Mn(Co0.98In0.02)Ge per formula (f.u.) during the martensitic transformation, where the lattice parameters were fixed and the atomic geometry fully relaxed at each step. For MnCoGe-based alloys, a small external energy scale can control the structural transition10. For the MnCo(Ge0.98In0.02) and Mn(Co0.98In0.02)Ge compounds, the free energy of the orth phase starts to increase as the chemical bonds twist and break because of lattice deformation during the phase transition and then decreases with the formation of the hex phase. For Mn(Co0.98In0.02)Ge with In atoms occupying Co sites, the transition from the orth to hex phase growth has a kinetic energy barrier of ~0.104 eV/f.u. for, whereas for MnCo(Ge0.98In0.02), with In atoms occupying the nonmagnetic Ge sites, the energy barrier decreases to ~0.090 eV/f.u. reflecting a ratio of ~13.5%. The reduction in this energy barrier means that the energy required to promote the phase transition is reduced, which implies that the hysteresis of MnCo(Ge0.98In0.02) will be narrower; that is, the replacement of Co and Ge sites by the same amount of ∼2% In atoms in MnCoGe leads to a difference in the hysteresis. Moreover, the orth structure is conducive to magnetic order with a larger magnetic moment than the hex structure is (Fig. 2d). Furthermore, in the orth and hex structures, the magnetic moment of MnCo(Ge0.98In0.02) with In atoms occupying nonmagnetic Ge sites is larger than that of Mn(Co0.98In0.02)Ge with In atoms occupying the magnetic Co sites (Fig. 2d), which is consistent with the experimentally measured moments of the orth structure (Fig. S1, Table 1). This consistency demonstrates the rationality of our calculations.
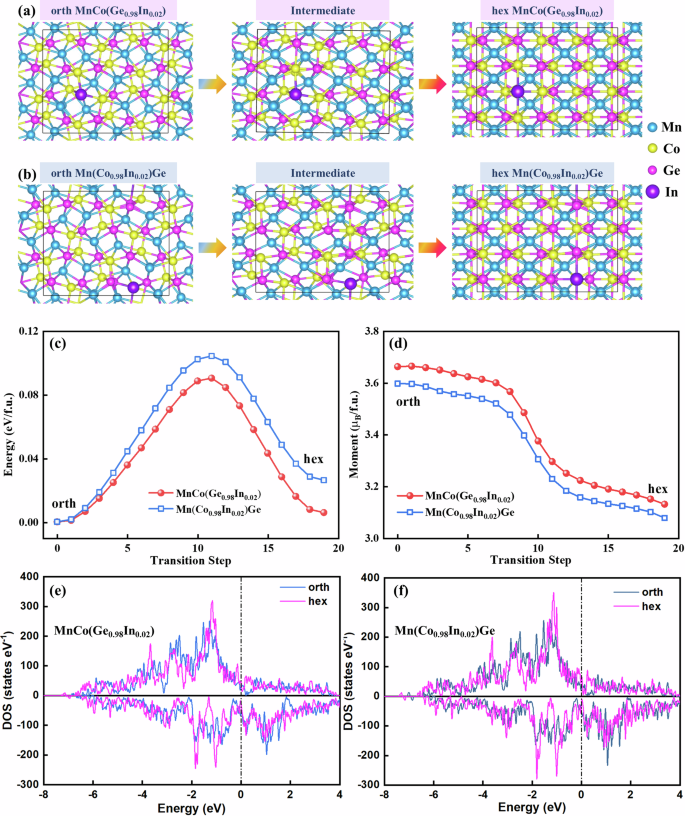
Side view of the atomic configurations for (a) MnCo(Ge0.98In0.02) and (b) Mn(Co0.98In0.02)Ge; the intermediate structures correspond to transition step 10 in (c, d). The blue, yellow, pink, and purple balls denote Mn, Co, Ge, and In atoms, respectively. c Relative total energy and (d) magnetic moment during the TiNiSi-to-Ni2In-type structural transition according to DFT calculations. DOS curves of (e) MnCo(Ge0.98In0.02) and (f) Mn(Co0.98In0.02)Ge for orthorhombic and hexagonal phases.
To gain a clear understanding of the relationship between magnetism and structure in MnCo(Ge0.98In0.02) and Mn(Co0.98In0.02)Ge, the density of state (DOS) curves for the orth and hex structures of these two samples were calculated and are compared in Fig. 2e, f and Table 1. Notably, for MnCo(Ge0.98In0.02) and Mn(Co0.98In0.02)Ge, the DOS curves of the majority and minority spin channels for the orth structure exhibit marked asymmetry relative to those of the hex structure. This behavior results in a larger magnetic moment in the low-temperature orth phase. We subsequently calculate the DOS curves for each element and extract the corresponding average atomic magnetic moments (Table S1). The magnetic moment of the Mn atoms decreases by 0.38 μB during structural evolution for MnCo(Ge0.98In0.02) and Mn(Co0.98In0.02)Ge. As the crystal structure changes from orth to hex, the shortened Mn‒Mn distance induces broadening of the 3d electron band, which results in a weakened magnetic moment of the Mn atoms, suggesting a strong correlation between the magnetic and structural behaviors in Mn‒Co‒Ge‒In10.
Notably, for the orth phase, the DOS curves of the majority spin channel are generally similar for MnCo(Ge0.98In0.02) and Mn(Co0.98In0.02)Ge, whereas the minority spin channel of Mn(Co0.98In0.02)Ge clearly shifts to the left near the Fermi level compared with that of MnCo(Ge0.98In0.02) (Figs. 2e, f, S3c). For the hex phase, the majority and minority spin channels of Mn(Co0.98In0.02)Ge both shift to low energy compared with those of MnCo(Ge0.98In0.02) (Figs. 2e, f, S3d), implying a more localized electron distribution for the orth and hex phases in Mn(Co0.98In0.02)Ge, which is usually indicative of stronger chemical bonding.
Experimental verification of the reduced hysteresis combined with NPD
To verify the above theoretical behavior, we experimentally synthesized relative samples with the same stoichiometric composition as those used in our ab initio calculations. Samples with nominal compositions of MnCo(Ge1−xInx) and Mn(Co1−xInx)Ge (x = 0.02) were then subjected to NPD to determine the exact atomic occupations. Figure 3 shows the NPD patterns measured at room temperature. Then, atomic occupancy information was obtained through Rietveld refinement (see Table 2). Notably, a considerable difference in the coherent scattering lengths exists among Mn (−3.75 fm), Co (2.49 fm), Ge (8.19 fm), and In (4.07 fm), which allows for distinguishing these sites by NPD28. During refinement, we attempted to add In atoms to the Mn, Co, or Ge sites. For MnCo(Ge1−xInx), the occupancies of Ge and In atoms were calculated to be 97.6(8)% and 2.4(8)%, respectively, which is consistent with the nominal 2% substitution of In atoms at the Ge site in MnCo (Ge0.98In0.02). Similarly, for the sample with the nominal composition Mn(Co0.98In0.02)Ge, the results revealed that the contents of Co and In were 97(1)% and 3(1), respectively, which is also roughly consistent with the replacement at Co sites by nominal ∼2% In atoms (see Supplementary Information S7).
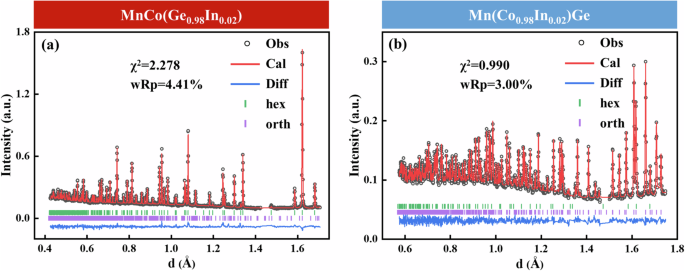
The observed (black circles) and calculated (red lines) NPD patterns collected at room temperature and their differences (blue lines), hexagonal phase peak positions (green bars), and orthorhombic phase peak positions (purple bars) for (a) MnCo(Ge0.98In0.02) and (b) Mn(Co0.98In0.02)Ge.
The temperature-dependent magnetization (M–T curves) of MnCo(Ge0.98In0.02) and Mn(Co0.98In0.02)Ge were subsequently measured under a low magnetic field of 0.01 T, as shown in Fig. 4a. The sudden change in magnetization upon heating and cooling can be attributed to the MST between the ferromagnetic orth and paramagnetic hex phases. According to the derivative of magnetization (dM/dT) shown in Fig. S2, the forward and reverse martensitic transition temperatures (Tt) were 282.6 and 286.7 K, respectively, for MnCo(Ge0.98In0.02), with In atoms occupying Ge sites, accompanied by a hysteresis of ~4.1 K (Fig. S2a). For Mn(Co0.98In0.02)Ge with In atoms occupying Co sites, the Tt upon heating and cooling was 334.8 and 314.8 K, respectively, resulting in a hysteresis of 20.0 K (Fig. S2b), which is ~4.9 times wider than that of MnCo(Ge0.98In0.02). Additionally, the heat flow curves of MnCo(Ge0.98In0.02) and Mn(Co0.98In0.02)Ge were measured under atmospheric pressure (Fig. 4b). Accordingly, the Tt values of MnCo(Ge0.98In0.02) during heating and cooling were 274.8 and 267.7 K, respectively, with a hysteresis of 7.1 K. The Tt values of Mn(Co0.98In0.02)Ge were 329.2 and 309.6 K during heating and cooling, respectively, and the hysteresis was 19.6 K. Notably, the hysteresis value of MnCo(Ge0.98In0.02) with In atoms occupying Ge sites was 12.5 K less than that of Mn(Co0.98In0.02)Ge with In atoms occupying Co sites, which is consistent with the magnetic measurements. All these results verified the aforementioned theoretical calculations, wherein the hysteresis of MnCo(Ge0.98In0.02) is narrower than that of Mn(Co0.98In0.02)Ge.
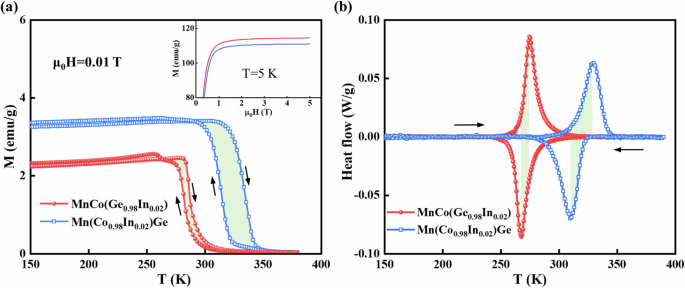
a Temperature dependence of the magnetization under 0.01 T for the MnCo(Ge0.98In0.02) and Mn(Co0.98In0.02)Ge alloys. The inset shows the M‒H curves at 5 K for the two samples, and the complete M‒H curves are given in Fig. S1. b Heat flow curves after the baseline subtraction at atmospheric pressure measured at a temperature rate of 1 K/min. The arrows indicate the heating and cooling processes, and the shaded parts represent hysteresis.
Electron local function (ELF) explaining the origin of hysteresis
To gain insight into the underlying mechanism of hysteresis for In doping at different sites (i.e., Ge and Co) in MnCoGe, we also calculated the ELF based on the hex structure for MnCo(Ge0.98In0.02) and Mn(Co0.98In0.02)Ge, as illustrated in Fig. 5. This calculation allows us to evaluate the changes in the type and strength of chemical bonds. Figure 5a, b show the ELF results in a 3D view, and specifically, Fig. 5c, d show the ELF results of the (010) planes of the hexagonal structures of MnCo(Ge0.98In0.02) and Mn(Co0.98In0.02)Ge, respectively. These results reveal that the electrons in MnCoGe-based alloys are predominantly located around Ge atoms, especially between the nearest-neighbor Co and Ge in the [110] direction. Notably, the maximum ELF value exceeds 0.5, reaching ~0.55. In general, when the ELF value is less than 0.5, a metallic bond exists between atoms, whereas an ELF value larger than 0.5 indicates a covalent bond29. Thus, it can be inferred that the weak covalent bond between Co and Ge acts as a skeleton to support the stability of the hex phase. Additionally, the electron pairing resulting from covalent bonding leads to relatively low moments of magnetic Co atoms, which is consistent with our calculations (Table S1). Furthermore, the ELF curves between the nearest-neighbor Co-Ge were extracted from Fig. 5c, d to quantify the influence of the lattice position of In atoms on the local electronic environment, as illustrated in Fig. 5e and Fig. 5f. Along the [110] crystallographic direction, the maximum ELF value between the nearest-neighbor Co-Ge atoms in Mn(Co0.98In0.02)Ge increases by ~1.82% compared with that in MnCo(Ge0.98In0.02) (0.55–0.56, Fig. 5e). This comparison suggests that the electron distribution between Co and Ge atoms in Mn(Co0.98In0.02)Ge is more localized, which is consistent with the left shift of the DOS curves near the Fermi level in Fig. S3d. Similarly, along the [001] direction, the maximum ELF values between the nearest Co-Ge atoms are 0.51 and 0.46 for Mn(Co0.98In0.02)Ge and MnCo(Ge0.98In0.02), respectively, the former being larger than the latter by ~10.87% (Fig. 5f). Moreover, the Co–Ge bonds become metallic in MnCo(Ge0.98In0.02) but are weakly covalent in Mn(Co0.98In0.02)Ge. These results suggest that incorporating In atoms at Co sites stiffens Co–Ge bonds, resulting in stronger covalent bonding between Co and Ge atoms. Consequently, more energy is required to fracture and form chemical bonds during martensitic phase transformation, which becomes the source of a larger energy barrier and wider hysteresis of the phase transition in Mn(Co0.98In0.02)Ge. In contrast, the incorporation of In atoms at Ge sites weakens the corresponding chemical bonds, favoring a low energy barrier and narrow hysteresis in MnCo(Ge0.98In0.02).
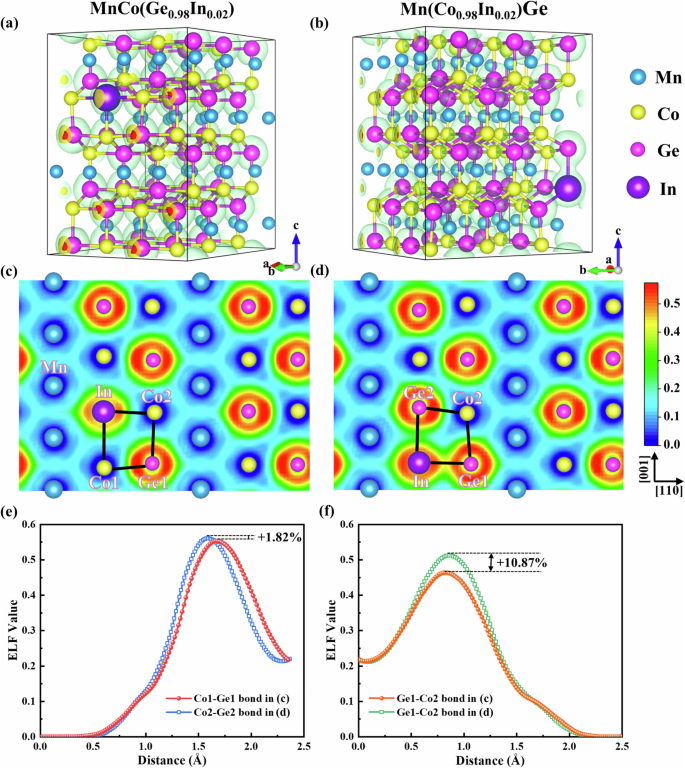
ELF contour map with the 3D display for (a) MnCo(Ge0.98In0.02) and (b) Mn(Co0.98In0.02)Ge in the hexagonal structure. Corresponding 2D display along the (010) direction for (c) MnCo(Ge0.98In0.02) and (d) Mn(Co0.98In0.02)Ge. e Line profile of the ELF value between the nearest-neighbor Co1–Ge1 bond in (c) for MnCo(Ge0.98In0.02) and Co2–Ge2 bonds in (d) for Mn(Co0.98In0.02)Ge along the [110] crystallographic direction. f Line profile of the ELF value between the nearest-neighbor Ge1–Co2 bond in (c) for MnCo(Ge0.98In0.02) and the Ge1–Co2 bond in (d) for Mn(Co0.98In0.02)Ge along the [001] crystallographic direction.
Measurements of the barocaloric effect
Hydrostatic pressure is an effective method for inducing caloric effects in brittle magnetocaloric materials because the application of hydrostatic pressure to any material changes the lattice order, producing a thermal response30. Here, moderate hydrostatic pressure was applied to the Mn–Co–Ge–In alloys to drive the ferromagnetic orth to paramagnetic hex phase transition and produce the BCE (Fig. 6). Figure 6a, e show the measured heat flow curves after baseline subtraction under various hydrostatic pressures for MnCo(Ge0.98In0.02) and Mn(Co0.98In0.02)Ge, respectively. As depicted in these figures, the heating and cooling curves present two distinct peaks attributed to the forward and reverse martensitic transitions, respectively. As the hydrostatic pressure increases, the 2 phase transition peaks shift to lower temperatures, and the pressure tends to stabilize the hex phase, which has a relatively small volume. Based on the dependence of the phase transition temperature on pressure during heating (Th) and cooling (Tc), a linear fitting relationship between the phase transition temperature and pressure (dT/dP) can be established, as shown in the insets of Fig. 6a, e. The dT/dP values during heating and cooling are −9.5 and −8.0 K/kbar for MnCo(Ge0.98In0.02) and −12.8 and −10.8 K/kbar for Mn(Co0.98In0.02)Ge, respectively. This comparison suggests that Mn(Co0.98In0.02)Ge is more pressure-sensitive. According to the heat flow curves, the entropy as a function of temperature without and with a specific heat capacity was calculated, as shown in Fig. 6b, f, and their insets. The entropy change (ΔStr) during the temperature-driven phase transition upon heating or cooling has a similar large magnitude for MnCo(Ge0.98In0.02) and Mn(Co0.98In0.02)Ge, namely, ~39 and ~42 J · kg−1 · K−1, respectively.
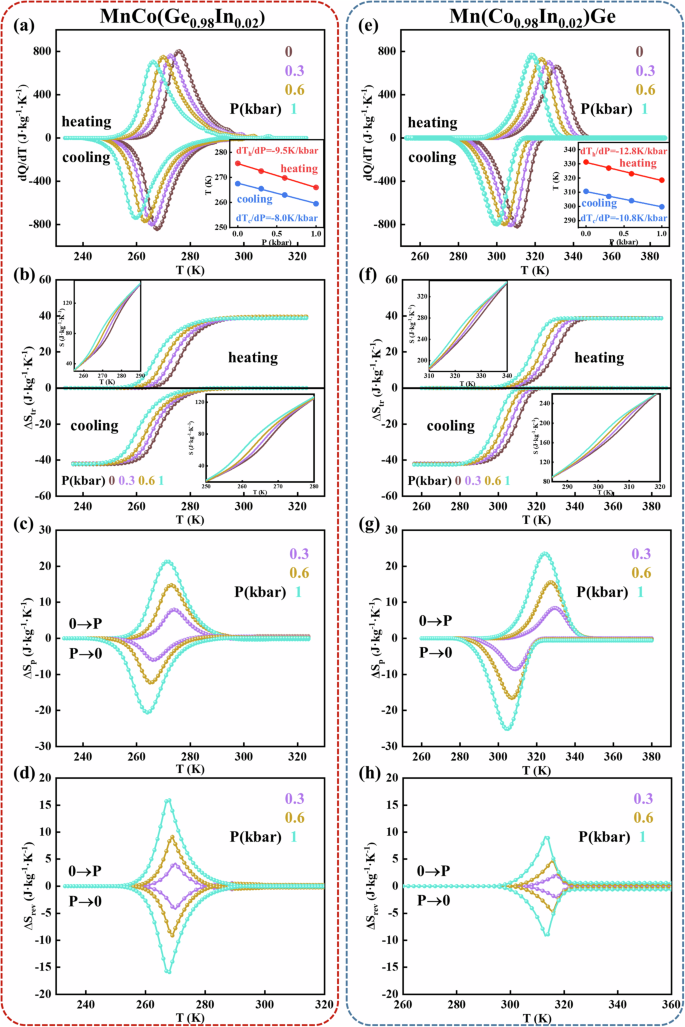
For MnCo(Ge0.98In0.02) (left panels) and Mn(Co0.98In0.02)Ge (right panels): a, e Heat flow recorded during cooling and heating after baseline subtraction under selected pressures. Insets show the relationship between the transition temperature and pressure during heating (red symbols) and cooling (blue symbols). b, f Entropy‒temperature (S‒T) curves without considering the specific heat. The insets show the S‒T curves, including the specific heat. c, g Barocaloric entropy change ΔSP vs. temperature. d, h Reversible isothermal entropy change ΔSrev vs. temperature.
Moreover, the barocaloric entropy change (ΔSP, Fig. 6c, g) can be accessed from the equations ΔSP(T, P1 → P2) = S(T, P2) − S (T, P1). For the compression and decompression processes, the atmospheric pressure acts as the initial and final pressures. It is seen that the |ΔSP| values during the heating and cooling processes at 1 kbar are 21.3 and 20.6 J · kg−1 · K−1, respectively, for MnCo(Ge0.98In0.02) and 23.5 and 25.1 J · kg−1 · K−1, respectively, for Mn(Co0.98In0.02)Ge. In the heating and cooling processes, the |ΔSP| of MnCo(Ge0.98In0.02) is slightly lower than that of Mn(Co0.98In0.02)Ge, which can be attributed to the larger dT/dP of Mn(Co0.98In0.02)Ge (as illustrated in the insets of Fig. 6a, e).
Because refrigeration equipment operates in cycles, the caloric effect must be driven reversibly during the application and removal of the external field25,26,30. Thus, the reversible isothermal entropy change (∆Srev) and reversible adiabatic temperature change (∆Trev) are crucial parameters for evaluating the actual refrigeration capacity of materials. The value of ∆Srev can be determined by assessing the overlap of ∆SP during compression and decompression25,26, and the results are given in Fig. 6d, h. At 1 kbar, the obtained ∆Srev values of MnCo(Ge0.98In0.02) and Mn(Co0.98In0.02)Ge are 15.9 and 9.2 J · kg−1 · K−1, respectively. Notably, despite having a small ∆SP, MnCo(Ge0.98In0.02) has a remarkably high ∆Srev, which is ~1.7 times greater than that of Mn(Co0.98In0.02)Ge (see Table 3).
In addition, the relative cooling power (RCP)8 is another parameter commonly used to evaluate refrigeration performance, particularly for a device31, and the reversible relative cooling power (RCPrev) characterizes the suitability of caloric materials for application in refrigeration equipment. It is calculated via the equation RCP = |∆S|max × δTFWHM, where δTFWHM is the full width at half maximum of the entropy change. The RCP values of MnCo(Ge0.98In0.02) and Mn(Co0.98In0.02)Ge at 1 kbar are 274 and 424 J · kg−1, respectively; however, the corresponding RCPrev values are 142 and 71 J · kg−1, respectively. The RCPrev of MnCo(Ge0.98In0.02) accounts for ~52% of the RCP, which is much greater than the corresponding value for Mn(Co0.98In0.02)Ge (~17%). The above differences are obtained because the hysteresis of MnCo(Ge0.98In0.02) is considerably smaller than that of Mn(Co0.98In0.02)Ge, which results in the highly reversible component of the materials and greatly enhances their performance in practical applications.
Moreover, the BCE performance at higher pressures was further evaluated (Fig. 7). Owing to the limitations of our device, the BCE behavior at pressures exceeding 1 kbar could not be measured. Fortunately, the transition temperatures (Tt) of MnCo(Ge0.98In0.02) and Mn(Co0.98In0.02)Ge exhibited a linear relationship with pressure in the range of P ≤ 1 kbar (Fig. 6a, e and insets). Assuming that dTt/dP remains constant at higher pressures (P ≤ 5 kbar), the S curve can be linearly extrapolated to a higher hydrostatic pressure, and ΔSP and ΔTP at 5 kbar can be determined, as shown in Fig. 7a, e and 7b, f. The height and width of the ΔSP and ΔTP developed simultaneously with increasing hydrostatic pressure. A plateau of ΔSP for MnCo(Ge0.98In0.02) and Mn(Co0.98In0.02)Ge appears when the pressure increases to 5 kbar, implying that ΔSP reaches its saturation value. Owing to the advantages of its narrower hysteresis, MnCo(Ge0.98In0.02) always has a larger ∆TP/ΔTrev than does Mn(Co0.98In0.02)Ge over the entire pressure range of P ≤ 5 kbar. Thus, the reversible ΔTrev may be expected to reach ~17 and ~11 K for MnCo(Ge0.98In0.02) and Mn(Co0.98In0.02)Ge, respectively, at P = 5 kbar (Fig. 7d, h). That is, the ΔTrev of the former is 1.5 times larger than that of the latter.
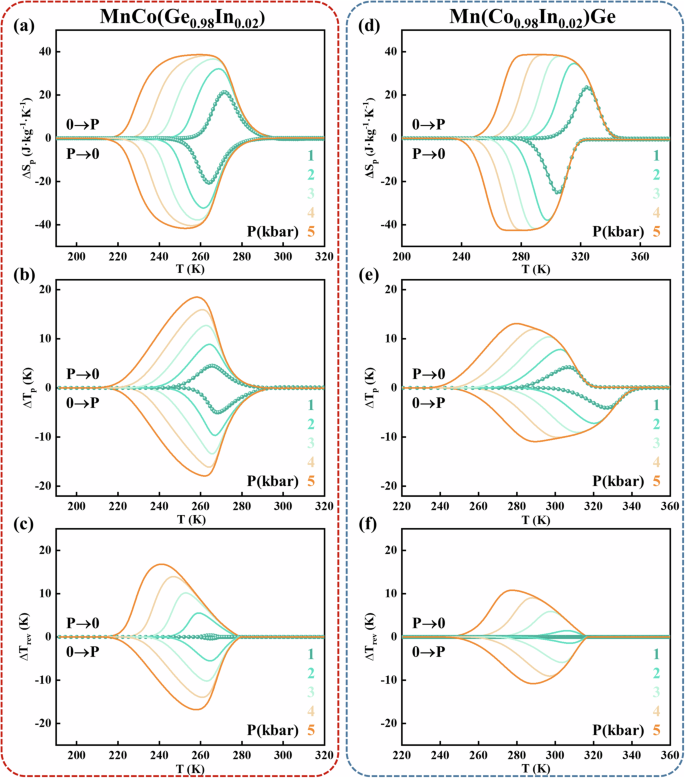
For MnCo(Ge0.98In0.02) (left panels) and Mn(Co0.98In0.02)Ge (right panels): a, d Barocaloric entropy change (∆SP) as a function of temperature for pressurization and depressurization under various hydrostatic pressures. b, e Adiabatic temperature change (∆TP) vs. temperature. c, f Reversible adiabatic temperature change (∆Trev) vs. temperature. ∆SP and ∆TP are obtained by linearly extrapolating the S curves to P = 5 kbar, and the reversible ΔSrev and ΔTrev values are accordingly obtained.
Conclusions
In summary, we have used ab initio calculations and NPD with magnetic and calorimetric measurements to investigate the kinetic origin of hysteresis and the barocaloric effect in MnCoGe-based alloys by regulating the atomic coordination environment. The same amount (2%) of nonmagnetic In atoms with a larger atomic radius and lower electron number were introduced to partially replace the magnetic sites (Co) or nonmagnetic sites (Ge) under the condition that the content of Mn atoms providing the main magnetic moment remained unchanged. Our ab initio calculations of the total energy and magnetic moment results show that substituting Ge sites with In atoms results in a lower energy barrier for the martensitic transition than the replacement of Co sites does, indicating a narrower hysteresis. The more localized electron distribution in the DOS curves of Mn(Co0.98In0.02)Ge than in the DOS curves of MnCo(Ge0.98In0.02) suggests stronger chemical bonding.
This theoretical result is verified by our experimental observations. We synthesized MnCo(Ge1−xInx) and Mn(Co1−xInx)Ge (x = 0.02), and NPD measurements confirmed the atomic occupancies of each sample. The marked reduction in the hysteresis measured in MnCo(Ge0.98In0.02) compared with that in Mn(Co0.98In0.02)Ge agrees well with the theoretical results. ELF calculations further reveal the origin of the different hysteresis. These results indicate that electrons are predominantly located around Ge atoms, particularly between the nearest-neighbor Co and Ge. Mn(Co0.98In0.02)Ge shows weakly covalent-type Co–Ge bonds, which become metallic-type in MnCo(Ge0.98In0.02), suggesting that the incorporation of In atoms at nonmagnetic Ge sites weakens Co–Ge bonds. Consequently, less energy is required to fracture and form chemical bonds during martensitic transformation, resulting in a narrower hysteresis for MnCo(Ge0.98In0.02). On this basis, the influence of regulated hysteresis on the barocaloric effect is experimentally studied in detail. Although MnCo(Ge0.98In0.02) has a slightly lower ΔSP than Mn(Co0.98In0.02)Ge does, the reversible ΔSrev has the advantages of a smaller hysteresis. The maximum ΔSrev of MnCo(Ge0.98In0.02) becomes 1.7 times larger than that of Mn(Co0.98In0.02)Ge at 1 kbar, whereas the ΔTrev of the former is 1.5 times larger than that of the latter at 5 kbar. For caloric materials with a first-order transition, in order to minimize hysteresis, substituent elements should be selected without changing the crystal and magnetic structure of the original material as far as possible. Based on calculations of phase transition energy barriers, elemental screening can become more direct and effective. Our findings provide a new approach for tailoring the functional properties of caloric materials from electronic properties at the atomic scale, particularly for metal alloys, laying a solid foundation for exploring novel caloric refrigeration materials.


Responses