Pressure-controlled luminescence in fast-response barium fluoride crystals

Introduction
Ionizing radiation is ubiquitous in many applications. High-energy photons, gamma rays, X-rays, neutrons, and charged particles are being harnessed in many applications, such as nuclear medicine, border security, mineral and oil exploration, and nuclear fusion research. The detection and monitoring of ionizing radiation rely on an intermediary material, called a scintillator, which subsequently emits photons after absorbing the radiation. The scintillator therefore converts the otherwise inaccessible ionizing radiation into light, called luminescence, which can be detected by photodetectors. Luminescence from a scintillator originates from the energy-level transitions of excited electrons1. As such, many scintillators have been developed using crystals and glasses doped with rare-earth activator ions such as cerium2,3,4, praseodymium5,6,7, neodymium8, gadolinium9, and lutetium9. Wide-band-gap fluorides, silicates, orthosilicates, and borates are among the host materials doped with rare-earth ions, depending on the required density and stopping power for the radiation of interest. In these rare-earth-doped scintillators, luminescence originates from electronic transitions between the excited state energy levels and the ground state energy levels that are established by crystal-field splitting within the forbidden gap between the conduction and valence bands of the host material. For trivalent rare-earth ions, radiative decay occurs from the lowest level of their excited 4fn−15d electronic configuration (often referred to as the lowest 5d level for simplicity) to the ground state and some excited levels of the ground 4fn electronic configuration (often referred to as the 4f level for simplicity)9. If the transition is parity-allowed, the resulting luminescence will have a fast decay time that is typically in the nanosecond range, as was observed in the lithium yttrium fluoride (LiYF4) host crystal doped with trivalent cerium, praseodymium, gadolinium, and lutetium9. However, in many applications, a fast picosecond luminescence decay time is desired. Time-of-flight (TOF) detectors, for example, in particle detection, TOF-positron emission tomography (TOF-PET), and nuclear fusion research, rely on the scintillator’s fast decay time to discriminate between different types of radiation that exist simultaneously. High-resolution nuclear imaging cameras and high-rate ultrafast timing devices also require scintillators with picosecond decay times10. Along with a fast decay time, a high light yield is needed for ease of detection of the luminescence signal. However, scintillator materials are limited to one feature or the other because of the trade-off between decay time and light yield. The problem of detecting weak luminescence from a scintillator with low light yield can be solved by using multiple detector arrays11. However, obtaining a fast luminescence decay time poses a more fundamental problem that is more difficult to solve. Several schemes, including luminescence quenching via high doping concentrations12 and energy transfer by co-doping13, have been investigated to achieve fast luminescence decay times via rare-earth-doped materials. However, picosecond decay times are not achievable via these schemes. Additionally, the presence of parity-forbidden transitions in rare-earth-doped materials introduces a very slow luminescence component with decay times on the order of milliseconds to microseconds.
Picosecond decay times can be achieved in materials exhibiting core-to-valence luminescence (CVL) or cross-luminescence (CL), also sometimes referred to as Auger-free luminescence. CL occurs because of the radiative recombination of electrons from the valence band with the holes in the uppermost core band, with the holes being created when the crystal is irradiated with radiation whose energy exceeds the ionization edge of the uppermost core band. In most crystals, the hole created in the uppermost core band decays nonradiatively via Auger decay. In this case, an electron from the valence band recombines with the hole in the core band, and the energy released is transferred non radiatively to another electron in the valence band, which then escapes to the conduction band9. However, Auger decay does not occur in some crystals whose uppermost core band lies at a high energy such that the energy difference between the tops of the valence and uppermost core bands is less than the bandgap energy of the crystal. In this case, radiative recombination of the core hole with the valence electron dominates and results in CVL emission9. Since Auger decay has not occurred, CVL is also called Auger-free luminescence. The term CL reflects the fact that at the CL transition, the electron is transferred from one ion (anion) to another ion (cation) because, in ionic crystals, the valence band is formed from the p-type states of the anion and the uppermost core band is formed from the p-type states of the cation9. CL has been observed in BaF2, LaF3, KMgF3, and BaLiF314,15,16,17. For CL in BaF2, the incident radiation promotes an electron in the filled 5p Ba2+ core band to the empty 6s, 5d Ba2+ conduction band, leaving behind a hole in the core band that then relaxes to the core band edge (see Fig. 1). An electron in the filled 2p F– valence band recombines with this hole in the core band, resulting in the CL emission14,15,17. Afterward, the electron initially promotes the conduction band, and the hole remaining in the valence band after CL recombines via self-trapped exciton (STE) formation. This results in slow STE luminescence emission with a decay time of a few hundred nanoseconds, which deteriorates the picosecond decay time of CL and should therefore be suppressed. Since CL emission arises from band-to-band transitions, the lifetime of the transition is very short, and the luminescence decay times are a few hundred picoseconds (600 ps in BaF2, 270 ps in KMgF3, and 300 ps in BaLiF3)16,18. Recently, observations of shorter CL emission in the range of 100 ps have been reported19,20. The caveat is that the wavelength of picosecond CL emission is in the vacuum ultraviolet (VUV) wavelength region. It is difficult to detect CL emission not only because of its high energy but also because VUV wavelengths are absorbed by oxygen in air. As such, conventional photodetectors cannot be used to detect CL, and measurements need to be performed under vacuum or nitrogen purging unless the CL emission wavelength can be shifted to a longer wavelength. Additionally, the majority of the light output (for example, ~80% of the light output from BaF2) occurs in the slow STE component21. Despite these difficulties, the BaF2 single crystal is still the leading fast-response scintillator on the market because of its picosecond-CL emission. Owing to its practical use as a fast scintillator material, BaF2 is the ideal material for fundamental research on CL, with the aim of shifting fast CL emission to longer wavelengths and suppressing slow STE emission. Shifting the CL of BaF2 to a longer wavelength involves manipulation of its electronic structure to decrease the energy gap between the valence and core bands. Here, we manipulate the band structure of BaF2 through high-pressure application to control the energy gap between the first core band and the valence band, thereby tuning its CL emission wavelength. By compressing the crystal using pressures up to 8.7 GPa, we investigate changes in the BaF2 electronic structure; changes in its conduction, valence, and first core bands; and changes in its bandgap energies.

Schematic diagram of the mechanisms for CL and STE luminescence emission in BaF2.
Results and discussion
The effects of pressure on the electronic structure and bandgap energies correlate with experimentally observed changes in the CL and STE luminescence emissions. At ambient (0 GPa) pressure, BaF2 has a cubic phase with a lattice constant a = 6.2 Å (Fig. 2a). It belongs to the space group Fm-3m (group number 225)21,22,23. Ba2⁺ ions exhibit a bonding arrangement within a body-centered cubic structure, wherein they are surrounded by eight identical F− ions. The distance between the Ba and F ions in these bonds is 2.70 Å. Each F− ion forms bonds with four equivalent Ba2⁺ ions, resulting in the creation of a combination of FBa4 tetrahedra through a combination of corner- and edge-sharing interactions. The atomic coordinates for Ba and F are (0.0, 0.0, 0.0) and (0.25, 0.25, 0.25), respectively. The BaF2 crystal is placed in a sapphire anvil cell and is excited by 20 keV synchrotron radiation X-rays, as shown in the schematic diagram of the experimental setup in Fig. 3. A sapphire anvil cell is used instead of the more durable and commonly used diamond anvil cell because the CL emission from BaF2 at ambient pressure is expected to be ~200 nm. Diamond is opaque, whereas sapphire is transparent down to ~150 nm24,25. The luminescence from BaF2 under pressure is detected via a fiber spectrometer. X-ray diffraction (XRD) measurements were performed simultaneously via 20 keV synchrotron radiation X-rays. Figure 4a shows the XRD patterns of BaF2 at pressures ranging from 0.1 GPa (approximately ambient) to 8.7 GPa. At 0.1 GPa, the peaks can be indexed to the cubic phase of BaF2 with a dominant orientation along the [111] plane. The cubic crystal structure is maintained at a pressure of ~2 GPa (Fig. 4b). Above 4.5 GPa, the XRD peaks can be indexed to the orthorhombic phase of BaF2 (Fig. 4d). The [111] plane is still the dominant orientation in the orthorhombic phase. In the orthorhombic phase, BaF2 belongs to the space group Pnam (group number 62)21,22,23. Ba2⁺ ions are engaged in a 9-coordinate geometry and surrounded by nine F− ions. The Ba–F bond distances are variable, ranging from 2.61 to 3.02 Å. There are two distinct F− sites. In the first site, F− forms bond within a 5-coordinate arrangement to five identical Ba2⁺ ions. Moreover, at the second F− site, F− forms bond with four equivalent Ba2⁺ ions, leading to the formation of a mixture of FBa4 tetrahedra through a combination of edge- and corner-sharing interactions. The atomic coordinates are (0.25, 0.115, 0.25), (0.36, 0.43, 0.25), and (0.028, 0.333, 0.75) for Ba, F1 and F2, respectively. The lattice constants at the onset of the orthorhombic phase are a = 6.63 Å, b = 7.71 Å, and c = 3.92 Å (Fig. 2b). Figure 4c reveals that at 3.7 GPa, a phase change from cubic to orthorhombic is imminent, as the XRD pattern contains peaks that can be indexed to both cubic and orthorhombic phases22,23. For both the cubic and orthorhombic phases, the lattice constants decrease as the BaF2 crystal is compressed by increasing pressure, as shown in Fig. 5. Numerical simulations for pressures up to 14 GPa agree well with the experimental lattice constants, particularly with the decrease in the lattice constants as the pressure increases. The experimental results are limited to pressures less than 8.7 GPa since the sapphire anvil cell was unable to withstand higher pressures.
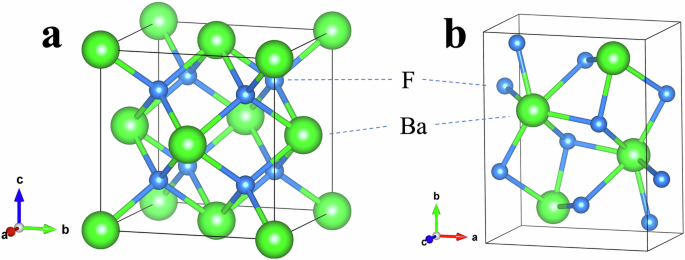
a Cubic phase. b Orthorhombic phase.
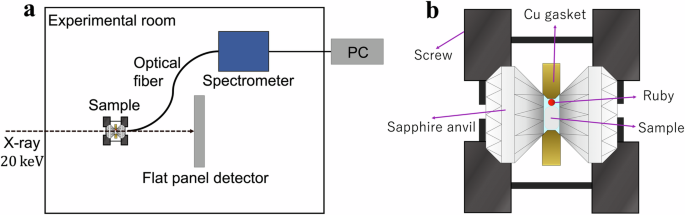
a Schematic diagram of the high-pressure experimental setup. b Details of the sapphire anvil cell used to apply high pressure.
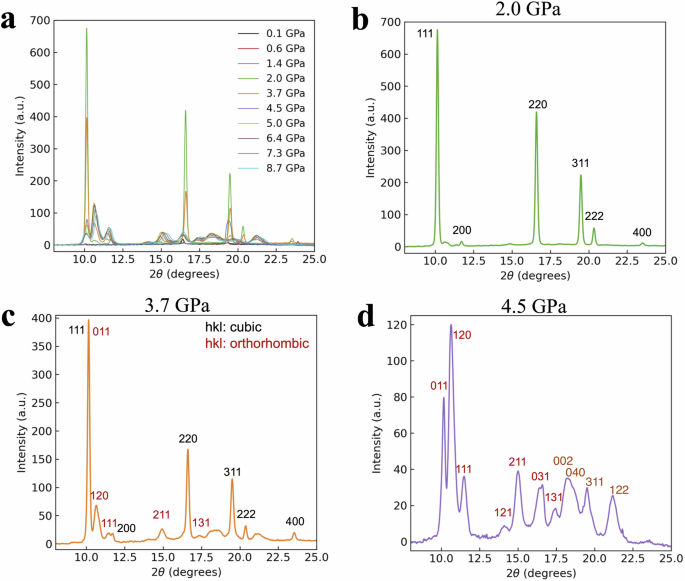
a XRD pattern from 0.1 GPa to 8.7 GPa. b XRD pattern at 2.0 GPa. The peaks are indexed to the cubic phase of BaF2. c The XRD pattern at 3.7 GPa reveals the phase transition from the cubic to orthorhombic phase. d XRD patterns at 4.5 GPa. The peaks are indexed to the orthorhombic phase of BaF2.
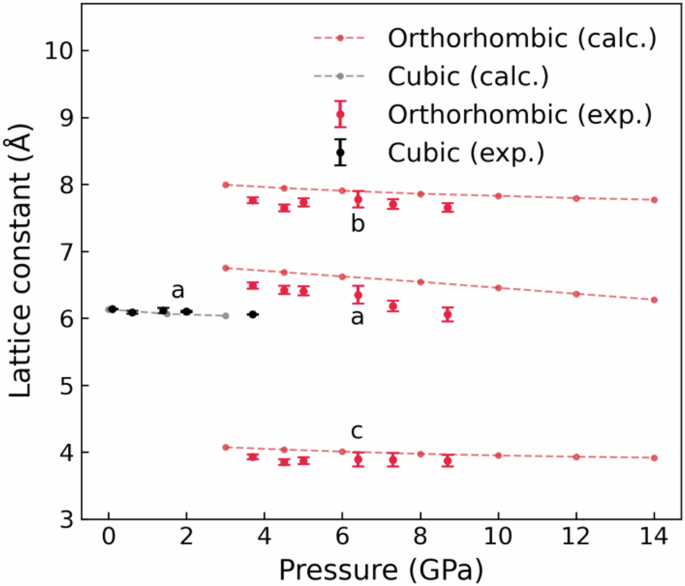
Experimental (plots with error bars) and calculated (plots with dashed lines) lattice constants for the cubic and orthorhombic phases of BaF2 at pressures from 0 GPa to 14 GPa. The error bars indicate standard deviations.
The calculated band structures of BaF2 for the different pressures applied in the experiments are shown in Fig. 6. Table 1 summarizes the energy gaps between the valence and conduction bands (valence‒conduction bandgap), the core‒conduction bandgap, and the core‒valence bandgap. In the cubic phase, when the applied pressure is less than 3.7 GPa, the valence‒conduction bandgap appears to be stable. The valence‒conduction bandgap slightly increases with increasing pressure in the orthorhombic phase. Nevertheless, the conduction and valence bands do not appear to dramatically flatten even as the crystal is compressed. A major requirement for CL is that the valence−conduction bandgap should be greater than the core−valence bandgap so that the CL photons are not reabsorbed by the material. Band gap control and band structure manipulation through uniform and uniaxial pressure application were previously demonstrated in hexagonal lithium calcium aluminum fluoride (LiCaAlF or LiCAF)26 and lithium yttrium fluoride (YLiF4)27 laser materials. Uniform volume compression at increasing pressures up to 50 GPa monotonically increased the valence−conduction bandgap of LiCAF because of the flattening of the conduction band. Luminescence from LiCAF was, however, not observed. The core−conduction bandgap of BaF2 slightly increases as the crystal structure changes from cubic to orthorhombic. In most applications that require a fast-response scintillator, the radiation being measured has enough energy to promote an electron across the 14–15 eV energy gap between the core and conduction bands. Therefore, a slight increase in the core−conduction bandgap will hardly affect the performance of the scintillator. Interestingly, the core−valence bandgap decreases as the pressure increases, as observed in Fig. 6. Increasing the pressure introduces a tensile strain that expands the valence band downward. The decrease in the core−valence bandgap is more obvious in the orthorhombic phase at high pressures, as the downward expansion of the valence band is more pronounced. For all pressures considered, the core−valence bandgap is always less than the valence−conduction bandgap (Table 1). Therefore, self-absorption of CL emission is avoided, even at high pressures. Moreover, the decrease in the core−valence bandgap alludes to the exciting prospect of shifting the CL emission to longer wavelengths.
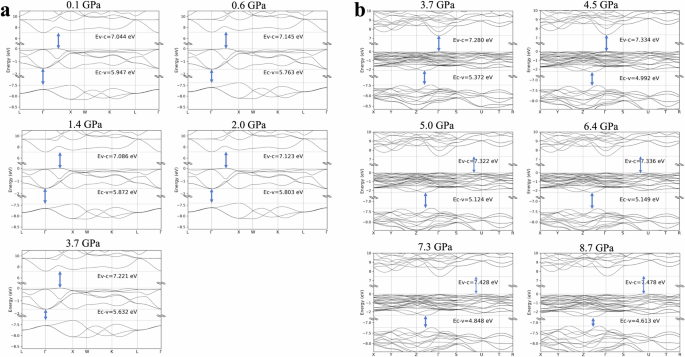
a Cubic phase at pressures from 0.1 GPa to 3.7 GPa. b Orthorhombic phase at pressures ranging from 3.7 GPa to 8.7 GPa.
Figure 7a shows the experimentally obtained luminescence emission spectra of BaF2 under pressures ranging from 0.1 GPa to 8.7 GPa. The resolution of the luminescence spectra is 0.2 nm. The spectra presented were corrected according to the spectral response of the spectrometer. Figure 7e and f shows the decomposition of the luminescence emission spectra into Gaussian components. The peak at ~220 nm arises from CL emission, whereas the peak at ~300 nm comes from STE emission. The energy of the CL and STE emission peaks, determined from the peak energy of the Gaussian components, as the pressure increases are shown in Fig. 7g and summarized in Table 2. The wavelengths and energies of the CL and STE emission peaks, as well as the valence−conduction and core−valence bandgaps, are shown in Fig. 7b. The data points in Fig. 7b, which refer to the experimental data (solid lines), are the same values as those plotted in Fig. 7g. The CL spectra should extend up to 7.1 eV28, but the fiber spectrometer used in the experiment can measure only up to 200 nm. In the cubic phase, the STE luminescence peak appears to be blueshifted as the pressure increases from 0.1 to 3.7 GPa. The shift to shorter wavelengths (open black squares in Fig. 7b) is consistent with the increase in the valence−conduction bandgap (open gray squares in Fig. 7b; Table 1). The STE luminescence intensity initially increases as the pressure increases to 1.4 GPa. As the pressure further increases, the STE luminescence intensity decreases. Figure 7c and d shows the luminescence spectra at 3.7 GPa and 6.4 GPa, respectively. At 3.7 GPa, when BaF2 exists in both the cubic and orthorhombic phases and the phase transition to orthorhombic phases is imminent, both the CL peak at 220 nm and the STE peak at 300 nm are present, but the STE peak is more intense. At 6.4 GPa, when BaF2 exists in the orthorhombic phase, both the CL peak at 220 nm and the STE peak at 300 nm are also present, but the CL peak is more intense. Therefore, the luminescence peak observed at pressures greater than 4.5 GPa in Fig. 7a is due to CL. The total density of states and partial density of states of BaF2 in the cubic and orthorhombic phases and increasing pressures are shown in Fig. 8. In all the cases, the core band is derived predominantly from the 5p orbital of Ba2+, the valence band is derived predominantly from the 2p orbital of F−, and the conduction band is derived from the 5d orbital of Ba2+. These orbital compositions of the core, valence, and conduction bands satisfy the conditions for CL, further confirming that the luminescence peak observed at high pressures (Fig. 7a) is due to CL. When the incident 20 keV X-rays excite the BaF2 crystal, high-energy electrons, and holes are created in the crystal via electrons transitioning from the 5p Ba2+ core band to the 6s, 5d Ba2+ conduction band and subsequently from the 2p F− valence band to the 5p Ba2+ core band. As the holes lose energy through thermalization, the holes become localized in the form of Vk centers (self-trapped holes). The radiative recombination of the conduction band electrons and the self-trapped holes results in STE luminescence emission. The increase in the intensity of STE emission indicates that the radiative decay of the STE (electron‒hole) is enhanced at low pressures. Since the number of STEs formed depends on the quantity of electrons and holes29, it is plausible that low-pressure application up to 1.4 GPa increases the density of electrons and holes as the unit cell volume is reduced following the decrease in the lattice constant. As previously observed in Nd3+:SrWO4 and InNbO4 crystals, a reduction in the unit cell volume increases the effective concentration of ions involved in radiative processes, increasing the efficiency of energy transfer processes30,31. In these works, a reduction in the unit cell volume was achieved by doping. The reduction in the unit cell volume due to dopants is equivalent to an externally applied pressure of 1.14 GPa30, which is similar to the 1.4 GPa maximum applied pressure for which the intensity of the STE emission from BaF2 increased. A further compression of the crystal using pressures greater than 1.4 GPa increased the valence−conduction bandgap. These structural changes perturb the Vk centers. The perturbed Vk centers did not efficiently take part in the radiative STE recombination process, leading to a decrease in the intensity of the STE emission. A similar phenomenon was observed in BaF2 doped with cadmium32,33 and lanthanum34,35 ions, where the self-trapped holes associated with charge-compensating interstitial fluoride ions formed additional Vk-type centers that participated in nonradiative conduction band electron−localized hole recombination, thereby suppressing STE emission. The decrease in the STE intensity of La(1%)-doped BaF2 is ~61% compared with that of undoped BaF2 and ~98% for La(10%)-doped BaF2. At both the 1% and 10% doping concentrations, the intensity of CL emission remains unchanged. A La doping concentration of 20% results in the suppression of the STE but also in a decrease of ~87% in the CL intensity, as estimated from the data presented in reference 33. On the other hand, a decrease in the STE intensity of ~38% was observed at a 2.0 GPa applied pressure compared with the STE intensity at ambient pressure, whereas the intensity of the CL emission remained unchanged. Above 3.7 GPa, the STE intensity is suppressed, but the CL intensity decreases by ~28%. The suppression of STE emission was also reported in BaF2 doped with strontium and magnesium ions36. In this case, the dopant ions act as electron-trapping centers. At the phase transition from cubic to orthorhombic (3.7 GPa), the complete structural change and increase in the valence−conduction bandgap inhibited the recombination of conduction band electrons and self-trapped holes, leading to the suppression of STE emission. In all previous works, STE emission was suppressed via the introduction of a dopant ion. Our results show that STE emissions can also be suppressed by high-pressure applications. In the orthorhombic phase, at pressures greater than 3.7 GPa, the valence‒conduction bandgap further increases monotonically with pressure (see Table 1). The increased valence−conduction bandgap could have continued to inhibit the recombination of conduction band electrons and self-trapped holes, resulting in the continued suppression of STE emission. Further high-pressure experiments at the orthorhombic phase are needed to fully ascertain the origin of the change in the properties of STE luminescence compared with those of the cubic phase.
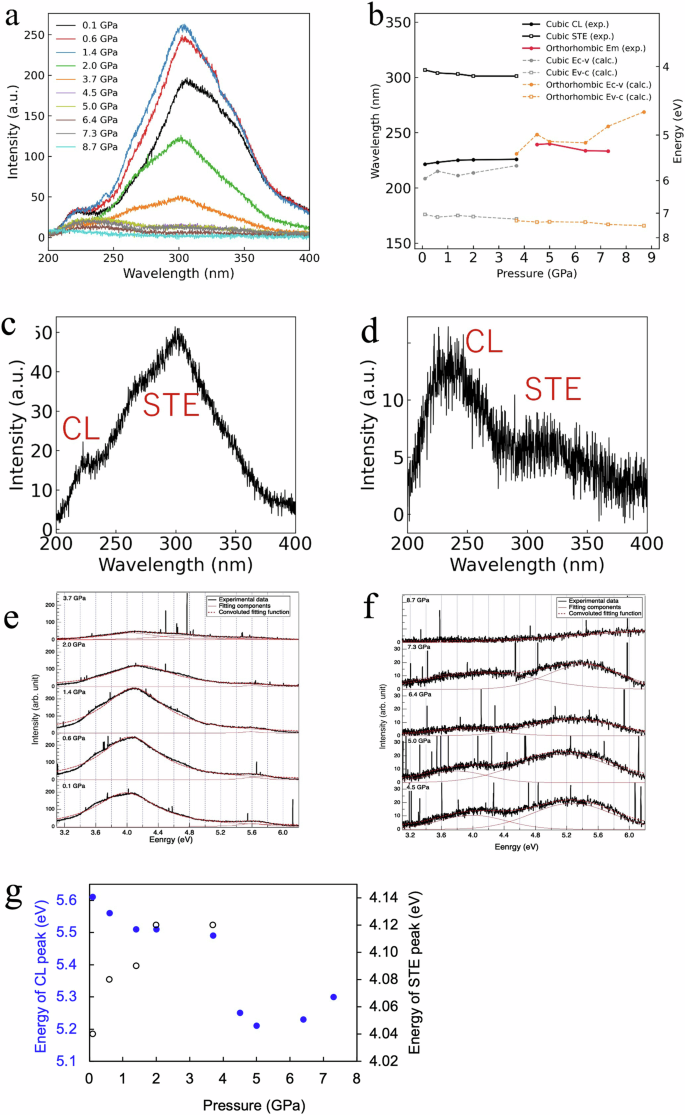
a Luminescence emission spectra of BaF2 under pressures ranging from 0.1 GPa to 8.7 GPa. The peak at ~220 nm arises from CL emission, whereas the peak at ~300 nm comes from STE recombination. b Wavelengths of the CL and STE emission peaks, as well as the valence‒conduction and core‒valence bandgaps of BaF2 under pressures ranging from 0.1 GPa to 8.7 GPa. Luminescence spectra at (c) 3.7 GPa (cubic and orthorhombic phases) showing both CL and STE emission, with the STE emission being more intense, and (d) 6.4 GPa (orthorhombic phase) showing both CL and STE emission, with the CL emission being more intense. The spectra are normalized to the same intensity scale. (e) and (f) Luminescence spectra fit to Gaussian components of the CL and STE peaks at each pressure. g Shift in the CL (solid blue circles) and STE (hollow black circles) peaks as a function of pressure.
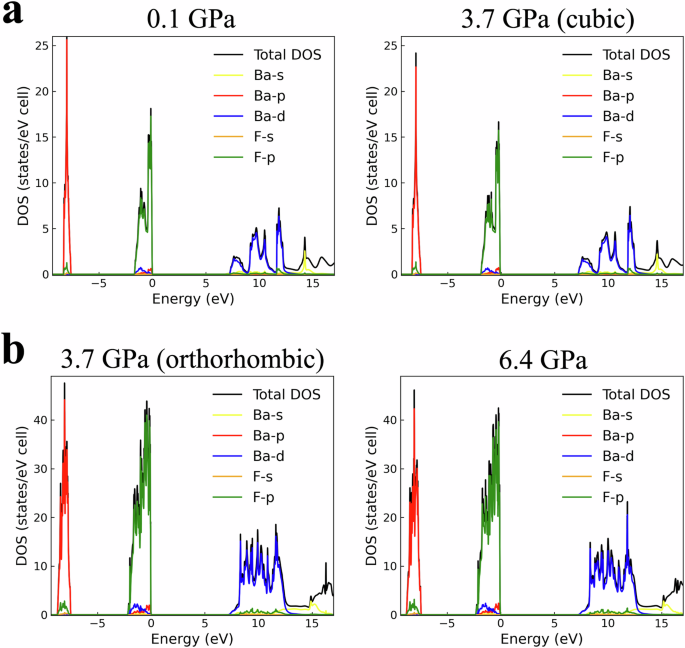
a Cubic phase. b Orthorhombic phase.
In the cubic phase, the CL emission peak at 221 nm slightly redshifts to 226 nm as the pressure increases from 0.1 GPa to 3.7 GPa. The shift to longer wavelengths of the CL peak (solid black circles in Fig. 7b) is consistent with the decrease in the core−valence bandgap (solid gray circles in Fig. 7b; Table 1) for cubic BaF2 under pressure. The intensity of CL emission appears to be constant as the pressure is increased. At 3.7 GPa, where BaF2 exists in both the cubic and orthorhombic phases, the luminescence emission intensity is weakened. In the orthorhombic phase, the luminescence emission intensity appears to be stable, albeit weaker than the intensity in the cubic phase, as the pressure increases. Interestingly, the luminescence peak clearly shifts to a longer wavelength by the phase transition from the cubic phase to the orthorhombic phase (solid circles with solid lines in Fig. 7b, replotted as solid circles in Fig. 7g; Table 2). At an applied pressure of 5.0 GPa, a maximum shift to 238 nm is observed. This shift is consistent with the decrease in the core−valence bandgap in the orthorhombic phase due to the downshift of the valence band (solid orange circles with dashed lines in Fig. 7b; Table 1). The observed broadening of the luminescence emission, especially in the orthorhombic phase, could be attributed to the expansion of the valence bandwidth as the pressure increases. As shown in Table 1, the width of the valence band (ΔEv) increases monotonically as the pressure increases. At high pressure, the strengthened crystal field can induce greater band splitting and enhance electron‒phonon coupling37. Indeed, previous works have reported similar broadening in valence−conduction band photoluminescence emission38,39,40, but this is the first report on broadening of core−valence band luminescence. The experimental and calculation results suggest that high-pressure application modifies the electronic structure of BaF2, alluding to exciting prospects for tunable CL emission. The decrease in the energy gap between the core and valence bands as BaF2 is compressed under high pressure shifts the CL emission peak to longer wavelengths. A phase shift from cubic to orthorhombic is observed at an applied pressure of ~3.7 GPa. In the orthorhombic phase, STE luminescence disappears, and the CL emission peak broadens. Compared with CL, STE luminescence is a slower process. Hence, several schemes have been used to suppress STE luminescence, including doping BaF2 with cadmium and lanthanum ions33. Our results suggest that subjecting the crystal to high pressure could be an alternative solution for suppressing STE luminescence along with increasing the CL wavelength. As mentioned previously, doping with 1% lanthanum led to a 61% decrease in the STE luminescence intensity compared with undoped BaF2. In the case of high-pressure application, the STE luminescence intensity decreased by 38% at an applied pressure of 2.0 GPa compared with that under ambient conditions. High pressure could also potentially be applied to other fast-response scintillators that emit short vacuum ultraviolet wavelengths (VUV, wavelength range from 100 nm to 200 nm) that are difficult to detect. Many VUV-emitting materials, especially compound fluorides doped with trivalent neodymium and erbium ions41,42,43,44,45,46,47, have been investigated and reported as fast-response scintillators with typical decay times of a few nanoseconds because the decay time is directly correlated with the luminescence emission wavelength. This means that the shorter the luminescence wavelength is, the faster the decay time48.
In summary, we numerically and experimentally determined the evolution of the STE and CL emissions observed from BaF2 under pressure. The phase transition from cubic to orthorhombic at ~3.7 GPa results in the suppression of slow STE luminescence emission. At applied pressures greater than 3.7 GPa, the CL intensity decreases by ~28%. The downshift in the valence bands results in narrowing of the core−valence bandgap, which is magnified in the orthorhombic phase at high pressure. The narrowing of the core−valence bandgap results in the shifting of the CL emission peak to longer wavelengths. This result alludes to the prospect of using high pressure to aid in the detection of otherwise difficult-to-detect wavelengths in the VUV region.
Methods
In situ luminescence and XRD spectra measurements under high pressure
The experiments were conducted at the BL-18C beamline in the Photon Factory (KEK, Tsukuba, Japan). The temperature condition was room temperature. The experimental schematic diagram is shown in Fig. 3a. An X-ray beam with a photon energy of 20 keV and a beam diameter of 100 μm was incident on the BaF2 sample, and most of the X-rays were absorbed by the sample. The luminescence of the sample was measured by a spectrometer (HORIBA iHR 320) through an optical fiber. The spectrometer has a grating density of 600 g/mm. The X-ray diffraction (XRD) pattern was measured by moving the flat panel detector behind the sample with a camera length of 139 mm. The sample was subjected to pressure in a sapphire anvil cell (Fig. 3b). A pair of anvils applied pressure to the sample, and the pressure on the sample was increased by closing four screws on the cell. The diameter of the sapphire anvil cell was 3.10 mm, the height was 1.70 mm, and the culet diameter was 0.80 mm. The space around the sample was filled with a pressure-transmitting medium, which was a liquid mixture of 4:1 methanol and ethanol. The liquid mixture maintains a hydrostatic pressure of ~10 GPa at room temperature49. The pressure value was observed by measuring the emission spectrum from a ruby ball. How the ruby luminescence wavelength shifts with external pressure has been previously reported50,51,52. The hole diameter of the copper gasket was 300 μm. Copper is usually used as the gasket material for sapphire anvils53.
Numerical calculations
The effects of increasing pressure on the electronic properties of BaF2 were investigated numerically through the uniform compression of the lattice constants achieved by applying Pulay stress along both axes of the crystal. The pressures considered in the numerical calculations ranged from 0.1 GPa (approximately ambient) to 14 GPa, following the pressure values in the experiment up to 8.7 GPa. The atomic coordinates and lattice constants were optimized for each pressure. The optimized lattice constants for each pressure were used for band structure calculations. A convergence criterion of 1 × 10⁻⁶ eV/atom and a sufficiently high plane wave basis cutoff of 500 eV were imposed for geometry optimization and band structure calculation via the generalized gradient approximation and Perdew–Burke–Ernzerhof (GGA–PBE) functional. The k-point paths for band structure calculations for cubic and orthorhombic structures were set following the first Brillouin zone21,54,55.


Responses