Shaping terahertz waves using anisotropic shear modes in a van der Waals mineral

Introduction
Since the discovery of graphene1, great attention has been attracted to the research on naturally occurring van der Waals (vdW) materials2. These layered minerals are generally characterized by strongly bonded intralayer structures that are held together by weak interlayer vdW interactions3. As exfoliation4 of the bulk crystal can be used to isolate a few of its layers, down to a single one, vdW minerals are considered a low-cost source of high-quality two-dimensional (2D) materials, where appealing quantum phenomena can emerge from low-dimensionality. Exploring 2D materials with complementary properties is crucial for the development of a variety of electronic, optoelectronic, and mechanical nanodevices that leverage different stacks of vdW heterostructures5,6,7. Therefore, physical characterization of vdW minerals, particularly understanding their interlayer interactions, is essential to elucidate their properties, including optical anisotropy8,9,10,11,12,13.
Among the family of broadly available natural vdW materials, one can highlight the mineral clinochlore, one of the most abundant phyllosilicates in nature14,15. With a chemical formula Mg5Al(AlSi3)O10(OH)8 and a unit cell composed of an alternating stacking of brucite- and talc-like layers16,17, clinochlore is a large bandgap insulator that can be mechanically exfoliated down to a few layers. These properties make it a promising air-stable and optically active component for future optoelectronic devices. Although a high-throughput investigation has covered the optical characterization of clinochlore across a wide range of energies14, there remains a need to explore its low-frequency spectrum in the terahertz (THz) band, down below 3 THz (100 cm−1 in wavenumber). In layered crystals with more than one layer in their unit cell, this frequency range houses zone-center optical phonons associated with the relative movement of adjacent layers as rigid units18,19,20. On the contrary, in layered crystals with only one layer in their unit cell, the wavevectors of the rigid-layer lattice vibrations are at the zone-edges21,22,23,24. The rigid-layer modes typically appear between 0.45 and 1.5 THz (15 and 50 cm−1)25 and are predominantly determined by the interlayer interactions26. Experimentally accessing these modes can provide insightful information on the interlayer interacting forces involved.
THz spectroscopy techniques are well-suited for investigating lattice dynamics in the low-energy range, especially for identifying infrared (IR)-active phonons. Since THz light encounters relatively low refractive index values (n ≈ 2)27 and an absence of free carriers in clinochlore, bulk samples can be effectively characterized using terahertz time-domain spectroscopy (THz-TDS)28,29 with minimal transmission losses. Additionally, a THz-TDS setup can be readily modified for polarization-sensitive experiments capable of discriminating anisotropic or chiral effects30. In this work, we performed THz polarimetry measurements to determine how bulk clinochlore reshapes the complex polarization state of transmitted THz waves. We observed an anisotropic, sharp, and prominent resonance feature in the retrieved complex refractive index spectrum, which we identified as the manifestation of clinochlore rigid-layer shear phonon modes, predicted by theoretical computations. Its clear Lorentzian shape allowed the extraction of the effective phonon parameters as a function of sample orientation. Moreover, we show that the anisotropic modes introduce complex Faraday rotations near the resonance, through detected differences between the opposite handedness of the transmitted THz waves’ circular polarization components. Finally, our analysis indicates that the observed anisotropic behavior of shear phonons can be accurately described using a Jones formalism approach, with a matrix of linear eigenstates31.
Results
Polarization-sensitive time-domain waveforms
The structure of clinochlore is a variation of talc32, a well-behaved phyllosilicate mineral that serves as a standard model for 2:1 trioctahedral phyllosilicates. Talc is composed of two tetrahedral silicon oxide layers with apical oxygens pointing towards a magnesium trioctahedral layer positioned between them, with oxygen (O) and hydroxyl (OH) groups at the vertices33. In clinochlore, one of the four silicon ions in the talc-like layer is substituted by aluminum ions34, leading to charge imbalance. Charge neutrality is restored by the formation of an additional trioctahedral brucite-like layer that intercalates between the talc-like layers33. This brucite-like layer has a mixed contribution of magnesium and aluminum as central ions14. Clinochlore exhibits a monoclinic crystal structure35, as shown in Fig. 1a, with the intercalated brucite- and talc-like layers stacked along the c axis, parallel to the ab plane.

a Representation of the crystal structure of clinochlore. b Illustration of the relative movement of adjacent brucite- and talc-like layers, in clinochlore, for the lower (red arrows) and the higher (blue arrows) frequency rigid-layer shear phonon modes. c Schematic diagram of the THz-TDS setup in transmission geometry with a configuration of wire grid polarizers (WGP) which allows polarization-sensitive measurements. d Measured time-domain waveform showing the full polarization state of a THz pulse reshaped after being transmitted through the clinochlore sample.
Our sample was previously characterized by other techniques14, which found that the most common impurity is iron in different oxidation states (Fe2+ or Fe3+). Considering this, we performed density-functional perturbation theory (DFPT) of the lattice vibrations of bulk clinochlore, starting from the pristine structure Mg5Al(AlSi3)O10(OH)8, and further introducing iron ions into octahedral sites. Our DFPT results predicted two IR-active rigid-layer shear phonon modes with frequencies very close together, below 1.65 THz (55 cm−1) for the pristine structure. Those frequencies are decreased towards 1.14 THz (38 cm−1) when the iron impurities are introduced; see the Supplementary Information36. For these phonons, adjacent layers move rigidly in opposite directions with respect to one another, as Fig. 1b illustrates for the lower (red arrows along the a axis) and the higher (blue arrows along the b axis) frequency modes.
To fully record the optical anisotropic behavior, we modified a conventional setup for THz-TDS in a transmission geometry29 by adding wire grid polarizers (WGP) to enable polarization-sensitive measurements37, as presented in the scheme of Fig. 1c. For a fixed incident THz polarization direction, parallel to the lab x-axis, the transmitted THz electric field temporal waveforms were collected in an orthogonal basis of Ex(t) and Ey(t); see Fig. 1d. Because amplitude and phase components are preserved in THz-TDS measurements, the acquired waveforms carry information of both polarization rotation θ and ellipticity η angles. As shown in Fig. 1d, although most of the transmission amplitude remains aligned with the incident THz polarization, a measurable non-negligible y component introduces an overall polarization rotation and change in ellipticity. These measurements were repeated for different rotation angles β of the sample crystal plane ab around lab z-axis; see the Supplementary Information36. Further, spectral information was recovered from time-domain data by Fourier-transforming it into frequency (ν)-dependent complex-valued THz electric fields Ex(ν) and Ey(ν).
Identification of the phonon mode
Before dealing with the full polarization state, it is insightful to first examine the information carried by the x-polarized component of the THz-TDS measurements, which contains most of the signal amplitude, as noted above. For arbitrary β, Fig. 2a compares Ex(t) collected for clinochlore and talc samples (blue and orange curves, respectively), along with a reference waveform Eref(t) measured in the absence of any sample (gray curve). The Fourier amplitudes ∣Ex∣(ν) of each signal are shown in Fig. 2b, where a strong and sharp absorption pattern, centered around 1.13 THz, is observed exclusively for clinochlore. Conventional transmission models in the bulk limit38 were then used to derive the complex refractive index spectrum ({tilde{n}}_{xx}(nu )={n}_{xx}(nu )+i{kappa }_{xx}(nu )) of each material from their transmission coefficients Tx(ν) = Ex(ν)/Eref(ν). Figure 2c shows the frequency dependence of the real part (nxx). From the imaginary part, namely the extinction coefficient κxx, we calculated the absorption coefficients αxx = 4πνκxx/c, where c is the speed of light in vacuum; see Fig. 2d. Clinochlore ({tilde{n}}_{xx}) spectrum exhibits a clear Lorentz resonance feature, typical of a phonon mode, which is absent in talc.
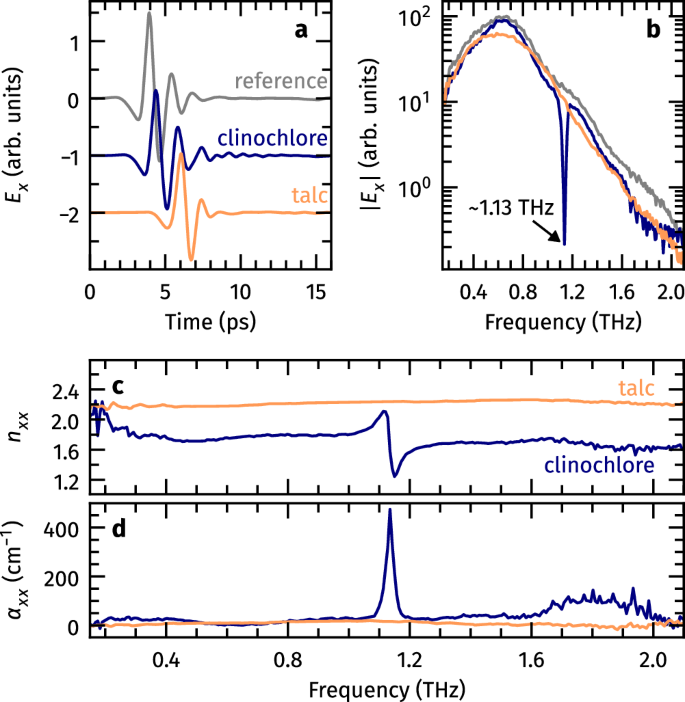
a Time-domain waveforms of the THz electric field x-polarized component of pulses transmitted through clinochlore and talc samples, in comparison with a sample-free reference measurement. b Spectral amplitudes retrieved after Fourier-transforming the time-domain waveforms, indicating an absorption line in the clinochlore THz spectrum. c Frequency-dependent refractive indices and d absorption coefficients extracted from THz-TDS experimental data for clinochlore and talc.
Given that low-frequency intralayer IR modes in clinochlore are expected to have very low intensities17, the retrieved high values of αxx disfavor hypotheses of in-layer mechanisms for the origin of the observed resonance. A comparison with the talc sample results also supports this statement, at least as it concerns the talc-like layer in clinochlore. Conversely, interlayer mechanisms are endorsed by the observed resonance central frequency, because it matches the range predicted by our DFT calculations of rigid-layer shear phonons in bulk clinochlore with iron impurities.
Orientation-dependent effective phonons
Now, for the clinochlore sample, we investigate the orientation dependence of ({tilde{n}}_{xx}(nu ,beta )), by analyzing the x-polarized transmission data for different angles β ranging from 0° to 360°. Here, we consider β = 0° the orientation in which the laboratory and sample coordinates coincide. Restricting our analysis to the THz spectrum around the resonance, the experimental curves obtained for nxx(ν, β) and κxx(ν, β) were used to compose the polar maps shown in Fig. 3a, b, respectively. In these visual representations, the frequency values increase radially, and the β angles are arranged around the circle (azimuth).
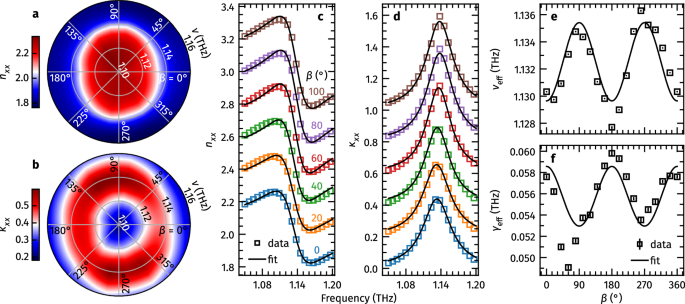
Polar maps of a real and b imaginary parts of clinochlore effective refractive index spectrum, showing its orientation dependence (azimuth) for frequencies around the resonance (radial coordinate). c, d present the optimal fits of equation (1) to the experimental data (hollow squares) for some angles β in between 0° and 100°. e Optimized effective phonon central frequency and f linewidth parameters as a function of the orientation, showing the respective fits of equation (2).
Examining first the map of nxx(ν, β) in Fig. 3a, we observe two main regions delimited by a white-colored oval-shaped contour that is flattened on the sides. The inner red-colored region (lower frequencies) indicates refractive index values higher than those in the outer blue-colored area (higher frequencies). Given the Lorentzian shape of the resonances, the white contour curve should be closely related to the orientation-dependent central frequencies of the effective modes νeff(β). Thus, in comparison with the results of our DFPT calculations, these findings suggest the detection of effective phonons with lower frequencies along the a axis, increasing slightly as the orientation shifts towards the b axis. Modeling with effective modes enables us to account for the averaging over grains with different crystallographic orientations in our sample. The anisotropic behavior of the refractive index is also consistent with our expectations for the shear modes.
A similar analysis can be drawn from the polar map of κxx(ν, β), presented in Fig. 3b. The red-colored doughnut-shaped pattern corresponds to the absorption spectrum near the peak, for different orientations of the clinochlore sample. Once again, the flattening on the sides indicates the anisotropic behavior of the effective phonon frequencies. Moreover, the narrow spectral range of the maps points out that the β-dependent variation of νeff is actually very small. In the following, we quantify it in terms of permittivity models.
The complex refractive index (tilde{n}) of a material is connected to its electric properties through the complex permittivity (dielectric function) (epsilon ={tilde{n}}^{2}). In the absence of free carrier effects, we can model the permittivity spectrum as a damped Lorentz oscillator39 to extract information from the β-dependent effective phonon modes as
where ϵ∞ and ϵs are the high-frequency and static dielectric constants, and νeff(β) and γeff(β) are the orientation-dependent effective phonon central frequency and linewidth, respectively.
Let us consider a subset of the data presented in the polar maps examined above. The plots from Fig. 3c, d show, respectively, the experimental curves (hollow squares) of nxx(ν) and κxx(ν) for selected values of β between 0° and 100°. The curves were vertically offset for clarity. For each angle, the model from equation (1) was used in the simultaneous fit of nxx and κxx, where all parameters were varied during the optimization process. The resulting optimal curves (black lines) in Fig. 3c, d show excellent agreement with the experimental data.
The optimization process was repeated for all probed β angles. From the optimal parameters, the mean values of the dielectric constants were determined as ϵ∞ = 4.17 ± 0.01 and ϵs = 4.28 ± 0.01, while the behaviors of νeff(β) and γeff(β) (hollow squares) are presented in the respective plots of Fig. 3e, f. In these figures, the black line curves indicate that the experimental effective phonon parameters are well approximated by the models
where we have defined νa ≡ νeff(β = 0°), νb ≡ νeff(β = 90°), and similarly for the linewidths36. It then follows that the effective phonons can be described as a mixture of two modes: one aligned along the a direction, with νa = (1.129 ± 0.001) THz and γa = (0.059 ± 0.001) THz; and the other aligned along the b direction, with a slightly higher frequency νb = (1.135 ± 0.001) THz and a smaller linewidth γb = (0.053 ± 0.001) THz.
Anisotropy-induced complex Faraday rotations
We analyzed the full polarization state of clinochlore THz-TDS data in a circularly polarized basis to track changes in the terahertz polarization axis and ellipticity. Therefore, we transformed the measured spectra Ex(ν, β), Ey(ν, β) into left- (LHCP) and right-hand circular polarization (RHCP) components as ({E}_{ell }(nu ,beta )=({E}_{x}(nu ,beta )-i{E}_{y}(nu ,beta ))/sqrt{2}) and ({E}_{r}(nu ,beta )=({E}_{x}(nu ,beta )+i{E}_{y}(nu ,beta ))/sqrt{2}), respectively40. With this approach, we can examine how clinochlore transmission reshapes both LHCP and RHCP components of the incident linearly-polarized THz spectrum. For instance, if we define the transmission coefficients Tℓ(ν, β) = Eℓ(ν, β)/Eref(ν) and Tr(ν, β) = Er(ν, β)/Eref(ν), we can quantify the transmission response differences for each handedness. Figure 4a presents the behavior of (-2log | T(nu ,beta )|) near the resonance center, for LHCP (solid lines) and RHCP (dashed lines) data, across β angles from 0° to 180°. The observed peaks are related to the total absorption responses due to the shear modes.
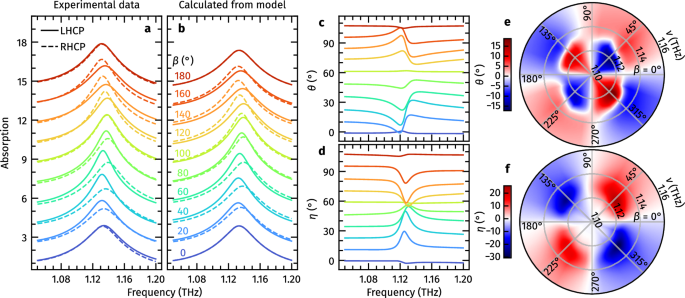
a Comparison of (-2log | T|) determined from the LHCP (continuous lines) and RHCP (dashed lines) components of clinochlore THz transmission data, in the spectral range around the resonance, for some angles β in between 0° and 180°. b The same quantities are now calculated from the model (equation (3)). c real and d imaginary parts of the complex Faraday rotation. e, f present their respective polar map representations.
When the incident THz polarization is closely aligned with one of the sample axes, a or b (for example, β = 0°, 100°, or 180° in Fig. 4a), the differences in LHCP and RHCP absorptions are minimal. On the other hand, for sample orientations between these directions, we observe not only different amplitudes, but also frequency shifts when comparing the components. Given that these effects are relatively symmetrical, and considering the anisotropic behavior of the phonon modes discussed in the previous section, we can employ geometric reasoning to infer that the circular transmission coefficients may be modeled as
where Ta(ν) and Tb(ν) are the linear transmission coefficients due to the shear phonons along a (lower frequency) and b (higher frequency) axes, respectively.
By inputting experimental data for Ta(ν) and Tb(ν) into equation (3), we reconstructed the curves shown in Fig. 4b. As we can see, the absorptions calculated from the model preserve the key features of the experimental data (Fig. 4a). Thus, this suggests that the observed polarization modification effects near the resonance may be associated with phonon anisotropy. A previous study on seraphinite gemstone41 also demonstrated anisotropic absorption in that mineral variant.
Another way of investigating the polarization effects is by determining the complex Faraday rotations (FR), which we denote as (tilde{theta }). One of the advantages of this approach is that it does not rely on a reference measurement, as it compares directly the LHCP and RHCP components of the signal through (tilde{theta }=-arctan [i({E}_{r}-{E}_{ell })/({E}_{r}+{E}_{ell })])42. Written as (tilde{theta }(nu ,beta )=theta (nu ,beta )+ieta (nu ,beta )), the real part of the FR is actually the polarization rotation angle, and its imaginary part is the ellipticity angle43. For the same β values and the spectral range shown in Fig. 4a, b, the experimental curves for θ(ν, β) and η(ν, β) are presented in the plots from Fig. 4c, d, respectively. As we can see, there are significant effects on both rotation and ellipticity data, centered around 1.13 THz, only for β angles in which LHCP and RHCP absorptions are different.
We can better visualize this pattern through the polar maps shown in Fig. 4e, f. For each respective map, higher values of rotation or ellipticity are represented by more intense red or blue colors, depending on the sign. On the other hand, white regions are associated with zero rotation or ellipticity. In particular, the maps show that virtually no polarization modification effects occur for any radial orientation that matches clinochlore a or b axes. Therefore this gives us an important insight into the symmetries of the observed shear phonons, as a and b should be the eigenvectors of polarization.
Discussion
We can use Jones calculus44 to understand the interaction of the THz light with materials in polarization-sensitive THz-TDS experiments. If we consider the polarization states of the incident and transmitted THz electric fields as the respective Jones vectors Ei(ν) and Et(ν), they may be related through a frequency-dependent 2 × 2 Jones matrix T(ν) so that Et(ν) = T(ν)Ei(ν)45. The information gathered from our experimental results suggests that, considering the anisotropic shear phonons in clinochlore, the Jones transmission matrix may take the form
when written on the basis of the eigenvectors of polarization, a and b. Thus, the associated reduced (2 × 2) dielectric tensor ϵ(ν)46 is also diagonal in this basis
where, ϵa(ν) and ϵb(ν) are, respectively, the permittivity spectra of the lower and the higher frequency phonon modes. The out-of-plane permittivity is not considered here, since it does not affect the transmission of the THz waves polarized in the xy plane, as employed in our experimental method. Moreover, we consider the non-zero elements of ϵ(ν) being described by independent Lorentz oscillators.
On the other hand, our THz-TDS experimental setup is mainly described in terms of the fixed laboratory coordinates xy. For instance, to recover the effective dielectric response along x-axis we can compute ({epsilon }_{xx}=hat{x}cdot ({boldsymbol{epsilon }}cdot hat{x})), where (hat{x}) is the unit vector in this direction. Naturally, ϵxx now depends on the sample orientation, so that
We then notice that, as long as the phonon central frequencies νa and νb are sufficiently close together (which is the case for our observations), ϵxx(ν, β) itself may be approximated as a Lorentz oscillator, regardless of the β value. In this sense, with the additional assumption for the linewidths γa ≈ γb, equations (1) and (6) predict the phenomenological models for νeff and γeff introduced in equation (2).
To express the Jones matrix in laboratory coordinates, we need to rotate it to an angle β using the transformation T(ν, β) = R−1(β)T(ν)R(β), where R(β) is the unitary matrix of rotations31, and the β dependence of T(ν, β) implies it is no longer in the basis of the eigenvectors. Hence, the rotated Jones matrix can be written as
which has the generalized shape of a simple anisotropic media with linear eigenstates, indicating a mirror symmetry Mnz with respect to a plane that contains z-axis45. Further, we may compute Tcirc(ν, β) = Λ−1T(ν, β)Λ, where Λ is the unitary transformation matrix to a circular polarization basis31, resulting in
As we can see, given that the diagonal elements in equation (8) are equal, there is no chirality, but the anisotropy is encoded in the different off-diagonal elements. Additionally, the same transmission coefficients derived in equation (3) can be retrieved from Tcirc through ({T}_{ell }(nu ,beta )=hat{ell }cdot ({{bf{T}}}_{{rm{circ}}}(nu ,beta )cdot hat{x})) and ({T}_{r}(nu ,beta )=hat{r}cdot ({{bf{T}}}_{{rm{circ}}}(nu ,beta )cdot hat{x})), where (hat{ell }) and (hat{r}) are the respective unit vectors of LHCP and RHCP36. Thus, our approach demonstrates optical anisotropy arising from material resonances, in contrast to the anisotropy reported for vdW materials in the visible range due to geometrical anisotropy of the elementary crystal cell13, as well as for the controlled arrangement of two-dimensional47 and quasi-one-dimensional structures48.
In conclusion, we studied the THz transmission spectrum of a clinochlore sample, retrieved through polarization-sensitive THz-TDS measurements. From the experimental data, we determined the static and high-frequency dielectric constants with values of 4.28 ± 0.01 and 4.17 ± 0.01, respectively. We observed a strong and sharp anisotropic absorption line, centered around 1.13 THz. Regardless of the clinochlore sample ab plane orientation around z-axis, its effective complex refractive index spectrum exhibited great agreement with a damped Lorentz oscillator model, characteristic of a phonon mode. Comparisons with DFPT calculations were used to identify this resonance as the clinochlore rigid-layer shear phonon dynamics, with a mode frequency that can be tuned from the pristine case (1.65 THz) to our case when considering the incorporation of iron impurities. Analyses of the experimental data indicate that our observations can be explained in terms of effective phonon modes with a lower frequency (1.129 THz) linear mode aligned to the a axis, and another one aligned to the b axis with a higher frequency (1.135 THz). Even though these frequencies were found to be closer together than predicted theoretically, the anisotropy of the modes was sufficient to induce Faraday rotation and ellipticity. Moreover, using Jones formalism, the shear phonons contribution to clinochlore THz transmission spectrum was successfully encoded in a Jones matrix with linear eigenstates, like in a simple anisotropic media. Considering that we are working with a large polycrystalline mineral sample from a natural environment, the reported anisotropy in the terahertz range is remarkable. These results demonstrate that fundamental information about interlayer vibrational modes can be obtained from the terahertz optical anisotropy in van der Waals minerals. Applications of the observed shaping of the polarization of transmitted light pulses reinforce the potential of using abundant layered minerals as the source of two-dimensional materials with controllable phononic properties through impurity engineering.
Methods
Samples
For the main investigations in this work, we used a natural bulk clinochlore sample, extracted from the Minas Gerais/Brazil geological environment, shaped as a 140-μm-thick nearly square slab with side dimensions on the order of 3 mm. Given that phyllosilicates are hydrated minerals, the clinochlore sample surpassed a heat treatment in a tubular furnace under an ambient atmosphere for 90 min at 500 °C to remove water content32 and improve the sample crystallinity prior to the THz-TDS measurements. For the comparison measurement pointed out in the text, we used a natural bulk talc sample from the same geological environment and similar shapes and dimensions.
Measurements
We used a conventional THz-TDS setup in a transmission geometry29, modified with a set of three wire grid polarizers (WGP)37 to enable the polarimetry measurements at room temperature. Pulses from a mode-locked Ti:sapphire laser oscillator tuned to 780 nm, with a pulse duration of 130 fs and a repetition rate of 76 MHz, were used for pumping a biased photoconductive antenna (PCA), set for generating linearly-polarized THz radiation in the x direction. This polarization state was carefully ensured by a polarizer (WGP1). The THz beam was focused with a 3-mm spot diameter onto the sample positioned in a rotation mount. The transmitted beam leaving the back of the sample passed through a pair of polarizers (WGP2 and WGP3) before it was collected and probed by another optically-gated PCA. We calibrated WGP1 and WGP3 for the same fixed polarization direction. Then, we defined a THz-TDS measurement as comprised of two different scans: E+(t) with WGP2 set to +45° (with respect to WGP1/WGP3); and E−(t) with WGP2 set to − 45°. Finally, the full polarization state in laboratory coordinates was recovered through Ex(t) = E+(t) + E−(t) and Ey(t) = E+(t) − E−(t).
Density-functional perturbation theory calculations
The spin-polarized density-functional theory (DFT)49,50 and density-functional perturbation theory (DFPT)51 calculations were performed by using the QUANTUM-ESPRESSO distribution52,53. The calculations were performed by using the local exchange-correlation (XC) functional with the Perdew–Burke–Ernzerhof’s parametrization of the generalized gradient approximation (GGA) for solids (PBEsol)54. The valence electron-nucleus interactions were described by using DOJO55 optimized norm-conserving Vanderbilt pseudopotentials (ONCVPSP)56, setting the kinetic energy cutoff in the wave-function (charge density) expansion to 46 Eh (184 Eh). The geometries were relaxed until the forces on atoms and stress on the lattice were lower than 2.57 meV/Å and 50 MPa, respectively, using Brillouin Zone sampling in a 6 × 4 × 2 Γ-centered Monkhorst–Pack (MP) grid57. The electronic occupations were smoothed by using 2.5 mEh within the cold smearing method58.


Responses