Joint association of objective and subjective aging with premature mortality

Introduction
Aging is the process of becoming older, characterized by time-related deterioration of physiological and psychosocial functions. It is a complex system across multiple biological systems, with hallmark features that include cellular senescence, genomic instability, and loss of proteostasis1. Despite its universality, aging progresses at highly variable rates within and between individuals2,3, highlighting the challenge of identifying a single informative marker of biological aging.
Objective indicators of aging, measuring functional decline, are direct and accessible performance of accelerated biological aging. Sensory loss, tooth loss, and falls exemplify such indicators, as they reflect functional decline with progressive aging. Vision impairment, for instance, is projected to affect 1.8 billion people globally by 2050, predominantly among those over 604. Beyond its impact on vision, it has effects on physical, cognitive, and mental health5,6. Similarly, hearing loss and tooth loss are prevalent in older adults and are linked to adverse aging outcomes, including mortality and dementia7,8,9,10,11. Falls, indicative of reduced mobility and body control, are a leading cause of unintentional injury deaths and indicate vulnerability to physical and psychological health challenges in older adults12,13,14,15. While objective aging indicators reflect physiological decline, subjective aging differently captures an individual’s perceptions and interpretations of aging, shaped by personal experiences and cultural contexts. Systematic reviews consistently show that positive subjective aging is associated with better physiological and psychological outcomes, such as improved cognitive function, lower depression rates, and better self-rated health, in older adults16,17. These findings underscore the distinct yet complementary perspectives of aging demonstrated by objective and subjective indicators.
However, a multidomain aging framework combining both objective and subjective aging indicators remains underexplored. These indicators may contribute cumulatively to biological aging through different pathways. For instance, tooth loss may lead to reduced diet intake and quality, with subsequent inflammation, cognitive function, cardiovascular disease (CVD), and mortality18,19,20,21. Hearing loss has been connected to social isolation and loneliness, which not only have important implications on psychosocial health but also are associated with accelerated biological aging, CVD, and increased mortality risk22,23,24,25. Falls, beyond physical injuries, are connected to psychological fear and social isolation13,14,15. Meanwhile, subjective aging influences health behaviors, psychological well-being, and physiological stress responses, further affecting health outcomes26. To address this gap, we integrated aging indicators within a multidomain framework to assess their cumulative associations with premature mortality. Additionally, we examined how this cumulative indicator interacted with frailty, an established measure of aging reflecting decreased physiological reserves and increased vulnerability to adverse outcomes such as multimorbidity and mortality27,28.
In this study, we evaluated the associations between a multidomain measure combining objective and subjective aging indicators, and the risk of premature mortality in over 300,000 adults from the UK Biobank, with replication in the Health and Retirement Study (HRS). We also evaluated the joint association of the indicator with The Fried Frailty phenotype to determine their complmentary value in aging research.
Methods
Study population
In the UK Biobank study, over 500,000 participants from the general population were recruited across 22 assessment centers throughout the United Kingdom, aged between 40 and 69 years, from 2006 to 2010. Our analysis included 369,741 participants, after the exclusion of 78,826 participants with prevalent CVD and cancer, and an additional 53,800 participants due to incomplete information on objective and subjective aging indicators (hearing loss, tooth loss, subjective aging, and falls) at baseline. The study was approved by the Northwest Multi-Centre Research Ethics Committee and the Tulane University (New Orleans, LA) Biomedical Committee Institutional Review Board, and written informed consent was obtained from all participants.
To validate the combination of these indicators, we further examined the associations of objective and subjective aging indicators with all-cause premature mortality in an independent, prospective cohort, HRS. Details of the methods regarding validation analysis in HRS have been provided in the Supplemental Method.
Assessment of objective and subjective aging indicators
We combined four self-reported aging indicators: hearing loss, tooth loss, falls, and subjective aging. Information was extracted from a touch-screen questionnaire. Hearing loss status was defined based on the question “Do you have any difficulty with your hearing?” with optional responses of “yes”, “no”, or “I am completely deaf”. We defined participants with hearing loss if they answered “yes” or “I am completely deaf”. Mouth/tooth dental problems were collected (“Do you have any of the following?”): mouth ulcers, painful gums, bleeding gums, loose teeth, toothache, dentures. Participants once reported loose teeth and dentures would be classified as having tooth loss. Participants’ experience about falls in the last year was asked (“In the last year have you had any falls?”), and those who reported any falls were classified as having this condition. Subjective aging was measured by a question “Do people say that you look” with possible answers: “younger than you are”, “older than you are”, and “about your age”. Participants were classified as having older subjective age than actual age if answering “older than you are”. The total number of existing objective and subjective aging indicators were then summed to a single variable ranging from 0 to 4.
Frailty
The widely used Fried Frailty phenotype defines frailty and pre-frailty according to the presence of following criteria: weakness, slowness, low physical activity, exhaustion (or fatigue) and unintentional weight loss29. The definition has been adapted and validated in previous studies using UK Biobank data27,30,31. Detailed definition of frailty phenotypes was shown in the Supplemental Table 1. Participants were then classified as frail (meet ≥ 3 criteria) or non-frail (meet < 3 criteria) according to cutoffs proposed by Fried and colleagues29. As frailty is strongly associated with aging indicators32,33,34,35 and mortality27,28, we assessed its potential confounding role in the association between aging indicators and premature mortality. In addition, given our hypothesis that the multidomain framework interacts with established measures of aging, the joint associations with frailty on the risk of premature mortality were assessed.
Assessment of premature death
Death and death date were obtained by reviewing death certificates held by the National Health Service. Premature mortality was defined as death occurring before age 80 years old36, which was close to the life expectancy of population in UK. Follow-up time was calculated from the date of baseline to the date of death, the date of the individual’s 80th birthday, or the censoring date (Dec 31, 2022), whichever occurred first. CVD premature mortality and cancer premature mortality were classified based on the International Statistical Classification of Diseases and Related Health Problems, Tenth Revision (ICD-10) codes I00-I99 and C00-C97, respectively.
Assessment of covariates
Sociodemographic characteristics (chronological age, sex, race, education levels, Townsend deprivation index) were included to account for differences in access to healthcare resources. Lifestyle factors (body mass index [BMI], smoking status, alcohol consumption, physical activity, healthy sleep patterns, healthy diet) were included to control behavioral determinants of health. Clinical variables (baseline hypertension, type 2 diabetes, high cholesterol, anti-hypertensive drug use, insulin use, and lipid-lowering drug use) were included to address underlying health conditions that might confound the associations between aging indicators and premature mortality. A touch-screen questionnaire was used to assess most of the covariates at baseline37. Sex was classified as men or women. Self-reported race was classified as White or non-White. We categorized the years of education into low (≤10 years), medium education (11–18 years), and high education (≥19 years), based on the highest qualification achieved38. Townsend deprivation index is a composite measure of deprivation based on unemployment, non-car ownership, non-home ownership, and household overcrowding; a negative value represents high socioeconomic status. BMI was calculated as weight in kilograms divided by height in meters squared (kg/m²). Self-reported smoking status was classified into two categories: never smokers, and ever smokers. Alcohol intake was grouped into two categories: moderate consumption (defined as 0 to 14 g/d for women and 0 to 28 g/d for men, with the maximum limit reflecting US dietary guidelines)39,40, and non-moderate consumption. Intensity of physical activity was defined per the guideline as high physical activity (≥150 min of moderate intensity activity per week or ≥75 min of vigorous activity per week or an equivalent combination per week), or low41. Healthy diet was based on consumption of at least 4 of 7 food groups (fruits, vegetables, fish, processed meat, unprocessed red meat, whole grains, and refined grains) following recommendations on dietary priorities for cardiometabolic health42. Healthy sleep patterns were based on having at least 4 of 5 healthier sleep factors (chronotype, duration, insomnia, snoring, and excessive daytime sleepiness) following previous studies in the UK Biobank43. Detailed definition of lifestyle factors were shown in Supplemental Table 2. Baseline hypertension was defined as a systolic blood pressure ≥ 140 mmHg or a diastolic blood pressure ≥ 90 mm Hg, a self-reported diagnosis by physicians, or blood pressure medication use. Baseline type 2 diabetes was ascertained based on ICD-10 codes (E11), a self-reported diagnosis by physicians or insulin use. Baseline high cholesterol was ascertained based on a self-reported diagnosis by physicians or lipid-lowering drug use. Anti-hypertensive drug, insulin, and lipid-lowering drug use were collected with the self-reported questionnaire. We handled missing covariates with the missing indicators for categorical variables and mean imputation for continuous variables.
Statistical analysis
We first summarized the baseline characteristics of the study population according to the number of aging indicators. Cox proportional hazards regression was used to quantify the associations between the number of aging indicators and the risk of all-cause and cause-specific premature mortality. We verified the proportional hazards assumption through both the Kaplan-Meier method and Schoenfeld residuals, finding no evidence of violation. In the basic model, we adjusted for chronological age and sex. In Model 2, we further adjusted for race (Whites, or non-Whites), education levels (low, medium, or high), Townsend deprivation index (<median, or ≥median), BMI, smoking status (never smokers, or ever smokers), alcohol consumption (moderate alcohol consumption, or not), intensity of physical activity (high, or low), healthy sleep patterns (yes, or no), healthy diet (yes, or no), baseline hypertension, type 2 diabetes, high cholesterol, and medication use (anti-hypertensive drugs, insulin, and lipid-lowering drugs). To evaluate the potential confounding role of frailty, we further adjusted frailty (yes, or no, based on the Fried frailty phenotype) in Model 3.
Several subgroup analyses were then conducted by age groups (<55, 55–64, and ≥65 years old), modifiable lifestyle factors (smoking, alcohol use, physical activity, diet, and sleep pattern) and socioeconomic status (education, and Townsend deprivation index). The interaction was tested using the Wald test by adding the interaction terms into the model. Given that younger cohorts might have longer follow-up periods to manifest aging indicators’ long-term associations with premature mortality as compared to older participants, we repeated age-stratified analysis by restricting follow-up to 15 years, the longest follow-up time among participants ≥65 years old.
The joint associations between aging indicators and frailty on the risk of premature mortality were assessed. The additivity was measured by relative excess risk due to interaction (RERI), proportion of disease attributable to interaction (AP), and synergy index44. For this purpose, the number of indicators was dichotomized into two groups: fewer than three, and three or more.
The flowchart of data analysis was shown as Supplemental Fig. 1. All statistical analyses, unless otherwise stated, were done with SAS version 9.4 (SAS Institute Inc. Cary, NC, USA). All figures were created using RStudio version 4.2.2. A two-tailed P value of <0.05 was considered statistically significant.
Role of funding source
The study was supported by grants from the National Heart, Lung, and Blood Institute (HL071981, HL034594, HL126024), the National Institute of Diabetes and Digestive and Kidney Diseases (DK115679, DK091718, DK100383, DK078616). Funders had no role in the study design, collection, analysis, and interpretation of data; in the writing of the report; and in the decision to submit the article for publication.
Results
Study population
Table 1 presents the baseline characteristics of the 369,741 participants included in the study. Among these, 40.4%, 39.2%, 16.4%, 3.6%, and 0.4% had 0, 1, 2, 3, and 4 aging indicators, respectively. Participants with a higher number of aging indicators were older, more likely to be men and Whites, and had lower socioeconomic status, as indicated by education levels and Townsend deprivation index. Health conditions and lifestyle also varied significantly with the number of aging indicators. Those with more aging indicators were more likely to have pre-existing conditions such as hypertension, type 2 diabetes, and high cholesterol. Additionally, participants with more aging indicators had lower rates of never smoking, moderate alcohol consumption, high levels of physical activity, adherence to a healthy diet, and maintaining healthy sleep patterns. Frailty was more prevalent among participants with more aging indicators.
Objective and subjective aging indicators and premature mortality
In the analysis of the main aim, we evaluated the association between the number of aging indicators and premature mortality. During a median follow-up of 13.74 years, we documented 22,934 events of all-cause premature mortality, attributed to CVD (4332), cancer (11,384), and other causes (7218). Table 2 shows the adjusted hazard ratios (HR) and 95% confidence intervals (CI) for premature mortality, by the number of aging indicators. The results showed that the risks of premature mortality significantly increased with the number of aging indicators, even after adjustments for covariates. Compared to participants with no aging indicators, the adjusted HRs (95% CI) was 1.81 (1.59–2.07) for all-cause premature mortality, 1.96 (1.47–2.60) for CVD premature mortality, 1.55 (1.26–1.91) for cancer premature mortality, and 2.14 (1.73–2.65) for other causes for those with all four indicators. In age-stratified analysis, as shown in Fig. 1a stepwise increase in premature mortality risk was observed with each additional aging indicator. Younger participants (aged 55 years or younger) with all four aging indicators had the highest incremental risks of all-cause premature mortality (HR: 2.06 [1.31–3.25]). This trend was consistent across cause-specific mortality, with higher HRs observed in younger participants who had more aging indicators (Fig. 1B–D, all P for interaction < 0.05). Furthermore, when the follow-up period was limited to 15 years, the results remained consistent, showing robust modification by chronological age (Supplemental Fig. 2).

The model adjusted for chronological age, sex, race, education levels, Townsend deprivation index, body mass index, smoking status, alcohol consumption, intensity of physical activity, healthy sleep patterns, healthy diet, baseline hypertension, type 2 diabetes, high cholesterol, anti-hypertensive drug use, insulin use, lipid-lowering drug use, and frailty.
As for replication, the associations between the number of aging indicators and all-cause mortality were largely consistent in the independent HRS of participants (Supplemental Table 3). In this cohort, participants with ≥ 3 aging indicators had the highest risk of all-cause premature mortality (1.91 [1.22–3.00]).
In subgroup analyses, interactions between aging indicators and lifestyle factors (smoking, intensity of physical activity, diet) and socioeconomic status (education levels, Townsend deprivation index) were statistically significant (Supplementary Figs. 3, 4, P for interaction < 0.05). The incremental risk of all-cause premature mortality was more pronounced among individuals with adverse lifestyle factors (ever smokers, low physical activity, unhealthy diet) and those of lower socioeconomic status (lower education levels, higher Townsend deprivation index).
Joint associations of objective and subjective aging indicators and frailty with premature mortality
In the analysis of joint associations between objective and subjective aging indicators and frailty, we explored the interaction between these variables in relation to premature mortality. Although no statistically significant multiplicative interaction was observed between the aging indicators and frailty (P for interaction = 0.345), a notable differentiation in risk was observed when examining the joint associations. Specifically, participants with all aging indicators but without frailty had a higher risk of all-cause premature mortality (HR: 1.96 [1.69–2.28]) compared to those with neither aging indicators nor frailty. However, the risk substantially increased in individuals with both frailty and all aging indicators, with an HR of 3.23 (95% CI, 2.46–4.23), as illustrated in Fig. 2. Further analysis of the additive interactions revealed that frailty exhibited supra-additive effects on the risk of all-cause premature mortality when combined with the aging indicators (P < 0.001). The RERI was 0.43 (95% CI, 0.22–0.64), indicating a significant contribution of frailty to the risk of premature mortality beyond the additive effects of the aging indicators alone. This interaction accounted for an additional 16.08% (95% CI, 7.91–24.25%) of the risk of all-cause premature mortality (Table 3).
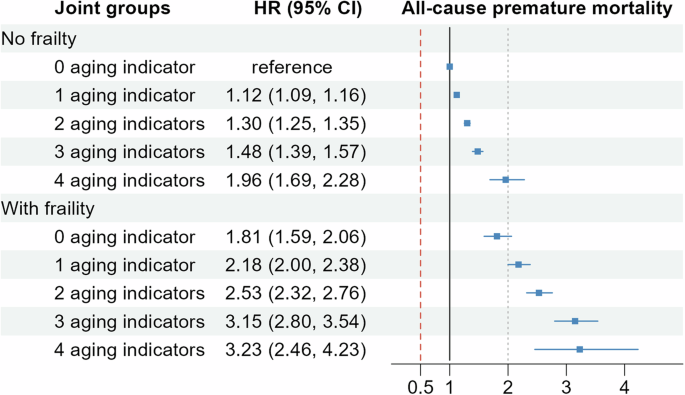
The model adjusted for chronological age, sex, race, education levels, Townsend deprivation index, body mass index, smoking status, alcohol consumption, intensity of physical activity, healthy sleep patterns, healthy diet, baseline hypertension, type 2 diabetes, high cholesterol, anti-hypertensive drug use, insulin use, and lipid-lowering drug use.
Discussion
The current study revealed that participants self-reporting more objective and subjective aging indicators were associated with higher risks of premature mortality, independent of chronological age. The associations were more pronounced among younger participants, those with unhealthy lifestyles, and lower socioeconomic status. Moreover, the additive interaction between these aging indicators and frailty was observed.
To our knowledge, the current study for the first time reported a questionnaire-based multidomain aging indicator combining objective and subjective aging indicators was indicative of premature mortality. Emerging evidence suggests biomarker-based biological aging demonstrates strong predictive performance for mortality and morbidity, often surpassing traditional risk factors. For example, proteomic aging signatures derived from plasma proteins have shown promise in predicting disease risk and mortality, at both whole-body and organ levels45. Compared to biomedical assessments, such as epigenetic or proteomic aging signatures, self-reported questionnaire data may be prone to measurement errors and lack the precision at molecular levels. However, they are non-invasive, cost-effective, and require minimal technical expertise, making them to be easily integrated into population-based studies. The significant associations observed in our study suggest that objective and subjective aging indicators may reflect underlying health and psychosocial processes that are critical to mortality risk. Moreover, these underlying processes, compared to existing aging assessments based on facial and visible signs46,47,48, would synthesize a broader physiological and psychological aging-related changes. Future studies are necessary to evaluate the relative and combined predictive values of subjective and objective indicators with existing aging signatures, to find the best way assessing aging.
The considerable variability of aging rates and aging-related health conditions across population has long been observed2,3. Our findings from stratified analysis by chronological age indicate that the objective and subjective aging indicators could be a better tool in capturing biological aging process in younger participants. The findings are biologically plausible because earlier aging indicators may indicate higher exposures to harmful environmental or lifestyle factors49, and thus accelerated biological aging process. However, the observed attenuation of in older cohorts may also be influenced by survival bias. Older participants might be a selective group who had survived despite potentially having more aging indicators earlier in life, which might underestimate the observed associations in these groups. Furthermore, differences in follow-up duration might modify the associations, as aging indicators in older cohorts had less time to manifest their effects. These factors highlight the complex interplay of study design and population characteristics and suggest cautious interpretation of these findings.
Interactions implied possible interventions and target populations. Unhealthy lifestyles (smoking, inactive physical activity, and unhealthy diet) modified the associations towards anticonservative directions, suggesting potential benefits of modifying these lifestyles. While addressing socioeconomic disparities in population is complex, interventions such as the Moving to Opportunity Experiment demonstrated that targeted strategies could improve certain aspects of socioeconomic status50, highlighting the potential for addressing socioeconomic inequalities. Of note, if both frailty and ≥3 aging indicators were present, an additional 16.08% of premature mortality were identified. Given the estimation that nearly 60% among population aged ≥50 experiencing physical frailty (12%) and pre-frailty (46%) globally51, such an additive interaction indicates a considerable number of older adults affected by premature death and great loss of health spans.
A key strength of the study is the feasibility of assessing objective and subjective aging indicators using questionnaire data, which suggests a possibility of identifying people at high risk of death in large population with cost-effective tools. The replication in the HRS highlights their crucial role in predicting premature mortality and generalizability across diverse populations. The study’s limitations also warrant consideration. First, inclusion of aging indicators was limited by data availability in the UK Biobank. To maximize feasibility and generalizability, we did not include indicators restricted to men (such as baldness), or requiring professional measurements (like vision loss). Second, longitudinal changes of aging indicators, like quantity and severity, which may better represent dynamic biological aging process, require future investigations. Third, the underlying mechanisms of each aging indicator might not be completely due to aging. For example, hearing loss could be classified as conductive and sensorineural hearing loss, congenital malformations of ear, and others, with different pathophysiological pathways and inducement including aging. Thus, although these objective and subjective aging indicators are common performance of aging process, the interpretation of current findings needs extra caution since an unknown subfraction of associations should be explained by reasons other than biological aging. Future comparisons with advanced biomarkers (e.g., epigenetic aging clocks) are important to validate their role as aging measures.
In conclusion, a multidomain aging indicator, combining self-report hearing loss, tooth loss, falls, and subjective aging, was associated with a higher risk of all-cause and cause-specific premature mortality. Our findings underscore the need to consider both objective and subjective dimensions of aging performance.


Responses