Predicting poor performance on cognitive tests among older adults using wearable device data and machine learning: a feasibility study

Introduction
Cognitive function naturally wanes as a result of aging, but cognitive decline beyond what is biologically normal can lead to a loss of independence and lower quality of life1,2. Interventions exist that can preserve cognition among older adults3,4, but the effectiveness of such interventions hinges on accurate monitoring to detect changes in cognitive function for timely implementation. Existing methods used for monitoring cognition are limited in their ability to repeatedly measure cognitive capabilities across time. For example, standardized cognitive tests are time consuming and require a trained professional to administer. Such tests additionally have a limited number of validated versions, meaning they cannot be used repeatedly over short timeframes due to test familiarity resulting in biased measurements that don’t reflect underlying changes in cognitive function. Machine learning-based tools have also been developed, but many require expensive and labor-intensive data collection procedures such as gathering genetic biomarkers, conducting magnetic resonance imaging (MRI), or administering lengthy surveys5,6,7,8,9. Approaches are therefore needed that can repeatedly differentiate between normal versus poor cognition to overcome the test-retest reliability, time, and labor limitations of existing methods.
Wearable devices offer a convenient mechanism for collecting data that could be used to monitor cognition using machine learning models, however, it is currently unclear if such data is sufficient to accurately predicting cognitive outcomes. Previous studies have shown that older adults with poor cognition have worse sleep quality, sleep insufficiently many hours per night, are more sedentary, and have different circadian rhythm characteristics relative to older adults with normal cognition2,10,11,12,13. All such metrics, namely sleep, activity, and circadian parameters can be captured using accelerometers embedded in wearable devices. Other wearable-device metrics that can manually be collected through user interfaces such as demographic and lifestyle factors are also associated with cognition2,14. While wearable-device data has been used extensively to identify factors associated with cognitive function, the application of such data for prediction tasks has been limited to small samples of participants with existing impairments. For example, Bringas et al. used deep learning to classify Alzheimer’s disease stages using accelerometry15, Mc Ardle et al. used accelerometer data from gait assessments to differentiate between dementia subtypes16, and Rykov et al. used wearable device data and machine learning assess cognition among older adults with mild cognitive impairments17. While results from existing studies are promising, cognitive monitoring systems based on wearable device data cannot be used in the general population until it is determined if prediction models trained on such data can accurately differentiate between older adults with normal cognition from those who may require further evaluation for potential interventions. Examining predictive ability across different measures of cognitive function could also uncover which subdomains of cognition are best suited to be monitored using wearable-based prediction models.
Using data from over 2400 older adults in the National Health and Nutrition Survey18 (NHANES) we quantified the ability of machine learning models trained on wearable device data to differentiate between older adults with poor versus normal cognition based on categorizations from three cognitive tests that assess immediate, delayed, and working memory, categorical verbal fluency, processing speed, and sustained attention: the Digit Symbol Substitution Test (DSST), the Consortium to Establish a Registry for Alzheimer’s Disease Word-Learning subtest (CERAD-WL), and the Animal Fluency Test (AFT). Hour-by-hour activity intensities were examined using accelerometer data to identify temporal differences in activity patterns between older adults categorized as having normal versus poor cognition based on each test. Associations between sleep, activity, circadian rhythm, and ambient light exposure metrics with each cognitive outcome were further examined to uncover possible targets for future studies seeking to identify causal factors relating to cognitive impairments.
Results
Cohort characteristics
A total of 2479 older adults with an average age of 69.6 (51.7% male) were included in this study (Table 1). Categorizations of poor cognition were defined as scores in the bottom quartile on each cognitive test. Binary indicators of poor cognition based on each test were used as outcomes in both the prediction and association analyses. A total of 625 (25.2%) individuals were categorized as having poor processing speed, working memory, and attention based on the Digit Symbol Substitution Test (DSST), 609 (24.6%) had poor immediate and delayed memory based on the Consortium to Establish a Registry for Alzheimer’s Disease Word-Learning subtest (CERAD-WL) results, and 587 (23.7%) had poor categorical verbal fluency based on Animal Fluency Test (AFT). Participants with poor cognition were significantly less active during daytime hours across all categorizations (Fig. 1). Cohort characteristics stratified by poor cognition based on each test can be found in Supplementary Tables 1–3.

The plot shows hourly activity levels stratified by poor cognitive function, which was defined as scores in the bottom quartile on a given cognitive test, based on (a) processing speed, working memory, and attention as measured by the DSST (b) immediate and delayed memory as measured by the CERAD-WL and (c) categorical verbal fluency as measured by the AFT. Hourly average activity levels and corresponding 95% confidence intervals were calculated and connected using spline interpolation.
Wearable device data best predicts poor processing speed, working memory, and attention as measured by the DSST
Ten features were included in each model (Fig. 2). Every model included age and education, while selected accelerometer-derived and ambient light exposure features varied from model-to-model. During repeated cross-validation baseline age and education models were able to predict poor cognition based on the DSST, CERAD-WL, and AFT with median AUCs of 0.80 (IQR 0.77 to 0.81), 0.71 (IQR 0.68 to 0.74), and 0.68 (IQR 0.66 to 0.70) and with AUPRCs of 0.55 (IQR 0.52 to 0.58), 0.45 (IQR 0.40 to 0.48), and 0.39 (IQR 0.35 to 0.43) respectively (Supplementary Table 5). Full feature set CatBoost models had the highest median AUC compared to the full feature set XGBoost and Random Forest models when predicting poor cognition based on the DSST (median AUC: 0.84, IQR: 0.81 to 0.85), CERAD-WL (median AUC: 0.73, IQR: 0.71 to 0.76), and AFT (median AUC: 0.71, IQR 0.68 to 0.72) as shown in Fig. 3 and Supplementary Table 4. CatBoost also showed the highest median AUPRC when predicting poor cognition based on the DSST (median AUPRC: 0.62, IQR 0.58 to 0.66), CERAD-WL (median AUPRC: 0.49, IQR: 0.43 to 0.52), and AFT (median AUPRC: 0.42, IQR 0.39 to 0.47). Every algorithm performed best when predicting poor cognition based on the DSST (median AUC ≥ 0.82 for each) which assess processing speed, working memory, and attention compared to the CERAD-WL and AFT which measure immediate and delayed memory as well as categorical verbal fluency. The lowest median AUCs and AUPRCs were observed when predicting poor performance on the AFT.
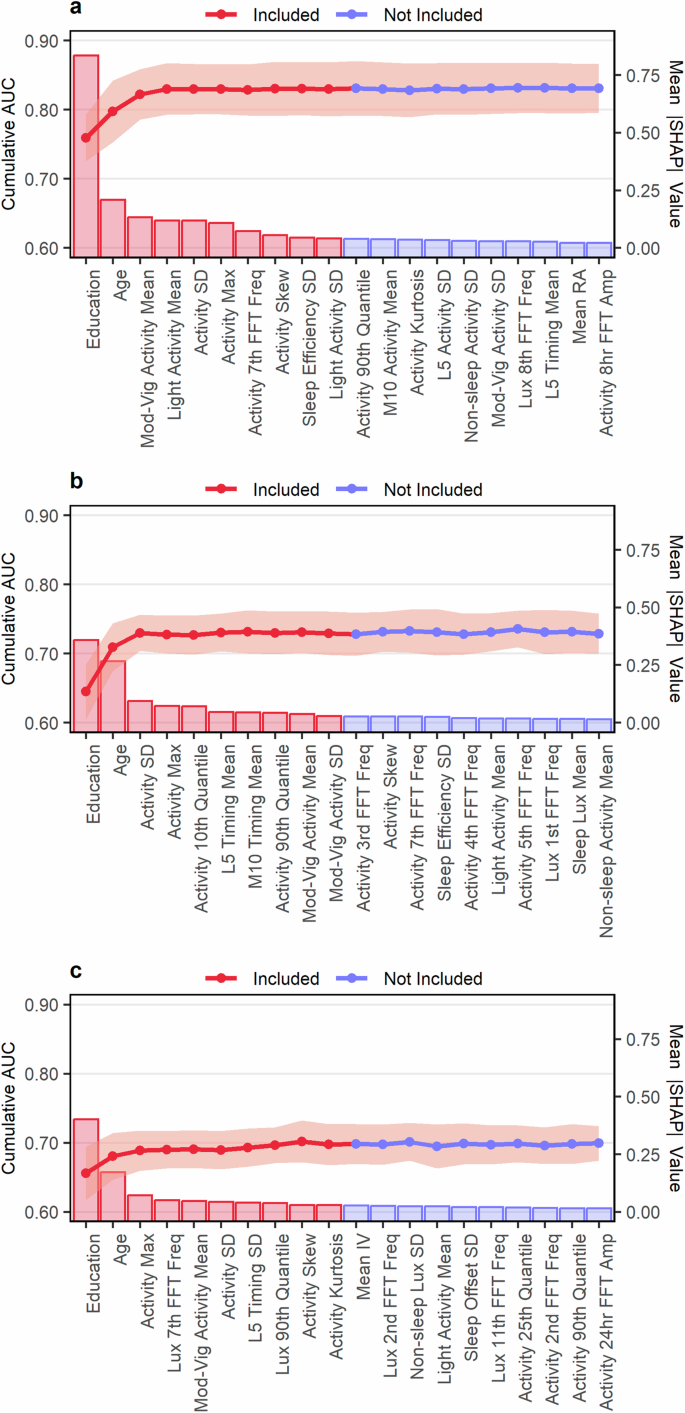
The figure shows the results from the forward feature selection procedure for predicting poor cognitive function based on (a) processing speed, working memory, and attention as measured by the DSST (b) immediate and delayed memory as measured by the CERAD-WL and (c) categorical verbal fluency as measured by the AFT. Bars represent the mean absolute SHAP value for a given feature (right y-axis) and points represent mean validation set AUC from 10-fold cross-validation (left y-axis). Error bars are the mean AUC ± 1 standard deviation. Only the first 20 features are shown. Figures showing the selection procedure across all candidate features can be found in Supplementary Fig. 1.
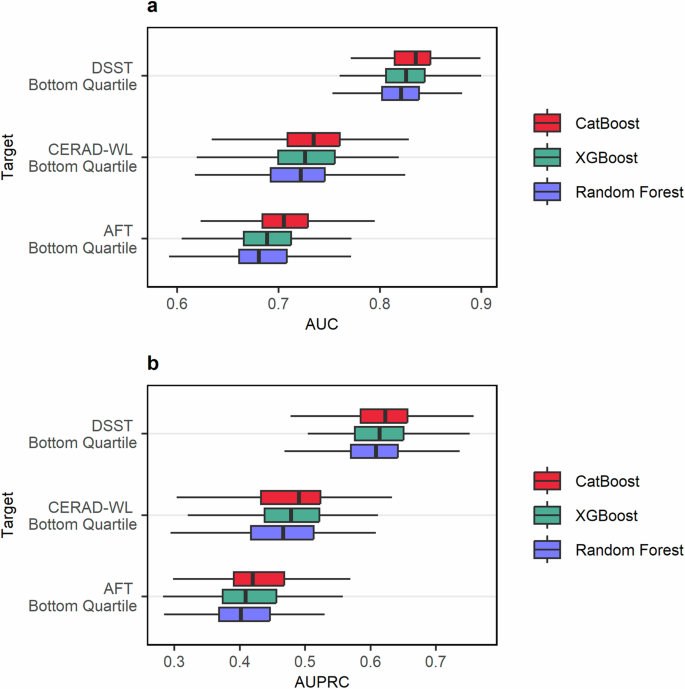
The plot indicates the predictive performance of each model type as evaluated by (a) the AUC and (b) the AUPRC through 20 repeats of 10-fold cross-validation. The bottom quartile on each test was used to categorize individuals as having “poor cognition” in the subdomains assessed by a given test. The DSST assessed processing speed, working memory, and attention. The CERAD-WL assessed immediate and delayed memory. The AFT assessed categorical verbal fluency. A tabular presentation of the results can be found in Supplementary Table 4.
Influence of wearable device features when predicting poor cognition
The contribution of each feature towards the final model predictions across the CatBoost, XGBoost, and Random Forest models was examined using SHapley Additive exPlanations (SHAP) plots. When predicting poor cognition based on the DSST, which measures processing speed, working memory, and attention, we found that lower total activity variability (standard deviation), less time spent in moderate-vigorous activity per day, greater sleep efficiency variability, and lower maximum activity levels all contributed to higher risk predictions for poor cognition (Fig. 4). The influence of activity levels on each model’s predictions was similar when predicting poor cognition based on the CERAD-WL, which assessed immediate and delayed memory, (Fig. 5) and the AFT, which assessed categorical verbal fluency (Fig. 6).
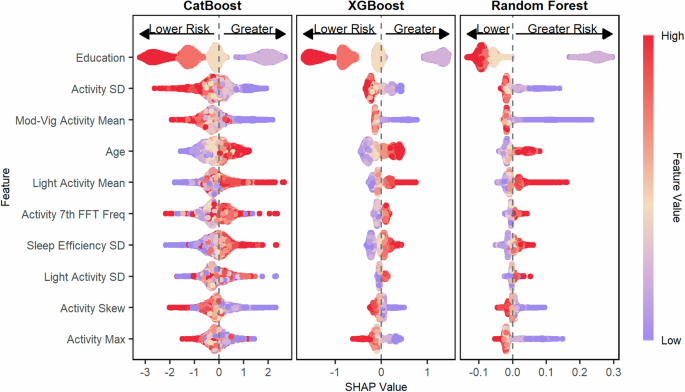
The figure shows the SHAP values for predicting poor processing speed, working memory, and attention as measured by the DSST for the CatBoost model, the XGBoost model, and the Random Forest model. Features are ordered top to bottom from most to least important based on the mean absolute SHAP value of the CatBoost model. Poor cognition was categorized as scores in the bottom quartile on the DSST.
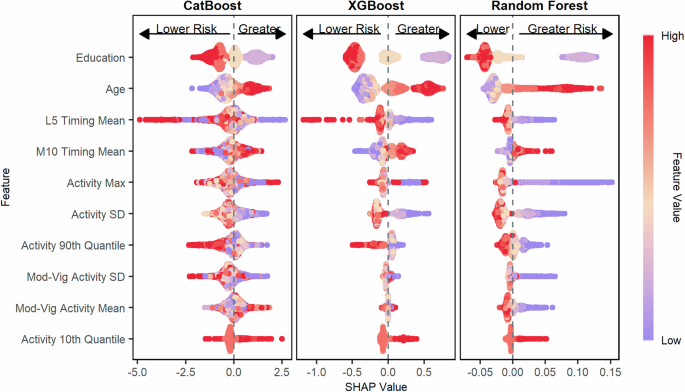
The figure shows the SHAP values for predicting poor immediate and delayed memory as measured by the CERAD-WL for the CatBoost model, the XGBoost model, and the Random Forest model. Features are ordered top to bottom from most to least important based on the mean absolute SHAP value of the CatBoost model. Poor cognition was categorized as scores in the bottom quartile on the CERAD-WL.
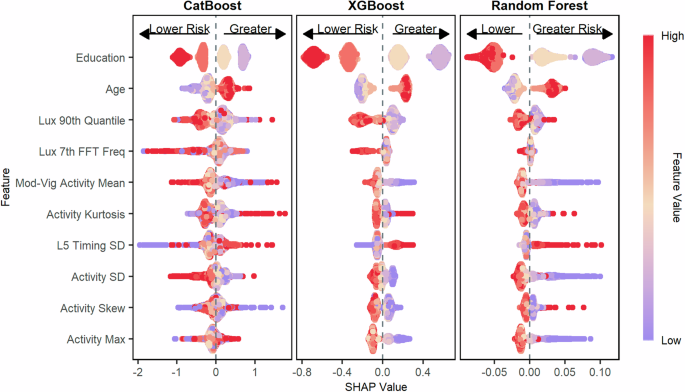
The figure shows the SHAP values for predicting poor categorical verbal fluency as measured by the AFT for the CatBoost model, the XGBoost model, and the Random Forest model. Features are ordered top to bottom from most to least important based on the mean absolute SHAP value of the CatBoost model. Poor cognition was categorized as scores in the bottom quartile on the AFT.
Accelerometer-derived sleep and activity parameters are associated poor cognition based on multiple cognitive tests
Results from association analyses using logistic regression models adjusting for multiple comparisons using the Benjamini-Hochberg procedure showed that higher activity levels during non-sleep periods were univariably associated with better cognition based on categorizations from all three cognitive tests. The strength of associations was generally stronger when cognition was categorized based on the DSST, which assesses processing speed, working memory, and attention, or based on the CERAD-WL, which assesses immediate and delayed memory (Fig. 7). Higher levels of sedentary activity were associated with poor cognition based on the DSST and CERAD-WL in demographics-adjusted models. In fully adjusted models, greater total activity variability was significantly associated with a lower odds of poor cognition based on the DSST (per 1-sd increase, OR: 0.69, 95% CI: 0.60 to 0.79, p < 0.001) as well as the CERAD-WL (per 1-sd increase, OR: 0.78, 95% CI: 0.68 to 0.89, p = 0.006). No significant associations were observed between any derived variables with poor cognition based on the AFT in demographic or fully adjusted models accounting for multiple comparisons. A complete description of all associations can be found in Figs. 7 and 8 as well as Supplementary Tables 8–10.
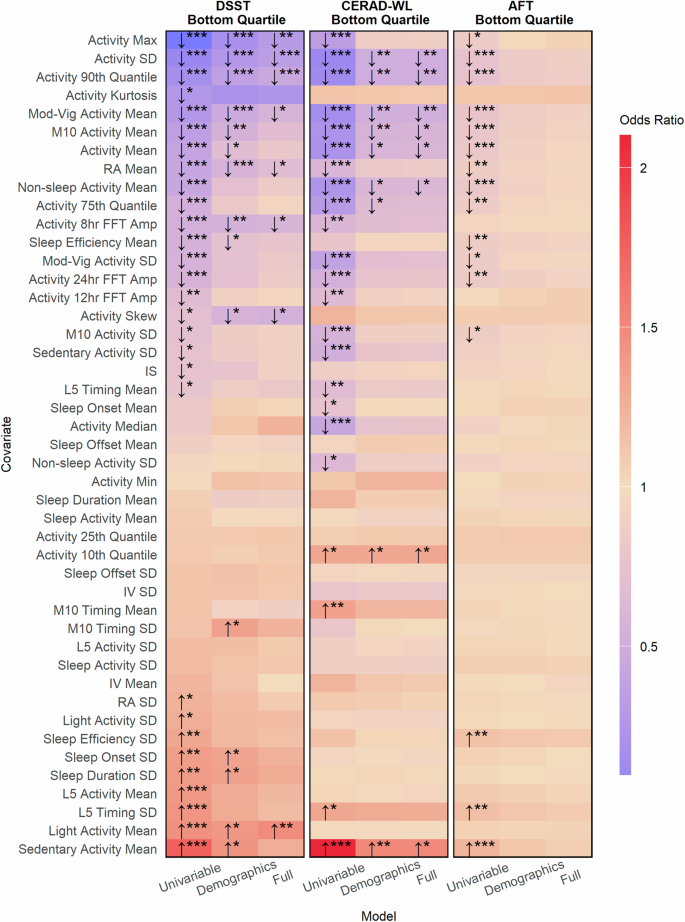
This figure indicates the strength of association between accelerometer derived parameters with poor processing speed, working memory, and attention as measured by the DSST (leftmost panel), poor immediate and delayed memory as measured by the CERAD-WL (middle panel), and poor categorical verbal fluency as measured by the AFT (rightmost panel). Poor cognition was categorized as scores in the bottom quartile on a given test. Arrows indicate whether larger values for a metric are associated with a greater (odds ratio > 1, upward facing arrow) risk of having poor cognition or lower (odds ratio < 1, downward facing arrow) risk of having poor cognition. Stars represent the degree of statistical significance (* < 0.05, ** < 0.01, *** < 0.001) adjusted for multiple comparisons using the Benjamini–Hochberg procedure. Tiles without arrows and stars had no significant associations. Odds ratios are reported per one standard deviation increase.
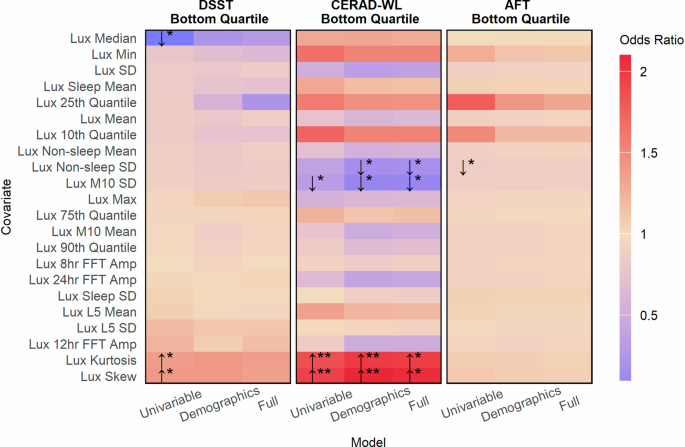
This figure indicates the strength of association between ambient light exposure with poor processing speed, working memory, and attention as measured by the DSST (leftmost panel), poor immediate and delayed memory as measured by the CERAD-WL (middle panel), and poor categorical verbal fluency as measured by the AFT (rightmost panel). Poor cognition was categorized as scores in the bottom quartile on a given test. Arrows indicate whether larger values for an accelerometer metric are associated with a greater (odds ratio > 1, upward facing arrow) risk of having poor cognitive function or lower (odds ratio < 1, downward facing arrow) risk of having poor cognitive function. Stars represent the degree of statistical significance (* < 0.05, ** < 0.01, *** < 0.001) adjusted for multiple comparisons using the Benjamini-Hochberg procedure. Tiles without arrows and stars had no significant association. Odds ratios are reported per one standard deviation increase.
Associations between ambient light exposure and cognition vary across cognitive tests
Additional analyses examining the relationships between ambient light exposure captured using wearable devices with poor cognition revealed varying relationships. No single light exposure metric was associated with poor cognition based on categorizations from all three cognitive tests in univariable, demographic, or fully adjusted models (Fig. 8). Associations between light exposure and poor cognition were generally strongest when cognition was categorized based on immediate and delayed memory as measured by the CERAD-WL. In fully adjusted models, greater light exposure variability was associated with a decreased odds of poor cognition based on the CERAD-WL (per 1-sd increase, OR: 0.85, 95% CI: 0.76, 0.96, p = 0.043) as was greater light exposure variability during M10 periods (per 1-sd increase, OR: 0.84, 95% CI: 0.74, 0.94, p = 0.019). Lastly, both the kurtosis and skew of an individual’s light exposure distribution were associated with greater odds of having poor cognition based on the CERAD-WL. No significant associations were observed between light exposure metrics and poor cognition in fully adjusted models based on the DSST and AFT.
Discussion
In this study, we found that the ability of machine learning models to predict poor cognition using wearable device data, which included both accelerometer data and information that could be collected through a user interface such as age and education, varied across outcomes assessing different subdomains of cognition. More specifically, we found that CatBoost, XGBoost, and Random Forest models performed best when predicting poor processing speed, working memory, and sustained attention as measured by the Digit Symbol Substitution Test compared to predicting poor cognition based on measures of immediate and delayed memory as well as categorical verbal fluency. Our study provides proof-of-concept that age, education, sleep parameters, activity summaries, and light exposure metrics, all of which can be collected in non-clinical settings through a wearable device, could be used to differentiate between older adults with normal versus poor cognition. However, predictive performance varied across cognitive sub-domains, and traditional risk factors (age and education) were found to be the primary drivers of predictive performance. Significant relationships between accelerometer-derived parameters with poor cognition were also identified that could serve as targets for future causal studies seeking to understand how sleep, activity, and circadian rhythms influence cognition.
Each type of machine learning algorithm we evaluated performed best when identifying older adults with poor cognition based on processing speed, working memory, and attention as measured by the Digit Symbol Substitution Test (DSST). The DSST is well-suited to detect changes in cognitive function because it assesses multiple cognitive subdomains sensitive to aging and cognitive decline19, thus, our study indicates that monitoring the processing speed, working memory, and sustained attention of older adults using wearable device data may be a viable alternative to existing monitoring approaches. However, our study additionally highlights the need for caution to be taken when leveraging wearable device data given that predictive ability varied considerably across different cognitive subdomains. Existing evidence supports this call for caution as similar variability was observed in a wearable-based cognition prediction study of older adults in Singapore17 with Mild Cognitive Impairments (MCI). Furthermore, age and education were both significant drivers of predictive performance in our models, suggesting that wearable-based monitoring systems also need to collect information through a user interface in addition to passively collecting accelerometer data. As such, careful consideration will be needed when designing wearable-based cognitive monitoring systems to ensure the target variables in question can be predicted accurately using appropriate data.
A central insight uncovered in this study is the apparent relationship between the standard deviation of total activity levels (hereafter activity variability) with poor cognition across measures of different cognitive subdomains. In association analyses total activity variability exhibited a stronger relationship with poor cognition than average total activity across all cognitive tests (Fig. 7). In the predictive analyses, SHAP plots showed that higher activity variability resulted in lower risk predictions for poor cognition (Figs. 4–6) in the XGBoost, CatBoost, and Random Forest models across all cognitive outcomes. Interestingly, activity variability was highly correlated with average total activity (Pearson’s r: 0.90), yet activity variability was favored during feature selection for the prediction models (Fig. 2). Instead of average total activity, average time spent in moderate-to-vigorous activity was favored during feature selection, indicating that intensity-specific activity averages are more useful for prediction than overall averages. Indeed, intensity-specific activity averages generally showed a stronger association with cognition compared to overall activity averages in our study as well. Future longitudinal accelerometer studies may wish to examine if changes in activity variability predate cognitive decline to determine if activity variability could be used as a marker for future impairments.
Several other activity variability metrics were associated with poor cognition in this study, namely day-to-day variability in moderate-to-vigorous activity and M10 activity. Greater values of each metric were univariably associated with a lower risk of poor cognition based on all cognitive tests. Day-to-day variability in sedentary activity was univariably associated with poor cognition based on the DSST and CERAD-WL. However, more time spent in sedentary activity on average was associated with a greater risk of poor performance on all three cognitive tests, representing a case where the relationships between mean and variability metrics with cognitive test performance were in opposing directions. A wealth of evidence has already linked sedentary activity to greater risks of adverse cognitive outcomes10,20,21, while this study showed older adults with greater sedentary activity variability are less likely be categorized as having poor cognition based on multiple cognitive tests. Our findings likely stem from older adults who are more active on average having greater levels of activity variability. Older adults who are more physically capable have the freedom to pursue activities of varying intensities, whereas less active and less physically capable older adults are bound to more sedentary behaviors. Previous studies have shown that average activity levels are lower among older adults years prior to the development of cognitive impairments and continue to decline as impairments intensify10,20,21, but future studies are needed to determine if changes in activity variability across different levels of intensity follow in-step with declines in average activity.
Measures of ambient light exposure showed limited and varied relationships with cognition in this study, adding to the mixed evidence present in the literature. Some evidence points towards greater outdoor sun exposure having positive associations with cognition22. Other findings have shown that light from technological devices such as TVs negatively impact sleep quality23 and by extension may have negative downstream effects on cognition. As such, the type and timing of light exposure seem to be more important than overall exposure. The ambient light metrics examined in this study could not differentiate between sun exposure and non-sunlight exposure, though we did examine exposure during sleep, non-sleep, M10, and L5 periods. In fully adjusted models, greater variability in ambient light exposure during non-sleep and M10 periods were associated with lower odds of having poor cognition based on immediate and delayed memory (CERAD-WL scores). Again, we observed a high correlation between average and variability metrics for M10 light exposure (Pearson’s r: 0.78) and non-sleep light exposure (Pearson’s r: 0.77) yet neither average metric was associated with poor cognitive test performance in fully adjusted models. Reasons for this discrepancy are unclear, and additional studies are needed to determine if the findings in this study generalize.
Our study has several strengths. We examined the feasibility of using machine learning models trained on survey-based, accelerometer-derived, and ambient light sensor features, all of which can feasibly be collected using wearable devices, to differentiate between older adults with normal and poor cognition based on categorizations derived from multiple cognitive tests. Our work holds implications for the potential viability of developing wearable-based cognitive monitoring systems, primarily by demonstrating that wearable device data (from data obtainable through a user interface, accelerometers, and ambient light sensors) and machine learning can accurately identify older adults with poor cognition as measured by tests assessing processing speed, working memory, and sustained attention. We further derived accelerometer and ambient light exposure metrics for use in both our prediction models and associative analyses. Previously unidentified relationships were established between metrics derived from wearable device data with poor cognition, namely those relating to variability in sleep parameters, activity levels, and ambient light exposure. Such metrics could serve as targets for future causal studies seeking to identify early markers of cognitive decline or additional association analyses seeking to gain a better understanding of the interplay between sleep, activity, and light exposure metrics with cognition among older adults.
This study is not without limitations. First, the cross-sectional nature of the data meant we could not attempt to detect changes in cognition across time and were limited to making predictions at a single timepoint. Cross-sectional data also made examining causal relationships infeasible. Our machine-learning models were also limited by the data that was collected by the NHANES wearable devices. There is emerging evidence that physiological signals such as skin temperature and heart rate variability are associated with cognitive function24,25,26 and are useful for cognition prediction tasks17,27. While some commercially available wearables have the capability to collect such information, the devices used in the NHANES do not. As such, quantifying the full potential of wearable device data to monitor cognition may best be undertaken using wearable devices that can collect data beyond acceleration and ambient light exposure.
Methods
Data sources and study design
The National Health and Nutrition Examination Survey18 (NHANES) is a nationally representative survey of non-institutionalized Americans aged six and older that has been conducted on a yearly basis since 1999. The NHANES utilizes a multistage probability sampling design18 and collects data from roughly 5000 Americans each year. In the 2011-14 NHANES waves participants were asked to wear a wrist-worn physical activity monitor with an embedded accelerometer as much as possible over nine consecutive days, after which the activity data was made available in Monitor-Independent Movement Summary (MIMS28) units. The device also captured ambient light exposure which was made available in minute-level summaries. Over 16,000 NHANES participants wore accelerometers between 2011 and 2014, and participants over the age of 60 were additionally administered three cognitive tests: the Consortium to Establish a Registry for Alzheimer’s Disease Word-Learning subtest (CERAD-WL), Animal Fluency Test (AFT), and Digit Symbol Substitution Test (DSST)29. NHANES received ethics approval from the National Center for Health Statistics Research Ethics Review Board and all participants gave their informed consent. The handling, processing, and analysis of all NHANES data in this study was done in accordance with data access and ethical regulations stipulated by the National Center for Health Statistics.
In this study, we used the 2011–2014 NHANES waves. Our primary objective was to determine if machine learning models trained on wearable device data can differentiate between poor and normal cognition based on scores from multiple tests assessing different cognitive subdomains. We further aimed to quantify associations between sleep, activity, circadian, and ambient light exposure metrics with poor cognition. Lastly, hour-by-hour activity intensities were derived in an effort to understand if older adults with poor cognition exhibit different temporal activity patterns compared to older adults with normal cognition. Participants were excluded if they were under the age of 60, had missingness in their cognitive test data, had less than five days of accelerometer wear time, or if they had less than three nights of valid sleep data. This study is reported following the transparent reporting of a multivariable prediction model for individual prognosis or diagnosis (TRIPOD) statement30 where appropriate (Supplementary Table 11).
Cognitive measures
The NHANES includes three cognitive tests: the Consortium to Establish a Registry for Alzheimer’s Disease Word-Learning subtest (CERAD-WL), which tests immediate and delayed memory, the Animal Fluency Test (AFT), which assesses executive function by quantifying categorical verbal fluency, and the Digit Symbol Substitution Test (DSST), which tests working memory, processing speed, and sustained attention29. The CERAD-WL consists of three rounds of immediate word recall and one round of delayed recall. Ten unrelated words are tested in each round with aggregate scores from all four rounds ranging from zero to forty. During the AFT participants are given one point per animal named in a one-minute period with no upper bound on the maximum number of points. For the DSST each participant is first given a key matching nine numbers to nine symbols. Afterwards, each person is assessed based on how many symbols can be written below 133 numbers based on the provided key in two minutes with total scores ranging from 0 to 133. For all three tests higher scores indicate better cognitive function, and each test has been used in previous studies examining cognition among older adults31,32,33,34. Previously, the Center for Disease Control’s National Center for Health Statistics has used the 25th quantile as a cutoff for low cognitive performance on each test29. As such, poor cognition was categorized using the 25th quantile as a cutoff (20 for the CERAD-WL, 33 for the DSST, and 12 for the AFT) in this study for each test.
Feature derivation
Activity and sleep features were derived from the NHANES accelerometer data. We determined sleep onset and offset times using a publicly available unsupervised Hidden Markov Model (HMM) developed for sleep-wake identification35. The HMM algorithm has previously been validated against gold standard polysomnography, has a sensitivity of over 99% when inferring if a person is sleeping at a given point in time, and has previously been used to analyze the NHANES accelerometer data36,37,38. Four sleep-related metrics were calculated using the HMM algorithm: sleep onset times, sleep offset times, sleep duration, and sleep efficiency. Sleep duration measures the total time spent sleeping whereas sleep efficiency is the ratio of sleep duration over the total time between initial sleep onset and final sleep offset. The average and standard deviation of each sleep metric across all nights of valid sleep data were included as features in this study. To account for the cyclic nature of the time data we used the circular mean and standard deviation39 instead of the arithmetic equivalents when deriving sleep onset and offset features. Next, we calculated each person’s total activity levels across sleep and non-sleep periods, after which the average and standard deviations were calculated and included as features. Activity categorizations were then made where each minute of non-sleep accelerometer data was classified as sedentary (MIMS < 15.9), light (MIMS between 15.9 and 19.6, inclusive), or moderate-to-vigorous (MIMS > 19.6) based on validated cutoffs from prior work40. The average and standard deviation of the proportion of daily time spent in each activity category were then derived and included as features. Non-wear observations were excluded prior to the derivation of the activity metrics.
The second type of wearable device features were derived using statistical and signal processing techniques41. We first calculated several summary statistic features from each participant’s accelerometer data excluding non-wear observations: the mean, median, standard deviation, maximum, minimum, 10th quantile, 25th quantile, 75th quantile, 90th quantile, skewness, kurtosis, and differential entropy. A Fast Fourier Transform (FFT) was then applied to each participant’s acceleration data, from which we used the fifteen frequencies corresponding to the largest fifteen amplitude values as features.
Features related to circadian rhythm analyses were also included in this study42. We first identified the hour in the middle of each person’s least active five-hour (L5) period and most active ten-hour period (M10) each day. The circular average and standard deviation of the L5 and M10 midpoints across the wear period were included as features. Next, we calculated the average and standard deviation of individual activity levels during the L5 and M10 periods. The mean and standard deviation of each person’s relative amplitude (RA) and intraday variability (IV) for their activity data were also derived along with inter-daily stability (IS) of activity levels across the wear period. Finally, we gathered each participant’s 24-, 12-, and 8-hour FFT signal strengths as the final features.
Lastly, features were derived based on each participant’s ambient light exposure, which was also collected by the wearable device in the NHANES waves used in this study. The mean and standard deviation of ambient light exposure during sleep, non-sleep, L5, and M10 period were derived, as were all statistical and signal processing features described previously using each participant’s complete ambient light exposure data.
Feature selection and prediction models
Multiple models were developed to predict poor cognition based on three categorizations spanning multiple cognitive subdomains. One categorization was based on processing speed, working memory, and attention (DSST scores), another based on immediate and delayed memory (CERAD-WL scores), and lastly one based on categorical verbal fluency (AFT scores) respectively. As such, we conducted separate feature selection procedures for all three prediction tasks. The features were selected from a candidate set that included age, education, and all previously described accelerometer derived and ambient light exposure features. Age and education were included because of their known associations with cognitive function, relative ease to collect through an interface on a smart device, and because both features would not require manual updating for repeated cognitive assessments. For comparison purposes we additionally developed models that only included age and education (Supplementary Table 5).
Features for the models were chosen using a forward-selection procedure and CatBoost43, a gradient boosting machine learning algorithm. Gradient boosting algorithms have been shown effective in previous clinical prediction studies44,45, can capture complex nonlinear interactions between features, and provide robust results in the presence of multicollinearity. The features were first ranked from most to least important based on their mean absolute SHapley Additive exPlanation (SHAP) values46 using a CatBoost model containing all candidate features. SHAP values enable model interpretability by quantifying the marginal contribution of a given feature to a model’s final predictions, thereby unveiling both feature importance and how specific values of that feature influence the model’s output. From there, we recursively trained CatBoost models adding one feature at a time from most to least important. Each model was evaluated through 10-fold cross-validation based on the Area Under the Curve (AUC). Feature sets of size ten were chosen for each model as no significant improvements in AUC were observed with the addition of more features.
After the features were selected we developed nine models: one CatBoost, one XGBoost47, and one Random Forest model for predicting poor cognition based all three categorizations of poor cognitive function. Hyperparameters for each model were tuned through 10-fold cross validation using Optuna, an automated hyperparameter optimization framework48. The specifics of the tuning procedure for a single model are as follows. First, we defined a range of possible values for each hyperparameter and chose the Area Under the receiver operating characteristic Curve (AUC) as the performance metric for model evaluation. Next, we ran 200 Optuna trials to find the optimal hyperparameter values. For each trial Optuna suggests hyperparameter values within the prespecified range, a model with the suggested hyperparameters is put through 10-fold cross validation, and the average AUC is calculated from the validation fold predictions. Over many trials the optimization framework learns to suggest hyperparameter values that improve the performance of the model, in our case by maximizing the AUC. For the CatBoost and XGBoost models we tuned the learning rate, number of trees, tree depth, and subsampling done by each tree. For the Random Forest models we tuned the tree depth and maximum number of trees.
Predictive modeling
After the final features and hyperparameters were chosen we evaluated each model through 20-repeats of 10-fold cross-validation, which has been recommended to obtain optimism adjusted performance metrics for clinical prediction models49. Models were assessed based on the Area Under the receiver operating characteristic curve (AUC) and the Area Under the Precision Recall Curve (AUPRC). The AUC was chosen as it is a commonly used metric in clinical prediction studies that quantifies the ability of a model to differentiate between two classes, in this case, normal versus poor cognition based on cognitive test scores. The AUPRC was further included given the imbalanced nature of the data as it captures the ability of a model to predict a positive minority class. AUC scores greater than 0.5 indicate better-than-random predictions whereas AUPRC scores larger than the proportion of the minority class, in our case approximately 0.25, indicate better-than-random predictions. Boxplots were constructed for each model from the 200-validation set performance metrics obtained during repeated cross-validation which were also reported using the median and interquartile range (IQR). During repeat cross-validation missing values were imputed using K-Nearest Neighbors imputation50 with K = 1 on each training and validation set separately. SHAP plots were generated for each of the final models to quantify feature importance and enable explainable predictions. Lastly, a sensitivity analysis was performed where the repeated cross-validation procedure was replicated using complete case data (Supplementary Table 6).
Measuring associations
Associations between accelerometer-derived and ambient light exposure features with poor cognition were examined using logistic regression models. The same target variables used in the predictive analyses were used as outcomes in the association analyses. More precisely, they are in the bottom quartile on each cognitive test. Relevant confounders were gathered for inclusion in adjusted models, namely age, sex, education, household income, marital status, diabetic status, arthritis, depression, whether someone smokes, whether someone drinks alcohol, and heart disease. Depression was derived from responses to the nine-item Patient Health Questionnaire51 (PHQ-9), for which participants with scores greater than 10 were categorized as depressed. Participants were categorized as either current or non-current smokers and drinkers, while arthritis, diabetes, and heart disease were determined using self-reported data.
Associations were examined using complete case data between all accelerometer and ambient light features in univariable, demographic, and fully adjusted models. The demographic models included age, sex, education, household income, and marital status while the fully adjusted models further included depression, diabetes, arthritis, heart disease, whether someone smokes, and whether someone drinks. Odds ratios were reported per one standard deviation increase. p-values were reported adjusting for multiple comparisons for each model type and outcome using the Benjamini–Hochberg procedure.


Responses