Aging modulates the impact of cognitive interference subtypes on dynamic connectivity across a distributed motor network

Introduction
A proposed mechanism of aging is the progressive depletion of reparative molecular processes in conjunction with cumulative tissue damage in response to lifetime use and stress. Such aging-related changes in the brain can contribute to a decline in a wide range of neural processes, including working memory, attention, and motor control1,2,3,4,5,6. Across such cognitive domains, alterations in performance (e.g., increased reaction time and variability) have been consistently identified as a component of aging, though the underlying mechanisms contributing to such decreases in performance are less understood7,8,9. These cognitive changes are thought to reflect structural (e.g., white matter microstructure) and functional (e.g., specialization, overactivation) alterations in a distributed network of brain regions involved in attention, cognitive control, and movement planning and execution4,6,9,10,11,12. Specifically, current models of aging suggest that age-related increases in neural recruitment might be a compensatory mechanism that varies as a function of task complexity and the availability of additional neural resources13,14,15.
There is substantial literature to support these compensatory theories, including findings of increased neural recruitment in the forms of overactivation, increased connectivity, and frontal compensation4,6,13,14,16,17,18,19,20,21. Earlier theories including the Hemispheric Asymmetry Reduction in Older Adults (HAROLD) model, Posterior-Anterior Shift in Aging (PASA) theory, and the Compensation-Related Utilization of Neural Circuits Hypothesis (CRUNCH) provide conceptual frameworks for understanding the increases in neural activity and connectivity that are observed in aging14,18,22. Of note, there are also findings in the literature of decreased activation that have been conceptualized as occipitotemporal sensory deficits (PASA), dedifferentiation (i.e., loss of lateralization, or HAROLD), and neural exhaustion (CRUNCH), among others14,18,22. Though the aforementioned theories incorporate many key elements of underactivation in their aging model, the revised Scaffolding Theory of Aging and Cognition (STAC-r) takes on a more longitudinal perspective of aging in a manner that is compatible with structural, functional, and environmental changes through the lifespan13,17. Specifically, STAC-r adopts a broad approach to characterizing the impact of aging on neurocognitive outcomes, where existing cognitive abilities provide the foundation for the acquisition, refinement, and execution of new skills (for a more comprehensive comparison of models, see Festini et al.13).
Neuroimaging studies using magnetoencephalography (MEG) have identified resting-state and task-positive brain responses involved in basic sensory processing, motor control, attention, and cognitive control that are sensitive to chronological and biological measures of aging5,6,19,20,23,24,25,26. For example, previous electrophysiological studies of cognitive control have identified that aging affects the neural signatures associated with resolution of two well-known cognitive interference subtypes (i.e., flanker and Simon), with aging effects emerging in occipital, frontoparietal, and motor regions20,27,28,29,30,31,32,33,34. Furthermore, some of these regions appear to exhibit age-related changes that are spectrally specific (i.e., beta and gamma), including compensatory increases in activation or connectivity in line with existing aging theories4,6,20,28. However, these findings primarily reflect the cognitive components of the task and there is a relative dearth of work examining age-related changes in the motor response dynamics20,28,35. Previous literature has identified the impact of visual interference on the neural dynamics of motor function, including response amplitude and peak frequency29,31,36. Furthermore, the oscillatory power of these neural responses in various regions of a distributed motor network was sensitive to the type and degree of cognitive interference31. Thus, examining age-related changes throughout extended regions of the fronto-parietal and motor networks using inter-regional connectivity analyses may contribute critical new evidence on the network level dynamics that underlie declines in motor control.
Herein, we analyzed high-density MEG data in 72 healthy participants (age range: 28-63 years) who completed a modified version of the multisource interference task (MSIT) to investigate the potential for distinct and overlapping connectivity profiles of motor control in the context of stimulus-stimulus, stimulus-response, and multisource interference subtypes in healthy aging30,31,37. We hypothesized that: (1) consistent with the STAC-r model, we would primarily see age-related increases in connectivity between higher-order regions (e.g., prefrontal and parietal cortices) and the motor cortex, (2) that these differences would be specific to interference subtype and intensity (i.e., flanker, Simon, and multisource), and (3) that despite the recruitment of additional neural resources to meet task demands, behavioral performance would worsen with age.
Results
Behavioral Performance
The MSIT behavioral data were subjected to a repeated measures ANCOVA analysis with age as a continuous variable of interest and condition as a four-level within-subject. Our results indicated significant main effects of interference condition (F(3,69) = 47.18, p < 0.001) and age (F(1,69) = 9.32, p = .003) on reaction time. Regardless of age, participants were significantly slower to respond during interference trials relative to the control trials (Fig. 1B). Specifically, participants were slower to respond during Simon (t(71) = −19.57, p < 0.001), flanker (t(71) = −22.18, p < 0.001), and multisource (t(71) = −36.68, p < .001) conditions compared to the control condition. Furthermore, participants were significantly slower in their responses to the multisource condition compared to both the Simon (t(71) = 16.83, p < .001) and flanker (t(71) = 26.42, p < 0.001) conditions, and were also slower to respond during flanker trials relative to Simon trials (t(71) = 9.58, p < 0.001). In addition, age was positively correlated with reaction time across all interference conditions (r = .360, p = .001) and the age-by-condition interaction effect was not significant for reaction time. Accuracy was not statistically related to interference condition, age, or the interaction effect. Finally, a repeated measures ANCOVA was conducted to compare the effects of multisource interference to the additive model (Simon + flanker interference) to test for potential age-related superadditivity effects. The interference effect in the multisource condition (i.e., simultaneous presentation of the two interference sources) was greater than the summed interference effects from the flanker and Simon conditions (F(1, 70) = 4.28, p = 0.042; Fig. 1C), but neither the main effect of age (F(1, 70) = .36, p = .553) nor the interaction (F(1, 70) = 0.29, p = 0.589) was significant for the superadditivity reaction time effect.

A Each trial of the multisource inference task began with a central fixation presented for 2000–2400 ms, which was replaced by a vertically centered horizontal row of three equally spaced integers between 0 and 3. Two of these integers were always identical (task irrelevant) and the third was different (task relevant). The presentation of the integer stimuli lasted for 1500 ms. Participants were instructed to indicate the numerical identity (not the spatial location) of the “odd-number-out” by using their index, middle, and ring finger for the integers 1, 2, and 3, respectively, using a button box. Using these stimuli, four interference conditions were possible: (1) control (no interference), (2) Simon (stimulus-response interference), (3) flanker (stimulus–stimulus interference), and (4) multisource. B The main effect of interference condition was significant, with each condition differing from the control condition in a stair-step pattern. Reaction time differences relative to the control condition are displayed on the y-axis with interference type on the x-axis. C Behavioral results from the superadditivity model, with reaction time differences relative to the control condition on the y-axis and inference type (i.e., multisource and additive) on the x-axis. The additive model reflects Simon + flanker interference effects. Datapoints connected by lines indicate data from individual participants. *p < 0.05, **p < 0.001.
MEG sensor and source level oscillatory analysis
We observed strong peri-movement beta and gamma oscillations in MEG sensors near the sensorimotor cortices (Fig. 2). In particular, a significant decrease in power from baseline (i.e., a desynchronization) was observed in the beta range (16 to 26 Hz; −400 to 100 ms, p < 0.001, corrected), while a strong increase in power relative to the baseline (i.e., a synchronization) was observed in the gamma range (68 to 76 Hz; −50 to 100 ms, p < 0.001, corrected). These significant time-frequency windows were imaged using a beamformer and the resulting whole-brain maps per response were averaged across all participants and interference conditions. The resulting maps indicated that the beta and gamma responses originated from tissue near the hand-knob region of the precentral gyrus, which has been repeatedly linked to motor representations of the hand38,39,40. The beta responses were observed bilaterally, while the gamma oscillations were strongly lateralized to the left hemisphere. Note that, since the post-movement beta rebound response occurred after the movement offset and we found reaction time differences between our interference conditions, we elected not to examine this response since any neural findings would likely be confounded by behavioral differences.
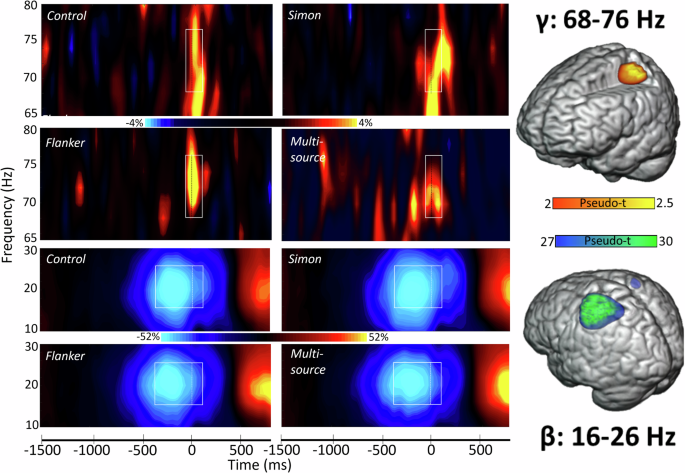
(Left): The grand-averaged time-frequency representations of sensor-level neural responses that were identified using our two-stage cluster-based permutation analysis (see Methods section) are highlighted using white boundary boxes, with the gamma oscillatory responses per condition shown in the top half of the figure and the beta oscillatory responses shown in the bottom half. Within each spectrogram, frequency (in Hz) appears on the y-axis and time (in ms) is denoted on the x-axis, with the dotted vertical line within each boundary box indicating the motor response at time zero. The color scale bar for percent change from baseline is displayed between the top two rows for the gamma plots and the bottom two rows for the beta plots. Each spectrogram shows data from one gradiometer that was representative of the neural response in sensors near sensorimotor regions. Data are presented separately for each task condition (i.e., control, Simon, flanker and multisource) and have been averaged across all participants per condition. (Right): The grand-averaged, whole-brain beamformer image for each response (beta and gamma). These beta and gamma oscillatory maps have been grand-averaged across all interference conditions and participants, with the color scale bar in the middle denoting response amplitude in pseudo-t units.
Beta and gamma cortico-cortical coherence mapping
To probe age-related changes in motor network connectivity underlying the three types of cognitive interference, the peak voxels in the motor-related beta and gamma oscillatory maps (Fig. 2) were used as the seeds for whole-brain cortico-cortical coherence analyses (see Methods: MEG Source Imaging and Statistics). For the left primary motor cortex (M1) seed during motor planning and execution (−400 to 100 ms), we observed age-dependent increases in beta connectivity with right occipital (r = 0.520; p < 0.0005), left temporal (r = 0.454; p < 0.0005), and right parietal cortices (r = 0.482, p < 0.0005) for flanker (Fig. 3A), Simon (Fig. 3B), and multisource interference (Fig. 3C), respectively, relative to the control condition.
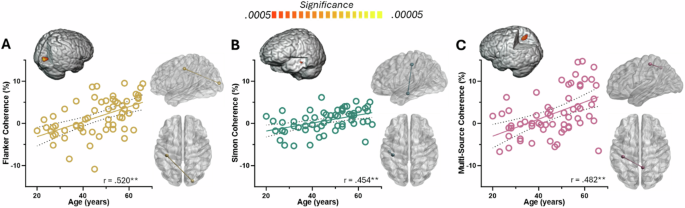
In each panel, the scatterplot shows age on the x-axis in years and percent change in connectivity on the y-axis, with the 3D rendition above the scatterplot showing the target cluster and the glass brains to the right showing the pathway. A Beta flanker interference (flanker-control) coherence maps revealed increased connectivity with increasing age between left M1 and the right occipital cortices during motor planning and performance. B Connectivity also increased with age between left M1 and left temporal cortices during the Simon interference condition. C Similarly, beta connectivity between left M1 and right parietal increased with age during motor planning and performance in the multisource interference condition. **p < 0.0005.
For the right M1 seed, stronger beta connectivity with increasing age was observed with right occipital (r = 0.537, p < 0.0005) and left parietal (r = 0.535, p < 0.0005) regions for flanker (Fig. 4A) and Simon (Fig. 4B) interference conditions, respectively. Further, the superadditivity model revealed an age-related decrease in right M1-left premotor beta coherence (r = -0.434, p < 0.0005; Fig. 4C).
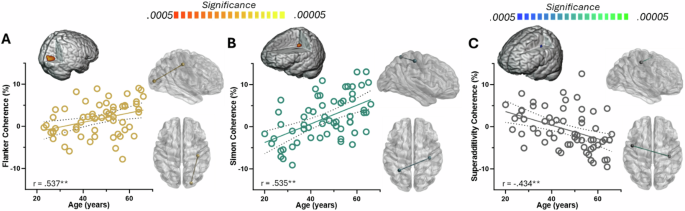
Within each panel, the scatterplot shows age on the x-axis in years and percent change in connectivity on the y-axis, with the 3D rendition above the scatterplot showing the target cluster and the glass brains to the right showing the pathway. A Beta interference coherence maps showed stronger connectivity between right M1 and right occipital cortices with increasing age during flanker interference. B Similarly, during Simon interference, connectivity between right M1 and left parietal regions increased with advancing age. C The superadditive effect of simultaneously presented interference subtypes indicated weaker beta connectivity with increasing age between right M1 and left premotor cortices with increasing age. **p < 0.0005.
Finally, in the gamma range, we observed increasing connectivity between left M1 and right prefrontal cortices with increasing age during the flanker interference condition (r = 0.490, p < 0.0005; Fig. 5).
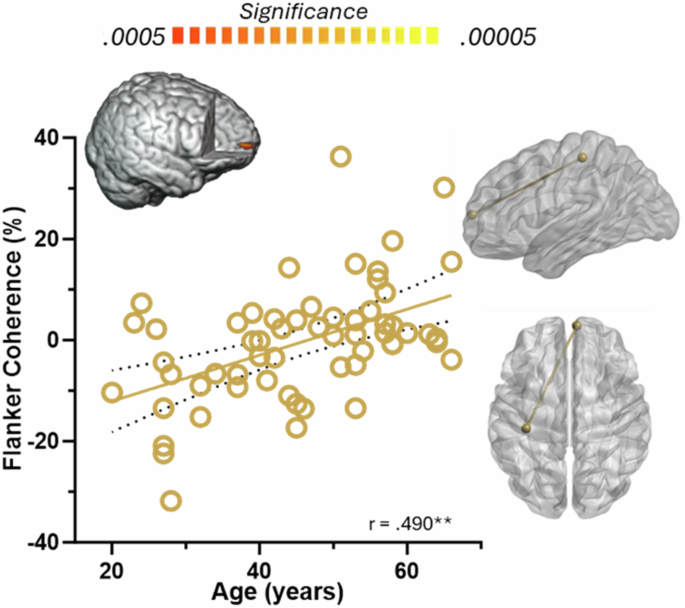
Layout of figure and axes match those in Figs. 3 and 4. The gamma coherence between left M1 and right prefrontal cortices during movement execution was found to increase linearly as a function of age for flanker interference. Glass brains on the right show the pathway corresponding to the data on the left. **p < 0.0005.
Discussion
In this study, we utilized advanced dynamic neuroimaging techniques coupled with a multisource interference task to probe age-related changes in movement-related connectivity profiles during different types of cognitive interference30,31,37,41. Behaviorally, participants exhibited a stepwise increase in reaction time (control < Simon < flanker < multisource) that has been demonstrated in prior work28,31. Furthermore, age was significantly correlated with overall reaction time regardless of interference condition, such that older participants were slower to respond correctly. Our primary neural findings include age-related increases in connectivity from the left and right M1 cortices to a distributed fronto-parieto-motor network serving interference resolution, motor planning, and motor execution. Interestingly, the brain regions involved in these age-related network changes were specific to the type of interference (i.e., flanker, Simon, multisource), mirroring prior work showing regional differences in response amplitude based on the interference type across extended attention and motor networks28,31,35,42. Taken together, our key findings suggest that a more widespread functional contribution to support motor control during motor planning and execution in aging does not engender commensurate improvements in behavioral performance, perhaps reflecting the exhaustion of neural pools both in basic sensory regions and higher-order processing, which would support the revised scaffolding theory of aging and cognition (STAC-r) model14,16,17. Below, we discuss the implications of these novel age-related changes in the neural connectivity serving motor control and interference resolution in healthy aging.
We identified age-related increases in connectivity between the bilateral motor cortices and the right occipital (beta), as well as left M1 and right prefrontal (gamma), cortices during motor planning and execution pertaining to resolution of stimulus-stimulus interference (i.e., flanker32;). The flanker task has previously been shown to engage elements of top-down cognitive control systems, including the prefrontal cortex for interference resolution and response selection that contributes to successful task completion28,43,44,45,46. Interestingly, while the M1 cortex contralateral to movement is neuroanatomically linked with the key pathways for movement, increasing connectivity with age in the right occipital cortex was observed with both the left (contralateral) and right (ipsilateral) motor cortices. Involvement of ipsilateral neural resources may be a candidate mechanism of compensatory neural processing in the context of inefficiencies and/or exhaustion of contralateral base neural systems that are employed for task completion. Indeed, previous work has demonstrated a shift from a lateralized to more diffuse and/or bilateral recruitment of neural resources with aging in motor and cognitive domains, indicating the sensitivity of a wide range of neural processes to aging and compensatory mechanisms4,47,48. While these studies have focused on alterations in neural power, the findings in the present work indicate that connectivity shifts with age may also support such compensatory mechanisms. Furthermore, we found that connectivity in the gamma range between the prefrontal cortex and left M1 was positively correlated with age. Previous literature has shown that various dimensions of the oscillatory gamma response (e.g., power, frequency) correlate with movement kinematics (e.g., timing, force applied, movement uncertainty), as well as task complexity and behavior29,31,36,49,50,51,52. Interestingly, age-related gamma connectivity changes were specific to the flanker task, indicating that gamma oscillations may be particularly sensitive to stimulus-stimulus interference35. Taken together, this suggests that stimulus-stimulus interference prompts older individuals to rely more heavily on neural resources associated with visual processing and top-down attention modulation than younger individuals during movement planning and execution.
During completion of the Simon task, we observed increased beta connectivity between the M1 cortices and the temporal cortex. The temporal cortex is thought to be a critical region for the convergence of visual and motor-related information (specifically the occipitotemporal cortex), and has been shown to be sensitive to beta frequency dynamics related to movement planning53,54. Therefore, successful completion of the Simon task may require additional neural resources related to spatial organization of visual stimuli, as well as movement planning and production. In addition, connectivity between M1 and parietal cortices was positively correlated with age in the beta band during completion of the Simon and multisource conditions. This is consistent with prior work investigating the neural dynamics underlying Simon task performance, which has identified frequency-specific changes in oscillatory power in frontal and parietal regions28,31,34,55. Our findings suggest that resolution of this stimulus-response interference may require increased reliance on the parietal and temporal cortices for adequate relational mapping of task features in the presence of spatial incompatibility between the stimulus and response location42,55,56.
While we broadly observed age-related increases in fronto-parieto-motor connectivity serving interference resolution, the beta superadditivity model revealed an age-related beta connectivity decrease between right M1 and left premotor cortices when comparing the interference effect of the multisource and the additive (i.e., flanker + Simon) conditions. This finding may reflect the ability of additional neural resources to be engaged by older individuals to accomplish goals (i.e., task condition in this case) with relatively low load, while the same individuals may exhibit neural exhaustion when shared neural resources are overtaxed13,15. Furthermore, recent work by Arif et. al. demonstrates both age-related increases and decreases in connectivity profiles related to cognitive control, alluding to seemingly disparate, though theoretically compatible, task, region, and construct specific changes observed in the literature4,13,14,20,28,57,58,59.
These findings contribute to the growing body of work examining contemporary theories of aging (i.e., STAC-r) from a neural oscillatory perspective. Building from the novel findings of this investigation, there are opportunities to further our knowledge of aging related compensatory adaptations in neural function. Though our analyses focus on the functional changes seen with aging, the full STAC-r model adopts a longitudinal position to examine structural, functional, and environmental factors simultaneously13. Future neuroimaging research could adopt a longitudinal modeling approach to probe subtle differences in within-participant trajectories, as well as between-participant differences in these trajectories. Furthermore, future analyses examining the heterogeneity of developmental and aging trajectories (e.g., latent growth curve modeling), as well as cross-sectional connectivity profiles (e.g., mixture modeling) may elucidate unique subgroups within healthy aging samples. Finally, there are various factors associated with healthy aging (e.g., arthritis, pain with movement) that have been linked to alterations in reaction time. Importantly, while none of the participants in this study were diagnosed with significant neurodegenerative or movement disorders (e.g., parkinsonism, intention tremor, bradykinesia) that would significantly impact reaction time or movement kinematics, we did not screen for severe arthritis or related conditions and future work should consider such factors and potentially incorporate more movement related measures to better dissociate changes in movement dynamics that are due to healthy aging from other pathological processes. While such factors are unlikely to affect the strength of the interference effects reported here (i.e., since these are derived per individual by subtracting the reaction time of the control condition), incorporating them into the overall model would lead to a deeper understanding. To close, this is one of the first studies to examine the impact of healthy aging on neural dynamics of motor planning and execution related to resolution of multiple interference subtypes. Our novel findings broadly suggest the exhaustion of age-related compensatory adaptations in the fronto-parieto-motor network in instances of higher cognitive interference demands.
Methods
The current study is a comprehensive re-analysis of data reported in a previous manuscript35. The neural data analyses employed in the current study differ considerably from the previous work, and none of the neural responses reported here were examined in that study. Specifically, the prior study identified brain regions where the power of motor-related oscillations sensitive to interference varied with age, while the current study examines how aging affects multispectral connectivity across the neural oscillatory networks serving motor control during different types of interference resolution.
Participants
Seventy-two healthy adults with a mean age of 45.70 years (range: 28–63 years; see Table 1) who had normal or corrected-to-normal vision were enrolled in this study. Participants had an average of 16.28 years of education (SD: 2.12 years) and all completed the NIH Cognitive Toolbox to assess current cognitive function60,61,62,63. Scores on each Toolbox assessment were converted to demographically corrected t-scores with a mean of 100 and a standard deviation of 15. Exclusionary criteria included any neurological or psychiatric disorder, any medical illness affecting CNS function (e.g., HIV/AIDS, lupus), history of head trauma, current substance use, and the MEG laboratory’s standard exclusion criteria (e.g., ferromagnetic implants). A full description of the study was given to all participants, followed by written informed consent. All experimental procedures adhered to the guidelines provided by the University of Nebraska Medical Center’s Institutional Review Board.
MEG experimental paradigm
A modified version of the multisource interference task30,31,37,41 was used to probe cognitive interference effects on motor control (Fig. 1A). Each trial began with a central fixation cross presented for 2200 ms ( ± 200 ms), which was replaced by a horizontal row of three equally-spaced, vertically centered integers between 0 and 3. These integers were presented for 1500 ms. Two of the numbers were always identical (i.e., task-irrelevant) whereas the third was different (i.e., task-relevant). Prior to beginning the task, participants were given a five-finger right-handed button pad and instructed that the index, middle, and ring finger locations corresponded to the integers 1, 2, and 3, respectively. They were instructed to indicate the “odd number-out” by pressing the button corresponding to its numerical identity (and not its spatial location) as soon as they can. Using these stimuli, four interference conditions were possible: (1) control (no interference; i.e., 1 0 0, 0 2 0, etc.), (2) Simon (stimulus-response interference; i.e., 0 1 0, 0 0 1, etc.), (3) flanker (stimulus-stimulus interference; i.e., 1 2 2, 1 2 1, etc.), and (4) multisource (both stimulus-response and stimulus–stimulus interference; i.e., 2 1 2, 3 1 3, 2 2 1, etc.). The trial types and responses were pseudorandomized so that no interference condition nor any response was repeated more than twice in a row. Each interference condition consisted of 100 trials, for a grand total of 400 trials, and a total recording time of ∼24 min. Custom stimuli were programmed in Matlab (Mathworks, Inc.) using the Psychophysics Toolbox Version 364 and back-projected 1.99° (horizontally) and 1.48° (vertically) at an approximate distance of 1.07 m onto a nonmagnetic screen.
MEG data acquisition
All recordings were conducted in a one-layer magnetically shielded room with active shielding engaged for environmental noise compensation. With an acquisition bandwidth of 0.1–330 Hz, neuromagnetic responses were sampled continuously at 1 kHz using a MEGIN Vectorview MEG system (Helsinki, Finland) with 306 sensors, including 204 planar gradiometers and 102 magnetometers. During data acquisition, participants were monitored via real-time audio-visual feeds from inside the shielded room. Each MEG dataset was individually corrected for head motion and subjected to noise reduction using the signal space separation method with a temporal extension65.
Structural MRI processing and MEG co-registration
Prior to MEG measurement, four coils were attached to the subject’s head and localized, together with the three fiducial points and scalp surface, with a 3-D digitizer (Fastrak, Polhemus Navigator Sciences, Colchester, VT, USA). Once participants were positioned for MEG recording, an electric current with a unique frequency label (e.g., 322 Hz) was fed to each coil, which induced a measurable magnetic field enabling the coil to be localized in reference to the sensors. Since coil locations were also known with respect to head coordinates, all MEG measurements could be transformed into a common coordinate system. With this coordinate system, each participant’s MEG data were co-registered with their T1-weighted structural MRI prior to source space analysis using BESA MRI (Version 2.0). Structural T1-weighted MRI images were acquired using a Siemens Prisma 3-Tesla MRI scanner with a 64-channel head coil and a magnetization-prepared 180 degrees radio-frequency pulses and rapid gradient-echo (MP-RAGE) sequence with the following parameters: TR = 2300 ms; TE = 2.98 ms; flip angle = 9°; FOV = 256 mm; slice thickness = 1 mm (no gap); voxel size = 1 × 1 × 1 mm. These data were aligned parallel to the anterior and posterior commissures and transformed into standardized space. Following source analysis (i.e., beamforming), each subject’s functional MEG images were also transformed into standardized space using the transform that was previously applied to the structural MRI volume and spatially resampled.
MEG preprocessing, time-frequency transformation, and sensor-level statistics
Eye blinks and cardiac artifacts were removed from the data using signal space projection (SSP), which was accounted for during source reconstruction66. The continuous magnetic time series was then divided into 3500 ms epochs, with movement onset as time zero and the baseline extending from −1600 to −1100 ms prior to movement (i.e., button press). Epochs containing artifacts were removed based on a fixed threshold method, supplemented with visual inspection. In brief, for each individual, the distribution of amplitude and gradient values across all trials were computed, and those trials containing the highest amplitude and/or gradient values relative to this distribution were rejected by selecting a threshold that excluded extreme values. Importantly, these thresholds were set individually for each participant, as inter-individual differences in variables such as head size and proximity to the sensors strongly affect MEG signal amplitude. An average amplitude threshold of 1282.29 (SD = 263.47) fT/cm and an average gradient threshold of 263.47 (SD = 124.78) fT/(cm*ms) were used to reject artifacts. Across the sample, an average of 362 (SD = 22) trials per participant were used for further analysis. To ensure there were no systematic differences in the number of trials per participant, an ANCOVA was run, and this showed no significant main effect of condition, age, or their interaction, on the number of trials used (all p’s > 0.05).
Artifact-free epochs were transformed into the time-frequency domain using complex demodulation67, with a time/frequency resolution of 2 Hz/25 ms and a bandwidth of 4–100 Hz. The resulting spectral power estimations per sensor were averaged over trials to generate time-frequency plots of mean spectral density. These sensor-level data were normalized per time-frequency bin using the respective bin’s baseline power, which was calculated as the mean power during the -1600 to -1100 ms baseline period. The specific time-frequency windows used for source reconstruction were determined by statistical analysis of the sensor-level spectrograms across all participants using the entire array of 204 gradiometers. Briefly, each data point in the spectrogram was initially evaluated using a mass univariate approach based on the general linear model. To reduce the risk of false-positive results while maintaining reasonable sensitivity, a 2-stage procedure was followed to control for Type-1 error. In the first stage, two-tailed paired-sample t-tests against baseline were conducted on each data point, and the output spectrogram of t-values was thresholded at p < 0.05 to define time-frequency bins containing potentially significant oscillatory deviations across all participants. In stage two, time-frequency bins that survived the threshold were clustered with temporally and/or spectrally neighboring bins that were also above the threshold (p < 0.05), and a cluster value was derived by summing the t-values of all data points in the cluster. Nonparametric permutation testing was then used to derive a distribution of cluster values, and the significance level of the observed clusters (from stage 1) were tested directly using this distribution68,69. For each comparison, 1000 permutations were computed. Based on these analyses, the time-frequency windows that contained significant oscillatory events across all participants and conditions were subjected to the beamforming analysis. For further details on our data processing pipeline, see Ref. 70.
MEG source imaging and statistics
Oscillatory neural responses were imaged using the dynamic imaging of coherent sources (DICS) beamformer71, which applies spatial filters in the time-frequency domain to calculate voxel-wise source power for the entire brain volume. The single images were derived from the cross-spectral densities of all combinations of MEG gradiometers averaged over the time-frequency range of interest and the solution of the forward problem for each location on a grid specified by input voxel space. Following convention, we computed noise-normalized source power for each voxel per participant using active (i.e., task) and passive (i.e., baseline) periods of equal duration and bandwidth72 at a resolution of 4.0 × 4.0 × 4.0 mm. Such images are typically referred to as pseudo-t maps, with units (pseudo-t) that reflect noise-normalized power differences (i.e., active versus passive) per voxel. MEG preprocessing and imaging used the Brain Electrical Source Analysis (BESA V7) software. To assess the neuroanatomical basis of the significant oscillatory responses identified through the sensor-level analysis, mean whole-brain maps were computed across all interference conditions and participants for the selected time-frequency windows.
To study the underlying cortico-cortical interactions, peak voxels in the grand-averaged maps were used as seeds for the calculation of a coherence beamformer using the DICS approach71. These images represent the voxel-wise coherence with the identified reference or seed voxel. For this analysis, we first performed a voxel-wise subtraction of the control condition coherence map from each of the three interference condition coherence maps for each participant and per time-frequency component. This produced participant-level whole-brain coherence maps representing the effect of interference for each of the Simon, flanker, and multisource conditions. Interestingly, previous work has demonstrated a “superadditive” effect, where the neural and behavioral effects of simultaneous interference presentation (i.e., multisource) is greater than the sum of the Simon and flanker interference effects when they were presented in isolation30. Given this, to investigate the potential for superadditivity of multisource interference on neural coherence, the voxel-wise coherence values of the Simon and flanker interference maps were summed to produce a whole-brain map (per participant, per neural response), which was then subtracted from the multisource coherence map. Finally, to assess the impact of chronological age, these coherence maps were subjected to whole-brain voxel-wise correlation analyses with age as the covariate of interest. Importantly to account for the confounding effects of power on coherence, both seed and source power were included in the whole-brain age-correlation models as covariates of no interest73,74. To account for multiple comparisons, an initial significance threshold of p < 0.0005 was used for the identification of significant clusters in these whole-brain correlational maps, accompanied with a cluster (k) threshold of at least 6 contiguous voxels (i.e., >350 mm3) based on the theory of Gaussian random fields75,76,77. Connectivity values were extracted from significant clusters in the whole-brain correlation maps, and any values ± 2.5 SD from the mean were considered outliers and removed.
Responses