Mapping computational cognitive profiles of aging to dissociable brain and sociodemographic factors

Introduction
Cognitive decline is a robust feature of healthy aging1,2. Subserving this is extensive age-related deterioration in brain regions associated with executive function, cognitive control, orientation, and motivation, namely in the fronto-temporal and fronto-parietal networks, the cerebellum, and striatum3,4. However, older adults do not necessarily show decline to the same extent or in the same ways. Prior research has unveiled groups of people who can maintain their cognitive abilities well into older age5 and groups of ‘superagers’ who display superior cognitive performance (i.e., showing scores equivalent to individuals 20–30 years younger) and significantly reduced atrophy of grey matter6. While individual differences exist, different cognitive faculties also generally decline at different rates; cognitive flexibility (the ability to adapt attention to different tasks or strategies) and response inhibition (the ability to inhibit a pre-potent motor response) show a steep reduction in older age compared to other functions (e.g., planning7, verbal fluency2,7, crystallised intelligence2, and recognition and procedural memory8), and this is significantly linked to global cognitive decline and dementia risk7.
Studies assessing age-related cognitive decline typically use omnibus metrics to categorise cognition9,10. This makes it difficult to obtain well-defined profiles of cognition beyond simplistic classifications of ‘good’ and ‘bad’ performers. Indeed, patterns of cognitive decline may differ between individuals. Moreover, executive functions such as cognitive flexibility and inhibition are complex, with multiple cognitive processes underlying them11,12,13,14.
To address this, modern research utilises computational modelling techniques to probe specific mechanisms driving these broad cognitive functions15. A computational model known as the ‘drift-diffusion model’ has elucidated that poor performance on perceptual decision-making tasks (like response inhibition tasks) may be attributed to slow non-decision times (time spent with sensory processing or executing motor actions), inefficient accumulation of evidence needed to make a decision, or over-valuing speed over accuracy16,17,18. This technique has been useful in characterising older adults as showing more cautious decision-making, longer non-decision times19 and impaired accumulation of evidence under certain contexts20 compared to younger adults. Another oft-used computational model is the reinforcement learning model, which assesses how subjects learn to maximise reward from the feedback over time21. When the model is fit to data from tasks requiring feedback learning, older adults tend to show reduced learning rates22, meaning they do not adapt their behaviour to changes in feedback as quickly as younger adults. This is congruent with older adults showing reduced fronto-striatal activity signalling rewarding feedback in a functional neuroimaging study23.
Hence, computational modelling improves the sensitivity of cognitive profiling as it fractionates complex functions into component processes. These processes can then be used to inform heterogeneity in the cognitive functioning of older adults. In turn, using clustering methods to decipher how distinct cognitive processes group together and interact with each other enhances the specificity and decipherability of latent profiles. This computational-clustering approach has been successfully adopted in research assessing cognitive dimensions related to psychiatric symptomatology24,25 and political ideology26,27 but hitherto has not been used to interrogate cognition in older age.
Characterising cognitive dimensions in older age allows for the delineation of factors predicting such dimensions. Brain structural integrity is an established indicator of cognitive performance6,28, but it is uncertain whether structural deterioration patterns correspond to distinct cognitive profiles. A newer method of characterising brain health is known as ‘brain age’, which refers to structural brain-based age prediction using machine learning29. Research on established Western cohorts (e.g., the Lothian Birth Cohort30) has identified that having a predicted brain age older than one’s chronological age is associated with functional and cognitive impairment in late-life31. Accelerated brain age relative to actual age is also associated with declines in global cognition in childhood and adulthood32, suggesting that elevated brain age and its deleterious effects are apparent across the lifespan. Hitherto, associations between cognition and brain age have been largely non-specific (with few exceptions33), despite the potential clinical advantages to unearthing cognitive signatures that serve as markers for advanced brain aging.
Other than brain structure, research using large and/or longitudinal datasets has thus far characterised multitudinous sociodemographic and lifestyle variables that contribute to healthy cognition in older age5,6,34,35,36,37,38,39,40,41,42,43. However, prior work investigating factors affecting late-life cognition does not usually account for factors likely being interconnected (e.g., socioeconomic status [SES], physical activity, and mental health are highly linked44,45,46), with aging cognition studies typically inserting them as independent predictors in regression-based analyses. We argue that a dimensional/profiling approach may be beneficial for understanding which clusters of interdependent factors are most sensitive to distinct cognitive outcomes.
The majority of studies are conducted in Western contexts or using ethnically homogenous samples despite research suggesting that factors predicting older-age cognition vary between countries and ethnic communities5,34,35,43. In actuality, older populations in less developed countries are growing faster than those in developed countries47. More specifically, the Asia-Pacific region should be prioritised for aging research as by 2050; the continent will house most of the world’s population aged 80 years and older47. Thus, it is encouraging that extensive neurocognitive cohort studies are gaining traction in East Asia. These studies have examined grey and white matter trajectories as people in Singapore48,49,50 age, identified factors associated with cognitive ability (e.g., cognitive stimulation, physical health, and education34,35), and even how these patterns in Asian participants differ directly from white Western counterparts34. However, participants in the neuroimaging48,49,50 studies were from a high-income country and had quite homogenous ethnic and class backgrounds. Thus, Malaysia (where our present study is based), with its unique blend of ethnic and socioeconomic diversity, serves as a useful environment for assessing neurocognition in a non-Western aging population.
Utilising a data-driven dimensional approach, this study aimed to (1) investigate cognitive profiles, comprising standard performance measures and computational mechanisms underlying inhibition and cognitive flexibility, that emerge in a sample of Southeast Asian older adults, (2) assess which cognitive signatures significantly correspond to grey matter morphology and brain age, (3) clarify dimensions of sociodemographic, health, and lifestyle predictors most strongly linked to each cognitive profile, and (4) formally address the potential relationships between sociodemographic, brain, and cognitive phenotypes using causal mediation analyses.
Results
This study comprised three sessions: (1) a structural magnetic resonance imaging (MRI) scan, (2) neuropsychological tasks, and (3) a structured interview probing demographic, socioeconomic, physical health, mental health, and lifestyle measures.
Participants
Initially, 397 urban-dwelling older adults (range: 60–87 years) underwent a structural MRI scan; out of these, 386 completed a Go/No-Go task measuring response inhibition [mean age: 66.9 years, standard deviation (SD): 5.24, 50.5% female], 382 completed the Wisconsin card sorting task (WCST) measuring attentional set-shifting (mean age: 66.9 years, SD: 5.30, 50.8% female), and 378 completed both tasks (see the “Methods” section and Fig. 1 for task descriptions and performance measures). These tasks were employed (1) because of their sensitivity to age effects51,52 and (2) applying computational models to task data is shown to result in reliable parameter estimates12,13 that can be used for cognitive profiling analysis. To maximise sample sizes, we report results for each task separately.

A Study protocol outlining stages of recruitment, screening, and data collection (encompassing a structured interview, structural MRI scan, and neuropsychological testing). B The Go/No-Go task was used to probe response inhibition. Participants were instructed to respond using the Spacebar when seeing a specific alphabet (Go-Trials) on screen, but to withhold responding when seeing another alphabet (No-Go Trials). Participants were instructed to respond within 500 milliseconds during Go trials otherwise they are given the feedback ‘Too Slow’. Erroneous responses during No-Go trials led to ‘Incorrect’ feedback being displayed. C Cognitive flexibility was assessed using the Wisconsin Card Sorting Task (WCST), which contained 128 trials. Participants are instructed to sort cards into decks based on a rule (either number, colour, or shape). They must discern the rule based on trial-by-trial feedback. If they use the correct rule 10 times in a row (indicating the completion of one set), the rule changes.
Our sample was ethnically diverse (see Table S1) and approximately matched the ethnic population in Klang Valley, Malaysia (Department of Statistics Malaysia, 2020). Participants were also socioeconomically diverse, with a significant proportion living in low-cost/public housing (Go/No-Go: 40.93%, WCST: 41.88%).
Three-hundred and seventy-two and 365 of the participants who completed the Go/No-Go task and WCST, respectively, underwent the structured interview (Table S1). All participants provided informed written consent and were compensated 100-ringgit Malaysia in cash (approximately $21 [USD]) and a food delivery gift voucher worth 30 ringgit (approximately $6.30 [USD]).
Interpreting cognitive profiles
Computational models were fit to trial-by-trial Go/No-Go (GnG) and WCST data separately (see the “Methods” section and Table 1 for a glossary of model parameters). The best-fitting model for the Go/No-Go data was a drift diffusion model13,14 with a separate drift rate (indexing efficiency of evidence accumulation) for Go (v.go) and No-Go (v.nogo) stimuli, a boundary separation parameter (a, higher values indicate more careful decision-making), non-decision time (Ter, represents time taken up by processes irrelevant to decision-making, e.g., motor responses), and a starting point parameter (z, higher values indicate a bias for making a Go response; lower values indicate a non-response bias). After fitting the model to data, we observed an extremely negative average drift rate for 1 participant (v = −686.64) and hence, it was excluded from further Go/No-Go analysis.
The best fitting model for the WCST data was a reinforcement learning model11,12 comprising separate reward (r) and punishment (p) rates (quantifying how quickly participants update beliefs about a choice based on positive and negative feedback respectively), a decision-consistency parameter (d, indexes the extent to which participants make more exploitative or consistent choices), and a rigid focusing parameter (f, the degree to which attention is narrowly focused on a specific rule over others in trials where feedback is ambiguous, i.e., more than one rule could be correct). See Tables S2.1 and S2.2 for model-fit results and Table S3 for summary statistics of task measures.
Exploratory principal component analysis (PCA) of the Go/No-Go measures revealed a 3-profile structure (Fig. 2A). The first factor (GnG-PC1, “Well-Performing”) encompassed intact performance on the task, showing negative loadings for Go and No-Go errors, and reaction times. The second factor (GnG-PC2, “Slow Responding”) captured slow behaviour: high positive loadings for reaction times towards Go and No-Go stimuli, and positive loadings for Go errors but negative for No-Go errors. We interpret the positive Go errors as being due to this slowness, and inversely slowness resulted in fewer valid presses in No-Go trial. The third factor (GnG-PC3, “Random Responding”) captured noisy/random choosing indicated by positive loadings for Go and No-Go errors or, in other words, a tendency to withhold from responding to the Go stimulus but responding to the No-Go stimulus. Reaction time loadings for GnG-PC3 were in between those of GnG-PC1 and GnG-PC2.
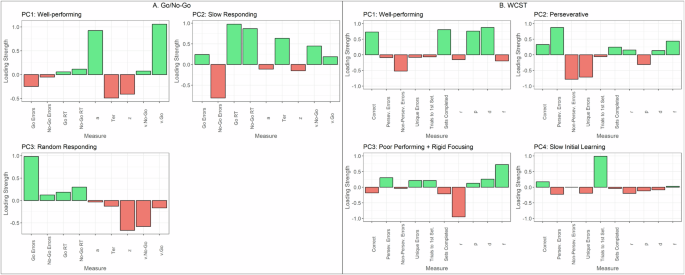
A PCA applied to Go/No-Go data revealed a 3-factor structure, while B WCST data revealed a 4-factor structure.
Computational model parameters enabled insight into mechanisms driving the profiles. Intact task performance (GnG-PC1) was associated with high positive loadings of a and v.Go, but negative Ter. The slow responding profile (GnG-PC2) showed elevated non-decision times (Ter) and more evidence accumulation towards the No-Go stimulus over the Go stimulus (v.NoGo). Lastly, random responding (GnG-PC3) showed negative loadings on all model parameters, particularly for v.NoGo and z. For the z parameter, it is interesting to note that it showed negative loadings across all profiles, likely signifying that the older adult participants showed a general tendency to not respond.
Next, the PCA WCST measures revealed a 4-profile structure (Fig. 2.ii). WCST-PC1 (“Well-performing”) was characterised by positive loadings for correct trials and a number of sets successfully completed and negative loadings for all error types. WCST-PC2 (“Perseverative”) captured a uniquely inflexible profile, revealing positive loadings for perseverative errors (incorrectly choosing a deck based on the rule from the previous set) and negative loadings for non-perseverative (errors that were not perseverative) and unique errors (choosing a deck that does not match the test card on any rule). WCST-PC3 (“Poor performing + rigid focusing”) was associated with the worst task performance, as it showed positive loadings for perseverative and unique errors and was the only profile to show a negative loading for correct responses. WCST-PC4 (“Slow initial learning”) showed the highest positive loading for a number of trials to complete 1st set, which measures poor initial rule recognition53. WCST-PC2 and WCST-PC4 still showed positive loadings for the proportion of correct responses.
WCST-PC1 was associated with positive loadings for parameters p and d, signifying that task accuracy in this sample is related to greater sensitivity to punishing/incorrect feedback (p) and higher propensity for value-driven decisions (d). WCST-PC2 and WCST-PC3 both appear to be driven by rigid rule focusing, indicated by positive loadings of parameter f. WCST-PC3 showed higher loadings for f compared to WCST-PC2, and additionally very negative loadings for r. Thus, rigid focusing (f) and reduced sensitivity to rewarding feedback (r) are related to poor performance on the WCST. WCST-PC4 may not be well-captured by the computational model as loadings for the model parameters showed small magnitudes.
Relationship between demographic variables and cognitive profiles
Age and housing-type (low-cost vs. middle-to-high-cost) were strongly associated with the cognitive profiles (Fig. 3). Participants who were younger and living in middle-to-high-cost housing (compared to low-cost housing) scored higher on WCST-PC1 [well-performing; Age: Estimate = −0.124, p-FWE (family-wise error corrected) < 0.001; Housing: Estimate = 2.533, p-FWE < 0.001], WCST-PC2 [perseverative; Age: Estimate = −0.112, p-FWE < 0.001; Housing: Estimate = 1.435, p-FWE < 0.001], and WCST-PC4 [slow initial learning; Age: Estimate = −0.0346, p-FWE = 0.013; Housing: Estimate = 0.609, p-FWE < 0.001] profiles.
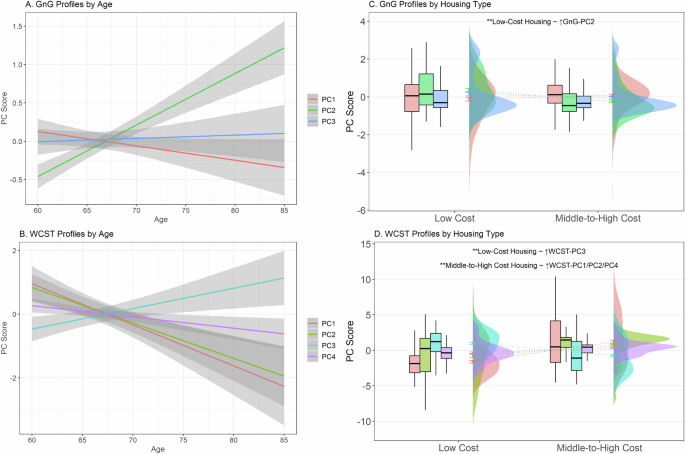
A Only GnG-PC2 (slow responding) and B WCST-PC3 (poor performance + rigid focusing) were significantly associated with advanced age. The other WCST cognitive profiles were significantly associated with younger ages. C and D Raincloud plots with boxplots, error bars, and distributions illustrate how scores associated with GnG and WCST profiles differ across SES classes. In our regression analysis, participants living in low-cost housing showed significantly increased scores on both C GnG-PC2 (slow responding; green boxplot) and D WCST-PC3 (poor performance + rigid focusing; blue boxplot). WCST-PC1 (red boxplot), PC2 (lime green boxplot), and PC4 (purple boxplot) scores were associated with living in middle-to-high-cost housing. **Holm (family-wise error rate) corrected p-values < 0.001. Error bars represent standard errors.
Inversely, participants who were older and living in low-cost housing scored higher on WCST-PC3 [poor performing + rigid focusing; Age: Estimate = 0.0687, p-FWE = 0.002; Housing: Estimate = −1.429, p-FWE < 0.001] and GnG-PC2 [slow responding; Age: Estimate = 0.0594, p(BH) < 0.001; Housing: Estimate = −0.533, p-FWE < 0.001]. Other Go/No-Go profiles were not associated with age or housing-type. Gender and ethnicity were not significantly associated with any profiles.
See Supplementary for relationships between demographic variables and model parameters.
Relationship between grey matter volume (GMV) and cognitive profiles
Whole-brain (Table S4.1, Fig. 4A) and ROI (region-of-interest, Table S4.2) analysis revealed that WCST-PC1 (well-performing) scores corresponded to greater GMV in the left (L) fusiform (BA37; −46, −58, −24; p-FWE < 0.001; voxels = 78), L cerebellum (−46, −57, −26; p-FWE = 0.001; voxels = 57), right (R) amygdala (27, −6, −22, p-FWE = 0.019; voxels = 207), and L amygdala (−26, 2, −21; p-FWE = 0.013, voxels = 53).
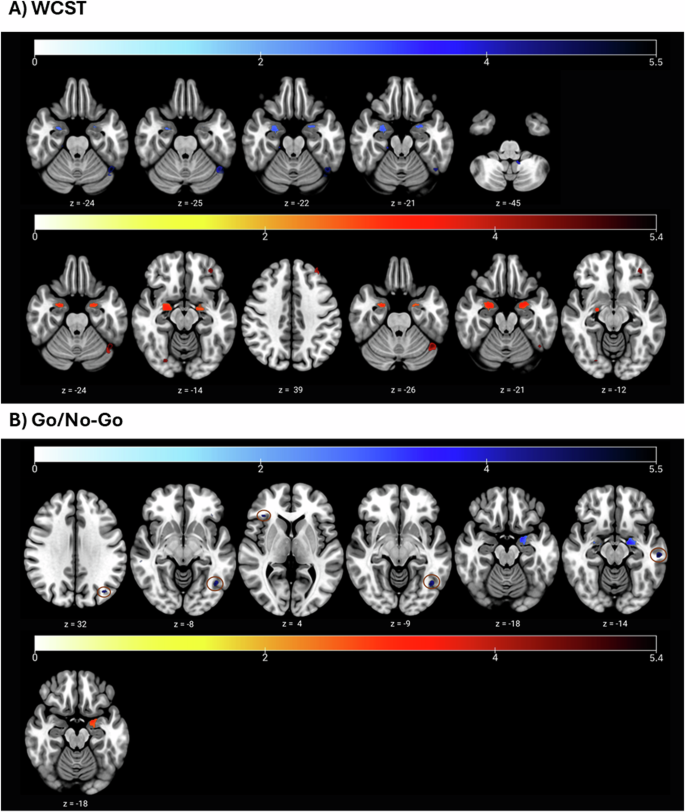
A General Linear associations between WCST cognitive profiles and grey matter volume (GMV); blue = ↑GMV, red = ↓GMV. Above: higher WCST-PC1 (well-performing) scores were linked with greater GMV in L fusiform (z = −24), L cerebellum (z = −25), and bilateral amygdala (z = −22, z = −21). WCST-PC4 (slow initial learning) was also associated with increased GMV in the L cerebellum (z = −45). Below: WCST-PC3 (poor performing + rigid focusing) scores were associated with reduced GMV in the L fusiform (z = −24), R fusiform (z = −14), L orbital part of the inferior frontal gyrus (z = −14), L PFC (z = 39), L DLPFC (z = 39), L cerebellum (z = −26), and bilateral amygdala (z = −21, z = −12). B General Linear associations between Go/No-Go profiles/parameters and grey matter volume (GMV); blue = ↑GMV, red = ↓GMV. Above: v.NoGo (L parietal cortex, L fusiform, R triangular part of IFG; z = 32, z = −8, z = 4), v.average (L occipital lobe; z = −9), and z (L middle temporal gyrus, amygdala; z = −18, z = −14) were positively associated with GMV. Below: GnG-PC3 (random responding) was associated with significantly reduced GMV in the L amygdala (z = −18). Circles were added to enhance the clarity of activation blobs.
WCST-PC4 (slow initial learning) scores were also associated with greater GMV in the L cerebellum (−12, −50, −45, p-FWE = 0.014, voxels = 55).
By contrast, WCST-PC3 (poor performing + rigid focusing) was associated with widespread GMV loss. Smaller GMV was observed in the L fusiform (BA19; −45, −58, −24; p-FWE = 0.001, voxels = 76), R fusiform (BA19; 26, −78, −14; p-FWE = 0.016, voxels = 24), L orbital part of the inferior frontal gyrus (IFG; BA47; −36, 44, −14; p-FWE = 54; voxels = 54), L prefrontal cortex (PFC; −34, 45, 39; p-FWE = 0.003, voxels = 29), L dorsolateral prefrontal cortex (DLPFC, −34, 45, 39; p-FWE = 0.001, voxels = 48), L cerebellum (−45, −58, −26; p-FWE = 0.001; voxels = 107), and bilateral amygdala (L: −24, 2, −21, p-FWE = 0.003, voxels = 290; R: 22, −10, −12, p-FWE = 0.004, voxels = 382).
WCST-PC2 (perseverative) was not significantly associated with GMV.
When contrasting different profiles against each other (Tables S4.3 and S4.4), we found that WCST-PC1 (well-performing) scores showed a stronger association with GMV in various regions compared to WCST-PC2 (perseverative) [L PFC (−2, 58, 28; p-FWE = 0.004; voxels = 40) and L DLPFC(−2, 58, 28; p-FWE = 0.001, voxels = 42)] and WCST-PC3 (poor performing + rigid focusing) [L fusiform (BA37; −45, −58, −24; p-FWE = 0.003; voxels = 45), L orbital part of IFG (BA47; −36, 44, −14; p-FWE = 0.007; voxels = 75), L PFC(−34, 46, 39; p-FWE = 0.002, voxels = 36), L DLPFC(−34, 46, 39; p-FWE < 0.001; voxels = 57), L cerebellum (−45, −58, −26; p-FWE = 0.002; voxels = 58), and L amygdala (−24, 2, −20; p-FWE = 0.004; voxels = 262)].
WCST-PC2 (perseverative) scores also showed a stronger association with GMV compared to WCST-PC3 (poor performing + rigid focusing) in the L fusiform (BA37; −46, −58, 24; p-FWE = 0.001; voxels = 52), L cerebellum (−46, −57, −26; p-FWE = 0.002; voxels = 35), and L amygdala (−24, 2, −21; p-FWE = 0.006; voxels = 125).
Additionally, WCST-PC4 (slow initial learning) scores were more strongly associated with GMV than WCST-PC2 (perseverative) [L pars opercularis of the IFG (BA44; −54, 15,9; p-FWE = 0.024, voxels = 43), R PFC(16, 66, 21; p-FWE = 0.002; voxels = 49)] and WCST-PC3 (poor performing + rigid focusing) [L cerebellum (−12, −50, −45; p-FWE = 0.008; voxels = 82), R amygdala(22, −10, −12; p-FWE = 0.014; voxels = 53)].
Additionally, we investigated whether GMV was associated with model parameters. Only rigid focusing (f) scores were linked to significant deterioration in the R amygdala (24, −10, −12; p-FWE = 0.008; voxels = 346).
Contrasting with WCST profiles, GnG profiles were weakly associated with GMV, with only GnG-PC3 (Fig. 4B) (random responding) scores negatively correlating with GMV in the L amygdala (−20, 0, −18; p-FWE = 0.004; voxels = 187). Other brain associations with GnG-profiles failed to meet the voxel-size threshold for significance.
Nonetheless, some parameters significantly correlated with GMV (Fig. 4B), namely v.NoGo [L parietal cortex (BA39, −38, −72, 32; p-FWE = 0.005; voxels = 35), L fusiform (BA37; −42, −62, −8; p-FWE = 0.007; voxels = 50), R triangular part of IFG (BA45; 36, 30, 4; p-FWE = 0.010; voxels = 24)], v.average [L occipital lobe (BA19; −42, −63, −9; p-FWE = 0.005; voxels = 38)], and z [L middle temporal gyrus (BA21; −58, −24, −14; p-FWE = 0.001; voxels = 61), amygdala (−20, 0, −18; p-FWE = 0.002; voxels = 247)].
Factor analysis of survey variables (see Supplementary)
Next, we conducted an exploratory factor analysis on our survey variables and investigated how resulting factors predict cognitive profiles. Five factors emerged (Fig. 5). The factor capturing the highest variance (var: 10.33%) was labelled ‘SES & Cognitive Reserve’ as it included mid-to-late adulthood socioeconomic measures and variables contributing to, or thought to be proxies for, cognitive reserve (e.g., education and occupational complexity)54,55. The next factor was termed ‘Cognitive and Physical Stimulation’ (var: 8.59%), where the highest loadings comprised spending time on cognitive and physical activities. The third factor was labelled ‘Hobbies’ (var: 5.34%), encompassing spending time on leisure activities, entertainment, and hobbies. Mental health symptoms (var: 4.18%) included loadings on scales measuring anxiety, depression, and related dimensions, while Childhood SES (var: 3.75%) encompassed perceived childhood SES items.
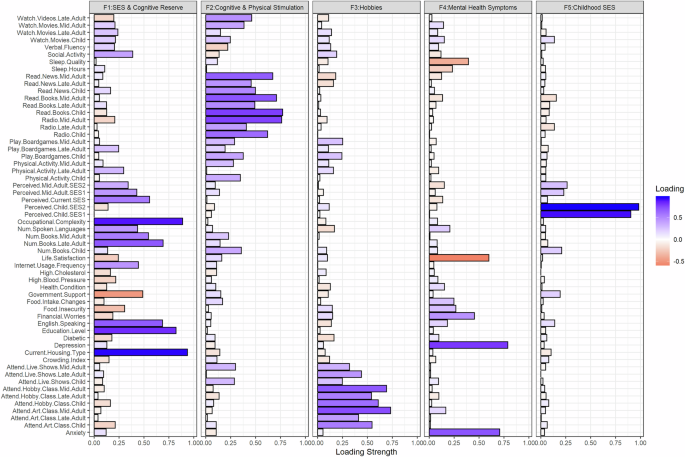
An exploratory factor analysis on survey data revealed four factors: (1) SES & Cognitive Reserve included positive loadings for various socioeconomic measures (e.g., current perceived SES) and variables typically conferring high cognitive reserve (e.g., education and occupational complexity); (2) Cognitive & Physical Stimulation included positive loadings for engagement in cognitively and physically stimulating activities; (3) Hobbies showed positive loadings for engagement in pleasurable or leisure activities such as attending live performances and art classes; (4) Mental Health Symptoms showed positive loadings for measures of anxiety, depression, and financial worries, but negative loadings for life satisfaction and sleep quality; (5) Childhood SES depicts positive loadings primarily for participants’ perceived SES in childhood (retrospective measure). More blue = positive; more orange = negative.
Relationship between cognitive profiles and brain age/survey factors
We used general linear regression models to evaluate relationships between brain and survey factors with cognitive profiles, controlling for age, gender, and ethnicity. Models were validated by conducting ridge regressions with 10-fold cross-validation (see the “Methods” section).
BrainAge-ActualAge was only associated with one cognitive profile: GnG-PC2 [slow responding; Estimate = 0.16, confidence interval (CI) = 0.06–0.25, p-FWE = 0.005].
WCST-PC1 [well-performing; Estimate = 1.67, CI = 1.28–2.07, p-FWE < 0.001] was positively associated with increased SES & Cognitive Reserve while WCST-PC3 [poor performing + rigid focusing; Estimate = −0.99, CI = −1.27 to −0.71, p-FWE) < 0.001] was negatively associated with this factor. SES & Cognitive Reserve scores were also associated with reduced GnG-PC2 [slow responding; Estimate = −0.24, CI = −0.36 to −0.12, p-FWE < 0.001] scores, but not other Go/No-Go cognitive profiles.
WCST-PC2 [perseverative; Estimate = 0.91, CI = 0.57–1.26, p-FWE < 0.001], and WCST-PC4 [slow learning, Estimate = 0.39, CI = 0.21–0.56, p-FWE < 0.001] were also associated with SES & Cognitive Reserve in the linear regression models but not when using more stringent ridge regression models (ridge coefficient estimates < 0.01).
Other independent variables were not significantly predictive of the cognitive profiles.
Among the Go/No-Go computational model parameters, only z (bias for responding) was associated with any of the tested predictors; it was positively associated with SES & Cognitive scores [Estimate = 0.03, CI = 0.01–0.06, p-FWE = 0.02] and negatively associated with BrainAge–ActualAge [Estimate = −0.03, CI = −0.05 to −0.01, p-FWE = 0.005], although the latter association was not significant in the corresponding ridge regression model.
For WCST model parameters, reward rate [r, Estimate = 0.04, CI = 0.01–0.07, p-FWE = 0.002], punishment rate [p, Estimate = 0.05, CI = 0.03–0.08, p-FWE < 0.001], and decision-consistency [d, Estimate = 0.15, CI = 0.07– .24, p-FWE = 0.001] parameters were significantly associated with higher SES & Cognitive Reserve scores while rigid focusing [f; Estimate = 0.04, CI = 0.01–0.07, p-FWE = 0.049] was associated with lower SES & Cognitive Reserve scores. However, these associations were not significant in corresponding ridge regression models.
See Fig. 6, Tables S5.1 and S5.2 for regression model results.
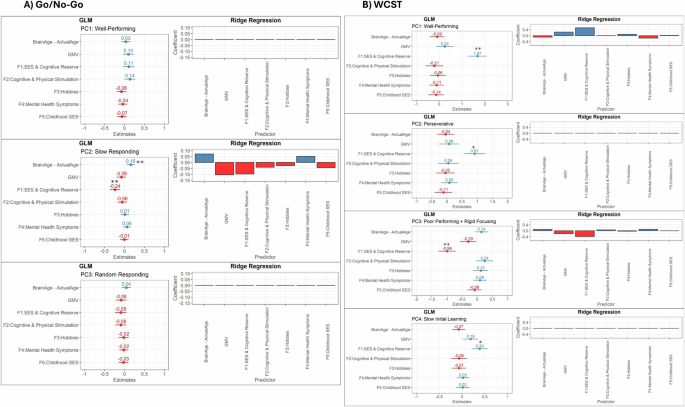
A Only GnG-PC2 (slow responding) was significantly associated with advanced brain age and reduced scores on the SES & cognitive reserve factor. Other Go/No-Go cognitive profiles were not significantly predicted by the independent variables tested. B All WCST profiles were significantly predicted by the SES and Cognitive reserve factor, particularly WCST-PC1 (well-performing; positive association) and WCST-PC3 (poor-performing + rigid responding; negative association). **Significant based on both linear regression and ridge regression results, *significant based on linear regression results only.
Exploratory white matter volume (WMV) analysis
Given that GnG-PC2 (slow responding) was significantly related to BrainAge-ActualAge but not to GMV in any specific regions, we sought to explore whether other global brain metrics predicted variation in this profile, which would additionally guide the interpretation of the brain-age results.
Total GMV [p-FWE > 0.05] was not significantly predictive of GnG-PC2 in the model with brain age and survey factors (Table S5.1), albeit when conducting bivariate analysis, there was a significant negative correlation between the profile and GMV (r = −0.34, p < 0.01; see Tables S6.1–S6.2 for correlations).
We then included total WMV as a predictor in the regression models described above and found that lower WMV corresponded to increased scores on GnG-PC2 [Estimate = −0.18, CI = −0.32 to −0.04, p-FWE = 0.042, but not to other Go/No-Go or WCST profiles (all p-FWE > 0.05).
Investigating brain pathways mediating sociodemographic—cognition relationships
To dissect the complex interplay between sociodemographic, brain, and cognitive variables, we conducted mediation analyses (SES & Cognitive Reserve factor → brain age and structure → cognitive profiles; see the “Methods” section). We only considered cognitive profiles and computational parameters that showed significant associations with brain variables and the SES & Cognitive Reserve factor, namely WCST-PC1 (well-performing), WCST-PC3 (poor performing + rigid focusing), GnG-PC2 (slow responding), and z (bias for responding). Total GMV, total WMV, BrainAge-ActualAge, and volumes of ROIs (from the voxel-wise GMV analysis) were used as mediators. The average causal mediation effects (ACME) are reported here (see Fig. 7).
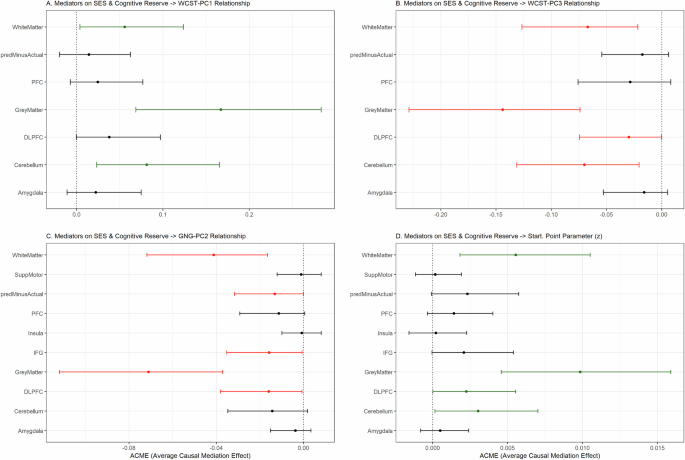
Total GMV, total WMV, BrainAge-ActualAge, and ROI volumes were used as mediators. Error bars indicate the confidence intervals for the average causal mediation effect (ACME) for each mediation variable tested. Green = significantly positive mediator; Red = significantly negative mediator; Black = non-significant. The cognitive profiles used as dependent variables were A WCST-PC1, B WCST-PC3, C GnG-PC2. Additionally, D the starting point parameter (z) was used as a dependent variable as it showed significant associations with GMV and SES & Cognitive Reserve. Key: predMinusActual = Brain Age–Actual Age, SuppMotor = supplementary motor area, PFC = prefrontal cortex, DLPFC = dorsolateral prefrontal cortex, IFG = inferior frontal gyrus.
Total GMV, total WMV, and cerebellum volume significantly mediated the influence of SES & Cognitive Reserve scores on both WCST-PC1 (GMV: ACME = 0.167, CI = 0.069–0.28, p < 0.01; WMV: ACME = 0.056, CI = 0.0039–0.12, p = 0.034; cerebellum: ACME = 0.081, CI = 0.023–0.17, p = 0.004) and WCST-PC3 (GMV: ACME = −0.144, CI = −0.23 to −0.07, p < 0.01; WMV: ACME = −0.067, CI = −0.13 to −0.02, p < 0.01; DLPFC: ACME = −0.030, CI = −0.074 to −0.00018, p = 0.05; cerebellum: ACME = −0.070, CI = 0.021–0.13, p < 0.01), albeit in opposite directions.
Next, total GMV (ACME = −0.071, CI = −0.11 to −0.038, p < 0.01), total WMV (ACME = −0.041, CI = −0.072 to −0.017, p < 0.01), BrainAge-ActualAge (ACME = −0.013, CI = −0.032 to −0.000067, p = 0.05), IFG volume (ACME = −0.016, CI = −0.016 to −0.035, p = 0.042), and DLPFC volume (ACME = −0.061, CI: −0.038 to −0.00056, p = 0.042) significantly mediated the negative relationship between SES & Cognitive Reserve and GnG-PC2. Lastly, the positive influence of SES & Cognitive Reserve on z (bias for responding) scores was mediated by total GMV (ACME = 0.0099, CI = 0.0046–0.016, p < 0.01), total WMV (ACME = 0.0056, CI = 0.0018–0.011, p = 0.002), DLPFC volume (ACME = 0.0030, CI = 0.000023–0.0055, p = 0.03), and cerebellum volume (ACME = 0.0030, CI = 0.00016–0.007, p = 0.04).
Discussion
In a sizeable sample of Southeast-Asian older adults from diverse socioeconomic strata, we mapped cognitive dimensions of cognitive flexibility (WCST) and inhibition (Go/No-Go) onto brain structure, brain-age, and sociodemographic and lifestyle variables. We found that specific profiles of cognitive flexibility were linked to variance in grey matter density in frontal and cerebellar regions, the fusiform and the amygdala. Inhibition-based profiles were less predictive of GMV, but a profile reflecting slowed responding during response inhibition (GnG-PC2) was uniquely associated with accelerated brain aging and reduced total white matter volume. This slow responding profile and a separate profile comprising rigid focusing and increased errors during the WCST (WCST-PC3) were significantly associated with adulthood poverty and reduced cognitive reserve (e.g., low education and occupational complexity) but not with cognitive and physical stimulation, involvement in leisure activities, mental health, and childhood SES. Mediation analyses further clarified that a combination of SES and cognitive reserve may exert influence on one’s cognitive presentation partially through brain structural pathways, with GMV, WMV, and cerebellum and DLPFC volumes being the most common significant mediators on relationships between sociodemographic factors and tested cognitive variables. Brain age relative to predicted age also significantly mediated the negative relationship between the SES & Cognitive Reserve factor and GnG-PC2, albeit it showed a small effect size.
Using a computational dimensional approach, we successfully characterised mechanisms underlying set-shifting in healthy older adults. Superior performance on the WCST was associated with punishment sensitivity and decision-consistency while impaired performance was associated with reduced reward sensitivity and narrowed attentional focusing. These two profiles showed significant associations with GMV in overlapping regions, albeit in opposite directions; good performance was associated with enhanced GMV in the left fusiform, left cerebellum, and bilateral amygdala, while the rigid focusing/poor performing profile was linked to deterioration in the bilateral fusiform, left inferior frontal gyrus, left prefrontal and dorsolateral prefrontal cortices, and bilateral amygdala.
Our findings synergise with seminal research demonstrating the critical role of prefrontal cortices and fusiform gyri in cognitive control56,57,58. Moreover, our modelling results are consistent with modern computational work in a large Western sample12, clarifying the importance of high punishment sensitivity and choice consistency for successful set-shifting and linking reduced punishment sensitivity with lesions in the prefrontal cortex. We infer that age-related grey matter atrophy in these attentional control regions leads to (1) difficulty considering multiple possible rules in the task and (2) impaired ability to synthesise and incorporate feedback.
Profiles related to Go/No-Go performance were less predictive of GMV, suggesting that WCST dimensions are better suited as cognitive markers for brain deterioration. Nonetheless, we uncovered that certain drift-diffusion parameters, namely evidence accumulation (v.average and v.NoGo) and response bias (z), were significantly associated with enhanced GMV, collectively, in the middle temporal gyrus, parietal cortices, fusiform, inferior frontal gyrus, and amygdala.
Our Go/No-Go findings extend prior work reporting older age being associated with slow non-decision times and more cautious decision-making19,20. In our study, older Southeast Asian adults with an increased bias for responding and more efficient evidence accumulation show healthier brain structures. During Go/No-Go, bias towards the favoured choice (i.e. responding to the ‘Go’ stimulus) reduces the required evidence threshold for decision-making59. The response bias parameter was negative across all Go/No-Go profiles indicating that our participants showed a general tendency to not respond, perhaps due to stimulus presentation speed and task attentional demands. Hence those able to overcome this tendency also show enhanced GMV. In particular, response bias was significantly associated with the volume of the middle temporal gyrus, a region associated with processing efficiency and effective stimulus discrimination60,61. Next, increased evidence accumulation (towards No-Go) being associated with greater inferior frontal gyrus integrity is congruent with work showing that the parameter is sensitive to aging on perceptual decision-making tasks19, and research describing correlational62 and causal links63 between the inferior frontal gyrus and inhibitory control.
Interestingly, grey matter within the amygdala was broadly associated with various parameters and cognitive profiles, demonstrating that the region may reflect general cognitive decline in this healthy older population. Supporting this, amygdala deterioration is significantly predictive of future global cognitive decline and Alzheimer’s disorder, even before noticeable signs of cognitive difficulty emerge64,65.
Previous research leveraging longitudinal cohorts (i.e., the Dunedin Longitudinal Study66, the Lothian Birth Cohort30, and the I-Lan Longitudinal Aging Study67) has reported that cognitive decline corresponds to accelerated brain aging31,32,68, albeit these studies used broad measures of cognitive performance. We have expanded this work by interrogating whether dissociable cognitive dimensions are independently related to brain-age. We discovered that brain-age is not significantly predictive of all types of cognitive impairment. Instead, a cognitive profile (GnG-PC2) encompassing prolonged reaction times and greater non-decision times (for processes unrelated to decision-making) was distinctly associated with older brain-age. Additionally, the modelling results indicate that ‘slowness’ during Go/No-Go in older age can be attributed to deficits in processing stimuli and coordinating movements accordingly (quantified by the Ter parameter), and has been demonstrated empirically69.
It is puzzling that this profile did not significantly correspond to grey matter deterioration in any specific brain region. Nonetheless, we propose that slow responding reflects more global atrophy while cognitive inflexibility is related to localised deficits. This is supported by the brain-age calculation accounting for both grey and white matter and being a better predictor for pathological cognitive impairment than total and regional GMV70. Strengthening this notion, we found that the slow responding profile was significantly linked to decreases in both global white and grey matter volume. This is in line with work reporting shorter and more stable reaction times being associated with greater cerebral and inferior parietal white matter integrity71, while a review has noted that a reduced capability to modulate GABA-mediated inhibitory processes, due to age-related loss of both grey and white matter, underlies motor slowing72.
Our findings contribute to literature revealing motor deficits and processing speed to be especially impacted by older age, even in comparable Southeast Asian48,49,50 cohorts. Slowness (measured by walking speed) and increased mortality risk have also been previously associated with brain-age31. Indeed, ours and prior work affirms the utility of general ‘slowness’ as an aging biomarker, as it may discriminate between mild cognitive impairment and Alzheimer’s disease (i.e., pronounced in the latter but not the former)73 and is reflective of physical impairments such as poor balance and fall concerns74.
Ultimately, our study highlights the importance of studying individual differences in cognition within aging populations as older adults can vary widely in cognitive presentation. Through factor analysis of self-report measures, we assessed possible mechanisms contributing to distinctions in cognitive phenotypes. We found that ‘unhealthy’ profiles (i.e., the slow responding Go/No-Go profile and the rigid focusing WCST profile) corresponded strongly to reduced scores on a single factor encompassing mid-to-late adulthood SES and cognitive reserve. By contrast, factors encompassing mental health, participation in cognitive and physical activities, engagement in leisure and hobbies, and general physical health were not associated with any cognitive profiles.
There is moderate support for SES affecting late-life GMV and cognition in Western cohorts and samples36,40,41, albeit alongside a host of other factors (which we have also tested for), including gender, ethnicity, mental and physical health, sleep, and nutrition5,6,31,36,40,42,75. In our study, the dominant role of SES in predicting cognitive performance could reflect an important predictor that may be diluted among aging research that employs more homogenous, wealthier samples. Our recruitment of participants from diverse monetary backgrounds reveals the powerful impact of SES and the need for future research to utilise inclusive and diverse sampling. Moreover, our study highlights the importance of conducting research in developing countries like Malaysia, where socioeconomic factors on late-life cognition may be more pronounced, as supported by recent aging work comparing low-to-middle-income and high-income countries43.
The use of factor analysis to cluster self-report measures elucidates how SES and other interlinked traits may influence one’s cognitive profile. We found various SES variables (e.g., perceived SES, housing type, etc.) were grouped predominantly with education, occupational complexity, and other traits linked to cognitive fortitude. This indicates that these latter measures are tightly coupled with one’s SES and, in turn, are cumulatively predictive of cognition. Education is particularly indicative of executive function76, memory77, and even late-life brain network segregation78, although there is evidence suggesting that increased later-life income can reverse the negative effects of low education on cognition79.
Our causal mediation analysis has unearthed potential pathways through which SES and cognitive reserve factors shape cognitive profiles, namely through influencing brain structural patterns, including total grey and white matter and specific regions implicated in executive functioning and inhibition (i.e., DLPFC and cerebellum). We also report preliminary evidence for brain age mediating how SES and cognitive reserve impact cognitive slowness (GnG-PC2) specifically, which adds to prior research suggesting that brain age mediates the link between modifiable risk factors (e.g., cardiovascular risk, mental health factors, lifestyle risk factors) and general cognitive function80,81. The impact of SES on cortical and subcortical structures is well documented [overall82, DLPFC83, cerebellum84,85, brain age86], and SES and brain structure, in turn, significantly predict cognitive test scores82,83,84,87. Low SES may influence brain morphology through reducing opportunities for cognitive stimulation88, consistent with us finding that SES scores were distinctly clustered with cognitive reserve variables. In conjunction, there is evidence for SES impacting the brain through stress-related processes, supported by prior work showing that stress mediates the relationship between SES and GMV41 and research reporting that low SES functionally impairs the corticolimbic system which is implicated in stress reactivity89,90. It is posited that adverse conditions due to poor SES can undermine the neural system through, for instance, dysregulating the hypothalamic-pituitary-adrenal axis, causing excessive glucocorticoid secretion, and eventually resulting in neuronal death89,91.
It is also intriguing to consider the factors that had little impact on the cognitive profiles. Gender and ethnicity were only weakly predictive, likely because the cognitive functions tested do not typically show gender differences in older adults, unlike in younger and middle-aged groups92, while recent research conducted among 1140 elderly Malaysians found that while mental health and social engagement varied between ethnic groups, cognitive performance did not93. Next, childhood SES and cognitive and physical engagement across the lifespan did not correspond to cognition, contradicting previous findings that childhood SES is typically correlated with better brain structural outcomes94, and cognitive and physical interventions do show momentary cognitive benefits95. This could suggest weaknesses in retrospective self-report, as participants were asked to reflect on distant life events or recall levels of activity.
Depression, anxiety, sleep, and life satisfaction variables (clustered within a ‘mental health’ factor) also did not significantly predict cognition, despite research reporting a link between mental health symptoms and task deficits96,97,98,99. This may be partly attributed to the paradigms employed. To elaborate, anxious traits are typically reported to impair performance on tasks with an emotional reactivity component100,101,102,103,78,79,80,81, which our tasks lacked. Moreover, set-shifting tasks like the WCST are classically used to test patients with frontal lobe dysfunction104,105 and are more sensitive to disorders characterised by habitual and rigid behaviour106. Upcoming research would benefit from incorporating cognitive tasks more sensitive to mental health conditions and questionnaires probing a wider spectrum of symptoms to improve precision in deciphering associations between symptoms and cognitive mechanisms24 in older age. The results of our factor analysis on self-report measures may be useful for future researchers to identify tests that target specific phenotypes of cognitive performance.
Our cognitive subtyping approach may pave way for more sensitive diagnostic tests. For instance, quantifying cognitive slowness using computational modelling approaches in a clinical setting may enable early detection of pathological brain aging. In addition, cognitive profiles may be used to guide tailoring of intervention plans for improving cognition. As an example, physical exercise (e.g., aerobic and resistance training) is reported to improve both cognitive and physical speed in older adults107,108,109,110 and thus may be recommended for patients demonstrating a ‘slow responding’ profile. Nonetheless, the prominent impact of SES on our cognitive findings signifies that any intervention should be augmented with concerted efforts to reduce inequality. This is supported by past research showing that providing supplemental income to older adults (living in a low-to-middle income country) positively impacts both cognitive and physical functioning111.
The limitations of our work will now be discussed. First, while volumetric grey matter analysis is well-suited for examining age-related brain effects and is widely used in large cohort studies with cognitive phenotyping3,112,113, we recognise that incorporating cortical thickness and surface-based measures would have provided a more comprehensive understanding of structural patterns linked to cognitive profiles. It is possible that certain associations exist between these other measures and cognitive profiles, which may not have been identified by our volumetric analyses. Second, as with all structural neuroimaging research, it is difficult to establish causality between brain and behaviour. Future work should incorporate a wider range of neuroimaging modalities, such as task-based functional MRI, electroencephalography, and diffusion tensor imaging (for detection of white matter abnormalities), to better discern neural signatures and networks subserving separate cognitive dimensions114. Third, a longitudinal approach, compared to retrospective self-report, would be more appropriate for clarifying how SES and associated mechanisms across the lifespan impact late-life cognition. In addition, our cognitive profiles encompassing flexibility and inhibitory measures are unlikely to capture the full spectrum of possible deficits associated with advanced aging. Future work may want to construct cognitive profiles by including other cognitive constructs (e.g., episodic memory115). Next, we acknowledge that our sample size is relatively limited compared to the extensive longitudinal cohorts established in Western countries, such as the UK Biobank. However, it is important to highlight that this represents the largest cognitive neuroimaging sample collected to date in Malaysia. We hope this pioneering effort will pave the way for more robust, higher-powered studies in the region.
Finally, all our participants were born in the 1960s or earlier, a time in Malaysia when education and economic opportunities were scarce. However, an estimated 62% of children born from 1975 onwards show enhanced educational attainment compared to their parents, with many also showing upward social mobility116. Given these trends, it would be advantageous to compare factors affecting cognitive domains in younger cohorts, to ensure we are equipped to manage and impede cognitive decline in future aging populations.
This study identified distinct cognitive dimensions that seem to be subserved by shared and dissociable structural brain patterns in older age. Older adults with impaired cognitive flexibility, due to rigid focusing and reduced feedback sensitivity, show reduced GMV in localised regions. In contrast, those with slow response tendencies and heightened non-decision times were susceptible to increased brain aging relative to chronological age. A single factor composed of SES and cognitive reserve variables was significantly predictive of cognitive profiles, and these relationships were partially mediated by total GMV, WMV, and GMV in dorsolateral prefrontal and cerebellar regions. Our work highlights potential avenues for remedying age-related cognitive health disparities in a Global South context, namely by using SES and cognitive reserve variables as modifiable targets for intervention.
Methods
Recruitment strategy
A proportion of participants were recruited via government-linked community centres for senior citizens117, advertisements in social media and newspapers, and through referrals of existing participants. Others were recruited from low-cost housing areas (Projek Perumahan Rakyat118 or People’s Housing Project). Through liaising with a charity that regularly provides food parcels to these housing areas, we arranged for mass on-site recruitment and screening sessions with communities. Stratified sampling was conducted where we recruited participants of Malay, Chinese, Indian, and other minority ethnic backgrounds, as well as ensured we had sizeable numbers of low and middle-to-high income participants. This study received approval from Sunway University’s Research Ethics Committee (SUREC2020/039) and is registered on ClinicalTrials.gov website (NCT06376656). The research was conducted in accordance with the Declaration of Helsinki.
Inclusion and exclusion criteria
Participants had corrected or normal-to-corrected vision and hearing, were generally mobile (able to walk at least 3 metres unassisted), were able to communicate in at least one of the following languages: English, Malay, or Mandarin, and did not have confirmed diagnoses of neurodegenerative and/or psychiatric disorders and a history of stroke. Standard MRI contraindications were also evaluated.
Additionally, we ruled out severe cognitive impairment or probable Alzheimer’s disease using the Montreal Cognitive Assessment (MOCA9). We defined the MOCA cut-off to a score of 13 for our study for three reasons: (1) The original cut-off of 269 for MOCA is criticised to be too high, even in samples of highly-educated older adults119; (2) the MOCA is highly sensitive to one’s education level across various cultures38,120,121,122, and many of our participants living in poverty reported having little to no education. Using the original cut-off, or even the cut-off of 18 as recommended in a study reporting results in a Malay-speaking sample123, would have led to the exclusion of a significant proportion of low-income participants; (3) several papers recommend a cut-off of 13-to-14 in less-educated or ethnic minority groups for ruling out potential Alzheimer’s disease122,124,125,126.
Questionnaires
Socioeconomic status (SES)
Our questionnaire included several questions probing socioeconomic standing. First, participants’ highest education level was measured on a 7-point scale: 0 (No education), 1 (Primary school), 2 (Secondary school), 3 (Pre-university), 4 (Diploma—equivalent to the 1st year of a Bachelor’s degree), 5 (Bachelor’s degree), 6 (Master’s degree), and 7 (Doctor of Philosophy). Next, participants’ occupational complexity was determined by coding participants’ longest-held occupation on a scale from 1 to 5 (1—least cognitive difficulty; 5—highest cognitive difficulty) following an established convention127. We also determined whether participants were English speaking (yes/no) due to reports of English proficiency being indicative of quality of local education128, availability of school funding/resources128,97, and considered an important factor for employability129 in Malaysia.
Objective SES was determined based on participants’ current housing (low-cost or not), a crowding index (number of people in household/number of bedrooms), and whether they were receiving any government financial support. Subjective current SES (i.e., perception of one’s social class) was evaluated using the MacArthur scale of subjective social status, a pictorial scale that uses a symbolic ladder with rungs labelled from 1 to 10. Participants were asked to identify their perceived place in society (either the top, middle, or bottom of the ladder) using the numbered rungs.
Next, food security as influenced by financial ability130 was probed using two questions: (1) “Currently, how often do you or anyone in your household skip meals, or reduce their portion because there is insufficient money for food?”; (2) “Currently, how often are you (or your household) short of money to buy enough food?” Participants’ responses ranged from 1 (Never) to 7 (Very Often). Scores per question were summed to obtain an aggregate score (range: 2–14), with higher scores indicating greater food insecurity.
We also sought to explore SES from a life course perspective131, by evaluating how early and later life exposures independently or accumulatively impact geriatric cognition. Life stages were divided into childhood-adolescence (6–19 years), middle adulthood (20–59 years), and late adulthood (60 years to current age). For each life stage, we asked participants to rate the financial situation of their household (1: Extreme poverty to 7: Extremely well-off) and to rate the financial situation of their household in comparison to other families (1: A lot worse off, 7: A lot better off).
Physical health
We requested that participants disclose whether they had any diagnosed health issues, with specific questions probing diabetes, high cholesterol, and hypertension/high blood pressure, which are among the most prevalent health conditions observed in Malaysian older adults132.
Physical activity frequency was measured using a question from the Outdoor Health Questionnaire developed by the National Institute for Health and Care Excellence: “In the past week, on how many days have you accumulated at least 30 min of moderate intensity physical activity such as brisk walking, cycling, sport, exercise, and active recreation? (Do not include physical activity that may be part of your job or usual role activities.)”. Participants could answer between 0 and 7 days.
Any recent reductions in food intake were also noted using a question from the Mini Nutritional Assessment-Short form133 (“Has food intake declined over the past 3 months due to loss of appetite, digestive problems, or chewing or swallowing difficulties?” 0: Severe decrease in food intake, 1: Moderate decrease in food intake, 2: No decrease in food intake).
Mental health and sleep
The Centre for Epidemiologic Studies-Depression Scale (CES-D) with 14-items134 was used to assess symptoms of depression. Participants rated items such as “I felt depressed” on a rating scale from 0 (rarely or none of the time) to 3 (most or all of the time). The 6-item short form of the Spielberger State-Trait Anxiety Inventory (STAI-S)135 was used to measure current anxiety symptoms, where participants rated items such as “I feel tense” on a scale from 0 (Not at all) to 3 (Very much).
To assess subjective well-being, the Satisfaction with Life-Scale136 was administered, consisting of 5 statements that participants have to rate their agreement on (1: strongly disagree–7: strongly agree).
Next, to account for the potential unique impact of financial struggles on mental health symptoms, we asked participants the following questions: (1) Currently, how often do you worry that you might not be able to pay back your debt(s)?; (2) Currently, how often do you worry that you (or your household) might not have enough money to make ends meet?; (3) Currently, how often do you worry that there wouldn’t be enough money to buy food?; (4) Currently, how often do you worry that you (or your household) might lose your home? Participants rated the statements on a 7-point scale (1: never–7: very often). An aggregate score was obtained ranging from 4 to 28, with a higher score indicating greater financial worries. Similar questions have been utilised previously utilised to research financial anxiety137,138.
Sleep duration and quality were assessed by asking participants the following questions from the Pittsburgh Sleep Quality Index139: “During the past month, how many hours of actual sleep do you get at night? (This may be different than the number of hours you spend in bed)” and “During the past month, how would you rate your sleep quality overall?”. Participants rated the latter question on a 4-point scale (1: very bad, 2: fairly bad, 3: fairly good, 4: very good).
Lifestyle and cognitive engagement measures
Lastly, our study also considered various lifestyle variables comprising social and cognitive engagement, and leisure. For social engagement, participants were asked to select the extent to which they had been socially active over the past 1 month out of 3 options: (1) “I am socially active, including meeting family, friends, and new people”, (2) “I am socially active, but with family members and close friends only” and (3) “I prefer to stay at home or keep myself busy with other activities.”
As internet use is reportedly associated with improved cognitive functioning in older adults140 we included a question probing how often participants use the internet in a given week (0–7).
The cognitive engagement measures included, first, a question related to book ownership adapted from a prior study141: “About how many books are in your home?” followed by the response options “few (0–10)”, “enough to fill one shelf (11–25)”, “Enough to fill one bookcase (26–100)”, “enough to fill two bookcases (101–200)”, “enough to fill more than two bookcases (more than 200)”.
Next, we assessed participants’ reading habits using two questions: “Currently how often do you (a) read books, (b) read the news.” Participation in other cognitively stimulating activities111 aside from reading was measured using 3 questions: “Currently how often do you (a) play tabletop/board games, (b) attend art classes and (c) attend hobby-based classes (writing, singing, etc.). Participation in leisure activities142,143 was assessed using the following four questions: “Currently how often do a) listen to the radio, (b) watch TV and/or videos, (c) attend live performances, (d) Go to the cinema or watch movies”. Participants rated each question on a scale from 1 (Never) to 7 (Very Often).
We adopted a life course approach here motivated by prior research reporting that engagement in physical and cognitive activities across the lifespan can significantly impact later-life cognition144,145. Hence, participants were requested to also answer questions related to physical activity, reading, cognitive activities, and leisure activities but recalling a typical week in their mid-adulthood (20–59 years) and childhood (6–19 years).
The full questionnaire was administered to participants in either English, Malay, or Chinese languages (depending on participant preference). When validated translations of scales were not available, we applied the translation procedure recommended by the Psychological Science Accelerator146, whereby the English version of the scale was translated by two native speakers followed by back translations by a 3rd native speaker. Reliability metrics for aggregate scores for each language are reported in Table S7.
Cognitive tasks
Before beginning the computerised neuropsychological tasks, participants were asked whether they were comfortable using a computer mouse. Those who were unaccustomed first completed a series of mouse practice games (“Mousercise”) to gain familiarity with using the device. The two tasks described below were completed alongside other cognitive tests not reported here.
WCST
The WCST from the Psychology Experiment Building Language programme147 was presented on a laptop to participants. The task contains up to 128 trials. Participants were shown 4 decks on-screen with a different combination of colours, numbers, and shapes. They were instructed to sort cards appearing at the bottom of the screen, using a computer mouse, according to one of three rules at a time, either number, colour, or shape. The rule must be discovered using trial and error via visual feedback received after each card is sorted. Cards were sorted by clicking on the chosen deck using the laptop mousepad. If a card is sorted correctly, the feedback shown would be ‘Correct’. If the card is sorted incorrectly, the feedback shown would be ‘Incorrect’. There was no time limit for a card to be sorted on each trial, but participants were told to answer as quickly and as accurately as possible.
After 10 cards have been successfully sorted consecutively, one set is completed and the sorting rule changes. The process continues until the participant either sorts all 128 cards or they complete 9 sets.
The following behavioural measures were obtained: proportion of correct responses, proportion of perseverative errors (incorrectly choosing a deck based on the rule from the previous set), proportion of non-perseverative errors (errors that were not perseverative), proportion of unique errors (where a deck is chosen that does not match the test card on any rule), number of trials needed to complete first set (out of 128), and number of sets completed (out of 9).
Go/No-Go task
The Go/No-Go task was programmed and presented using Psychopy148 and the design was informed by prior research149,150,151. On each trial, participants were shown the letter ‘M’ or ‘W’ in the centre of a computer monitor screen. Half of the participants were instructed to make a ‘Go’ response (via pressing the Spacebar button) when they saw ‘M’ and to withhold responding when they saw ‘W’; the remaining participants completed a version in which “W” was the Go stimulus and “M” was the No–Go stimulus. Assignment to either version of the task was based on participant ID number, wherein even-numbered IDs had “M” as the Go stimulus, while odd-numbered IDs had “W” as the Go stimulus. Responses were registered on a computer keyboard placed in front of participants on a table. Each trial began with a fixation point presented for 500 milliseconds (ms) followed by either Go or No-Go stimulus for 100 ms, and finally a blank screen. Participants were instructed to respond within 500 ms of stimulus onset. Feedback showing ‘Too slow!’ appeared after responses exceeding this timing, and ‘Incorrect’ was shown after any erroneous responses to the No-Go stimulus. No feedback was given following correct responses. The task comprised 500 trials (80% Go and 20% No-Go stimuli). Participants received a two-minute break halfway through the task.
We calculated the following behavioural measures: proportion of Go errors (incorrectly not responding to Go stimulus), proportion of No-Go errors (erroneously responding to No-Go stimulus), Go reaction times (RT, in seconds [s]) and No-Go RTs.
MRI protocol
Due to limitations in number of research participants hospital radiology units were willing to accommodate, imaging data was collected across two sites, namely Sunway Medical Centre (SunMed) and Sunway Medical Centre Velocity (SMCV), both located in Klang Valley, Malaysia. T1-weighted MPRAGE images were acquired from all participants. In SunMed, participants were scanned using a Siemens Magnetom Skyra 3-tesla (3 T) scanner with a 20-channel head coil and the following parameters: repetition time (TR) = 2110 ms, echo time (TE) = 3.52 ms, field of view (FOV) = 240 × 240 mm, slice thickness=0.94 mm, flip angle = 9°, voxel size = 0.9 × 0.9 × 0.9 mm³. In SMCV, a Signa Pioneer 3 T scanner with a 21-channel head coil and the following parameters: TR = 8.3 ms, TE = 3.40 ms, FOV = 240 × 240 mm, slice thickness = 1.00 mm, flip angle = 9°, voxel size = 0.5 × 0.5 × 1.0 mm³, was used. Given the heterogeneity in scanning parameters between sites, we controlled for ‘site’ in all MRI analyses.
Data processing was performed using SPM12 release 6685 (Wellcome Department of Imaging Neuroscience, London, UK1) implemented in MATLAB R2022b (Mathworks Inc., Natick, MA, USA). All data were manually reoriented and co-registered to the Montreal Neurological Institute 152 (MNI152) template.
Data were then processed using voxel-based morphometry, specifically segmentation and normalisation were conducted via the Diffeomorphic Anatomical Registration, using the Exponential Lie algebra algorithm (DARTEL) technique152. Default parameters were used in SPM during segmentation except that affine regularisation was performed using the template for East Asian, instead of European, brains. Grey matter (GM), white matter (WM), and cerebrospinal fluid (CSF) tissue maps were used to create a custom template based on the larger sample of 397 participants. For each participant, flow-fields were computed during template creation to provide the transformation matrix from each native image to the template. Normalisation was applied to align and warp each participant’s data to the DARTEL-created template, while smoothing was conducted using an 8-mm full width at half maximum (FWHM) Gaussian kernel to remove potential artifacts and account for imperfect alignment of brain data from different participants. We computed the total intracranial volume (ITV) from GM, WM, and CSF tissues obtained during the segmentation step as a metric to be included as a nuisance regressor in later regression models to control for individual differences in overall ITV.
Imaging data were subjected to both whole-brain and region-of-interest (ROI) analyses. To understand brain-Go/No-Go performance relationships we defined the following ROIs: bilateral insula62, inferior frontal gyrus62, supplementary motor area (SMA)63,153. For the WCST, the ROIs comprised the bilateral prefrontal cortex (PFC)12 and dorsolateral (PFC)83. We also defined the following ROIs: bilateral hippocampus48, amygdala4, and cerebellum3, based on previous literature reporting reduced GMV in these regions being associated with poor cognition in aging populations. All ROIs were selected a priori. Bilateral anatomical masks for each region were created in WFU-PickAtlas154. The Talairach Daemon atlas was used to create a cerebellum mask, the Automated Anatomical Labelling atlas was used to create a SMA mask, while the Brodmann atlas was used to create masks for all other ROIs.
BrainAge
We applied a pre-trained machine learning pipeline (brainageR) to predict the ages of our participants31. BrainegeR was utilised as it consistently outperforms other brain-age models on accuracy and test-retest reliability155,156. Using SPM12, brainageR first segments the T1 scans into GM, WM, and CSF probability maps and then conducts normalisation. Subsequently, in R language, these normalised probability maps are concatenated into one vector and principal component analysis (PCA) is conducted. A Gaussian process regression model is then used to predict brain-age using the first 435 components from the PCA. The model was previously trained on a sample of 3377 healthy individuals (range 18–92 years) from seven publicly available datasets.
Each participant’s age was subtracted from their predicted brain-age (BrainAge–ActualAge) and then inserted as a predictor variable in regression models, whereby more positive values signify advanced brain-age relative to chronological age.
Statistical analysis
WCST reinforcement learning model
A reinforcement sequential learning model11 was fitted to trial-by-trial WCST data.
The full model contained four free parameters, namely the reward rate (r, how quickly attention weights change to rewarding feedback), punishment rate (p, how quickly attention weights change to punishing feedback), decision consistency (d, how much deck choice is influenced by attention weights), attentional focusing (f, only important on trials with ambiguous feedback and represents the degree to which the update is focused only on the category/rule with the largest attention weight).
The dependent variables put into the model are 1) an outcome variable which represents whether a trial was rewarded or not (1 or 0) and 2) a matching matrix which quantifies which categories (colour, number, or shape) associated with a chosen deck match the test card. For instance, if the chosen deck matched the test card based on colour but not number or shape, the matching matrix, m, for that trial would be defined as
The model calculates the probabilities associated with choosing each deck as a function of attention weights (a), which represents the weight/value given to each category per trial. The matrix elements of the attention signal always sum to one. It was assumed that for each participant’s first trial, the attention weights are divided evenly between categories:
Attention weights are updated using a feedback signal (s), which represents whether the categories were rewarded or not. For example, in the case where a chosen deck matches the test card based on only colour and nothing else, and the trial is rewarded, the feedback signal would look like this,
with each element of s representing colour, number, and shape respectively. The current attention weights are updated based on the feedback signal according to the following equations:
where t refers to the current trial. Parameters r and p determine how rapidly attention weights alter based on rewarding and punishing feedback signals, respectively.
In the example above, the feedback is unambiguous as the chosen deck matches the test card on only one category. However, in some cases where more than one category is matched (for example, both colour and shape), the feedback signal relies on the free parameter f to modulate how focused or wide the attention is for each category’s feedback. When f approaches 0, attention is split evenly between the matching categories:
As f increases, the feedback signal is split proportionally between current attention weights. For example, if the attention weight for colour is higher than shape, the feedback signal would follow suit and perhaps be represented by:
The following equations represent how the feedback signal is modulated by the attention weights and the matching matrix.
When outcome on the current trial is correct, the feedback signal is computed only with the matching attention weights, and when the outcome is incorrect, only the non-matching attention weights contribute to the feedback signal.
Finally, the probability of choosing a specific deck is defined as
where the d parameter influences the predicted probability of choosing a deck per trial. As d becomes lower, choices become more random and less dependent on attention weights (more exploratory). As d becomes higher, choices are heavily constrained by attention weights (more exploitative). ({{bf{m}}}_{t}^{{prime} }) is simply the matching matrix, ({{bf{m}}}_{t}), transposed to enable matrix multiplication (dot product) with ({{boldsymbol{a}}}_{t}).
The full model was compared to four degenerate models. Each degenerate model had one parameter fixed to assess the contribution of each parameter to capturing behaviour on the task.
The 1st alternative model (rpd0) fixed the f parameter to be 0, the 2nd model (rpd1) fixed f to be 1, the 3rd (rp1f) fixed d to be 1, and the 4th alternative model (rrdf) assumed a single common learning rate for both reward and punishment.
Model code was adapted from a prior study12.
We assumed Beta (0,1) distributions as priors for all free parameters12. Parameters r and p naturally varied between 0 and 1 while d and f were rescaled to range between 0 and 5.
Computation of posteriors per parameter were conducted using a Bayesian approach via Markov Chain Monte Carlo (MCMC) sampling implemented in JAGS157 software. Four randomly initialised MCMC chains were run during model-fitting. Convergence of chains was confirmed using the potential scale reduction statistic R̂. A cut-off R̂ value of 1.2158 was used to check that the chains were well-mixed for each parameter.
We evaluated model fit using the Deviance Information Criterion (DIC), which is typically used in Bayesian model selection, and takes accuracy and model complexity (number of free parameters) into account131. We also computed the penalised deviance159 which penalises model complexity more stringently than standard DIC. The lower the DIC and penalised DIC, the better the model fit.
Go/No-Go drift diffusion model (DDM)
DDM assumes that fast two-choice decisions (in the case of Go/No-Go, the decision to either respond or withhold responding) are made via a stochastic process where information is accumulated over time. After a stimulus is encoded, the point at which the decision process begins is determined via a starting point parameter (z) wherein higher z values indicate preponderance for responding (Go) while lower z values reflect a bias for not responding (No-Go). From the starting point, the decision process drifts (in random walk motion) between the upper boundary (respond) and a lower implicit boundary (withhold responding, denoted by 0). The rate at which a participant accumulates evidence to reach a decision is determined by the drift rate v. The better the information quality or the more efficient one’s ability to accumulate evidence, the greater the values of v. When the decision process reaches either one of the boundaries, a decision is finally made. The distance between upper and lower boundaries is denoted by a boundary separation parameter (a) where larger a-values indicate higher emphasis on accuracy while smaller a-values reflect valuing speed over accuracy. Reaction times (RT) from trial-to-trial are assumed to be determined by the sum of the decision times and non-decision times. The non-decision time parameter (Ter) stipulates time taken up by processes peripheral to decision-making including stimulus encoding and execution of a motor response.
Four drift diffusion models were fitted to trial-by-trial Go/No-Go choice and RT data using the Hierarchical Bayesian estimation of the Drift Diffusion Model160 (HDDM) toolbox. Trials with reaction times below 0.1s were removed before model-fitting151. RTs during non-responses for both Go and No-Go trials were coded as not a number (NaN).
Model 1 assumed separate drift rates for Go (v.go) and No-Go (v.nogo) trials, as well as z, a, and Ter parameters that were free to vary. Model 2 was akin to the first model except z was fixed at 0.5 indicating no bias in starting point between upper and lower boundaries. Model 3 was also like Model 1 but with only a single drift rate (v) capturing evidence accumulation across all Go and No-Go trials. Model 4 was like Model 3 except that z was fixed to 0.5. Such variations of models have been explored and compared in prior research161. For models with separate drift rates for Go and No-Go trials, HDDM output a drift scaling parameter (dc) which was subtracted from v per participant to obtain v.nogo, and added to v per participant to obtain v.go.
Model-fitting was conducted using the G-square approach (optimisation set to ‘gsquare’ in HDDM), based on χ2 optimisation, where the Go/No-Go data are fitted based on RT quantiles13,14. The RT distributions for responses to Go and No-Go stimuli were represented by the 0.1, 0.3, 0.5, 0.7 and 0.9 quantiles, while non-responses were represented by a single bin as there are no observable RTs. We assumed 5% outliers103 in our data which were modelled under a different process (outliers in HDDM are modelled using a uniform distribution160). Model-fitting using Gsquare was conducted following a freely available tutorial (“Fitting go/no-go using the χ2 approach”: https://github.com/hddm-devs/hddm/blob/master/hddm/examples/gonogo_demo.rst) and has been applied in prior work103,162.
The Bayesian Information Criterion (BIC), which can be readily calculated in HDDM, was used to select the best-fitting model (the lower the BIC value the better the fit). The BIC penalises model complexity better than other model-comparison metrics (e.g., Akaike Information Criterion)163.
Parameter recovery
As the drift-diffusion model we used had been previously validated on a different version of the Go/No-Go task162, we conducted parameter recovery15 to assess the validity of generated model parameters from our Go/No-Go task data. The best-fitting model was used to simulate Go/No-Go data from 500 “participants” using built-in HDDM functions. Free parameters (i.e., a, v, Ter, z, dc) were replaced with the mean fitted parameter values estimated from fitting the model to human participant data. We then fit the winning model to the simulated data and checked whether we could recover the mean parameter values. Parameter values for each simulated participant were plotted against the means of the true parameter values (see Fig S1 in Supplementary Materials).
Parameter recovery for the WCST was not run as the winning model on the same task had already been fully validated in a previous study12.
Principle component analysis (PCA) of cognitive data
We obtained profiles of cognitive performance separately for WCST and Go/No-Go data using a data-driven approach. All performance measures across participants were z-scored and subjected to an exploratory PCA using the psych164 library in R. Advantages of utilising PCA are that the technique decomposes the original data into corresponding principal components (PCs) that are orthogonal to each other and enables capture of independent features of the data. We included both standard (model-free) performance measures alongside computational model parameters (see correlations in Tables S8.1 and S8.2) in the PCAs to facilitate interpretability of resulting cognitive profiles by elucidating how different measures load onto each other. In fact, this method has been used in prior research to guide interpretation of computational model parameters across different reinforcement learning tasks165. PCs were extracted based on visual inspection of the screeplot and the Kaiser’s criterion (eigenvalue > 1). From these results, a 3-factor structure was used for Go/No-Go and a 4-factor structure for WCST. Promax rotation was used for both PCAs. Resulting loading patterns were inspected in each PC and interpreted. Scores per participant for each PC were extracted and used in further analysis.
GMV analysis
To understand how cognitive profiles and computational parameters correspond to grey matter morphology, we entered the profiles and parameters into multiple general linear models (GLM) in SPM12, with whole brain and ROI GMV as dependent variables. Age, gender, ethnicity, MRI scanning site (to account for effects of using multiple scanning sites during acquisition166), and intracranial volume were inserted into the models as covariates of no interest. For whole brain analysis, an absolute implicit mask with a recommended threshold value fixed at p > .02 was used167. Otherwise, for ROI analysis, predefined masks were used (see MRI data acquisition and processing protocol above). To assess the independent effects of cognitive profiles on GMV, we entered the PCs one-by-one into the GLMs. We also obtained whole-brain and ROI maps for contrasts between PCs (e.g., PC1 > PC2). Relationships between GMV and PC/parameter values if they exceeded a voxel-wise threshold of p < 0.05 family-wise error (FWE) corrected, and reached a minimum cluster size of 20 voxels3. Resulting coordinates of brain maps were labelled using a freely available toolbox in R (label4MRI, GitHub – yunshiuan/label4MRI: Label the brain MNI coordinate by AAL/BA system).
Factor analysis of survey variables
Next, we sought to analyse how demographic, SES, health, and lifestyle factors (see Table S1 for complete list) may contribute to variations in cognitive profiles. We also included the verbal fluency test score from the MOCA as verbal fluency or intelligence is reported to be a robust measure of cognitive reserve in older adults33. To prepare the questionnaire data for this analysis, we imputed any missing data using a principal component method called ‘factor analysis for mixed data’ implemented via the ‘imputeFAMD’168 function in R. The method is suitable for mixed (categorical and continuous) data and uses the similarity between individuals and relationship between variables (from conducting factor analysis) to predict missing values168.
Following this, we aimed to a) conduct dimensionality reduction of the data due to the volume of questionnaire items, and b) understand specific constructs that the different questionnaire variables contribute to and how they are interlinked. For these purposes, an exploratory factor analysis with five factors (based on Scree plot inspection) using promax rotation was performed on the questionnaire measures. The ‘factanal’ function in R was used. Prior to this, the Kaiser–Meyer–Olkin (KMO) Measure of Sampling Adequacy and Bartlett’s test of Sphericity were conducted to ascertain appropriateness of factor analysis on this dataset. All variables were z-scored before being entered into the factor analysis. A loading score of ±3.0 was used as a threshold for determining whether a questionnaire variable significantly contributed to a factor169.
Linking brain and sociodemographic factors to cognitive profiles
Multiple multivariate GLMs were conducted with the questionnaire factors, Brain Age – Actual Age, and total GMV as predictor variables, and the cognitive profiles as dependent variables (z-scored). All models controlled for gender, age, and ethnicity. Holm (family-wise error rate) corrected p-values were computed to correct for multiple comparisons.
To test the robustness of the linear models, we employed ridge regressions with 10-fold cross validation. Moderate correlations and collinearity (determined via variance inflation factor) between predictor variables confirmed that ridge regressions were appropriate. The ridge regressions divided the sample into 10 groups and trained the models on 9/10th of the data and tested the model on the final 1/10th of the data enabling out-of-sample coefficient estimates and R-squared values. In addition, this method performs L2 regularisation where the penalty term λ penalises large coefficients and prevents overfitting. Another advantage is that coefficient estimates are shrunk towards 0 which reduces the impact of irrelevant features on model prediction and enables greater interpretability.
Predictor variables were deemed ‘significantly’ associated with cognitive profiles if GLM-computed p-values and confidence intervals indicated significance, and if coefficients output by the ridge regressions were suitably greater than 0 (coefficient > 0.01).
All tests reported here were two-tailed with p < 0.05 indicating significance.
Mediation models
To understand potential pathways linking sociodemographic factors to cognition, we implemented causal linear mediation analyses using GMV, WMV, BrainAge–ActualAge, and volumes of predetermined regions of interest as mediators. The ‘mediation’ package in R was used170 to compute the average direct effects (ADE) and average causal mediation effects (ACME) of sociodemographic factors on cognitive profiles via pathways of brain structural patterns. ADE and ACME were calculated using default settings in the ‘mediation’ package, i.e., quasi-Bayesian Monte Carlo method based on normal approximation with 1000 simulations.
Responses