Prenatal exposure to undernutrition is associated with a specific lipid profile predicting future brain aging

Introduction
It is increasingly acknowledged that the foundations for brain functioning in later life are laid down early in life1,2,3. An adverse fetal environment may hamper brain development with long-lasting effects on brain structure and function and potential impact on the risk for dementia in older age. Animal models have demonstrated that early-life adversity affects the age of onset and progression of Alzheimer’s Disease (AD)-related neuropathology as well as cognitive decline4,5. In line with this evidence, a recent systematic review of literature from studies in humans showed that factors like prenatal exposure to famine, a lower as well as higher birth weight, and birth in a generally less optimal environment (e.g., high infant mortality area) were associated with an increased risk for dementia in older age6.
We have previously shown that men and women who were exposed to the Dutch famine, specifically during early gestation, performed worse on a measure of selective attention (a computerized Stroop task) at the age of 58 years, one of the first cognitive abilities to decline with increasing age, whereas there were no differences observed in tests for general intelligence, memory, and perceptual motor learning7. Men exposed to the famine in early gestation were also shown to have smaller brain volumes and worse overall brain perfusion8,9. In addition, resting-state fMRI scans suggested a pattern of network desegregation fitting with brain aging in men and a more diffuse pattern of group differences in women exposed to famine in early gestation10. Finally, we found evidence for premature aging of the brain in men exposed to famine in early gestation as their brains were characterized by a higher BrainAGE10. BrainAGE is a measure of the estimated age of the brain, based on structural MRI data, compared to a healthy brain model for that particular chronological age, and a predictor for cognitive decline and conversion to AD (for an overview of this concept, see ref. 11)12,13. These findings in participants of the Dutch famine birth cohort have been corroborated by extensive pre-clinical evidence showing in rodents that exposure to stress or undernutrition during the perinatal period leads to cognitive impairments (e.g., attention, learning, and memory) in adulthood and in aging and influences vulnerability to AD4,5. In addition, a non-human primate model in which moderate nutrient restriction was applied to pregnant baboons from early to mid-gestation, showed that exposed male offspring exhibited impaired learning and attentional problems and exposed female offspring displayed premature aging of the brain at a relatively young age14,15.
Importantly, there is evidence that individuals exposed to early-life adversity might present a different biological landscape in the face of a disorder compared to peers with similar disorders, as well as a different sensitivity to treatment16. These differences call for the importance of being able to identify the individuals at risk. A blood-based biomarker could act as a screening tool to identify at-risk individuals, offer personalized treatment, and stratify the population in clinical trials of individuals who have experienced early-life adversity.
Recent studies have suggested that changes in blood lipid profile may be related to the pathogenesis of neuropsychiatric as well as neurodegenerative diseases such as depression, schizophrenia, and AD17,18,19,20,21,22. Lipids constitute approximately half of the dry weight of the brain and are implicated in important brain functions, including membrane composition, signal transduction, and biological messenger functions, in addition to physiological processes such as energy metabolism and neuroendocrine function23. There is epidemiological evidence showing that altered blood levels of cholesterol, triglycerides, and fatty acids are associated with higher risks of cognitive impairment and dementia24,25. While the exact relationship between lipid metabolism, brain aging and cognitive functions remains poorly understood at the system level, lipidomics is emerging as a potentially important tool for providing biomarkers in relation to the diagnosis of cognitive dysfunction26,27. Lipidomics is an approach that allows a comprehensive investigation of hundreds of lipids and may advance our understanding of the global dysregulations of lipid metabolism in relation to brain aging and cognitive dysfunction and might offer the opportunity to identify the vulnerable populations exposed to early-life adversity at higher risk of cognitive decline and dementia. We have recently shown that early-life adversity leads to lasting alterations in the brain lipidome profile in mice, and we have previously shown that men and women exposed to famine in early gestation had higher LDL:HDL cholesterol ratios at ages 50 and 58 and higher total cholesterol levels at age 58 years28,29,30. These findings suggest that the lipidome may be affected by prenatal undernutrition, especially during the first trimester.
In addition to lipidomics, another interesting biomarker candidate is leptin. While leptin is usually studied for its role in energy intake and expenditure, leptin also plays an essential role in many neurocognitive processes31. During recent years leptin dysregulation has been linked to altered cognitive functioning and increased risk for AD32,33 and there is evidence from both human and animal studies that exposure to early-life adversity leads to lastingly altered circulating leptin concentrations34,35. Notably, we have previously shown that prenatal undernutrition is associated with higher glucose and insulin levels36. As both insulin and leptin play an important role in glucose regulation, altered leptin levels after prenatal exposure to undernutrition may be expected as well37,38,39.
If and how early-life adversity impacts the peripheral lipidome profile and leptin concentrations on the long term and how this relates to cognitive decline and aging of the brain has not yet been investigated. The Dutch famine birth cohort provides the unique opportunity to study this with prenatal exposure to famine as a specific form of early-life adversity37,38. Therefore, in the present study, we focused on lipid metabolism as well as plasma leptin concentrations after prenatal undernutrition (at age 58) and their association with cognitive function (at age 58) and aging of the brain 10 years later (at age 68). We applied random forest machine learning (ML) approaches to study the lipidome in participants of the cohort. As these analyses require a substantial number of subjects and our group of participants exposed to famine in early gestation, who exhibited the most adverse lipid outcomes as well altered structural and functional brain outcomes, was relatively small (n = 75 of whom 32 men and 43 women), we ran the ML analyses across the combined exposure groups (exposed in early, mid or late gestation) and compared those exposed to famine, during any stage of gestation, to those unexposed to famine during gestation. Based on these results, thereafter, we tested differences in individual lipid species between those exposed to famine in early, mid or late gestation compared to those unexposed. In addition, given our previous findings regarding sex-specific effects of prenatal famine exposure, we also tested these in men and women separately.
Results
General sample characteristics
We included a total of 801 participants of which we had either valid lipidomic and leptin measurements (n = 770) or only valid lipidomics (n = 6) or leptin (n = 25) assessment. Table 1 shows general characteristics, birth and clinical outcomes according to famine exposure in early, mid or late gestation. As described in previous publications, the LDL:HDL ratio was higher and Stroop performance was lower for those exposed to famine in early gestation compared to those unexposed,28,29. Similarly, BrainAGE was higher for men exposed in early gestation (B = 2.7 years, 95% confidence interval −0.3–5.7, p = 0.08),10.
General description of the lipidome
The analytical pool for discovery comprised 259 lipids belonging to 11 classes: (i) apolar species, including diglycerides (DGs, n = 42), triglycerides (TGs, n = 69), free cholesterol (Chol) and cholesterol esters (CEs, n = 12), and (ii) polar (structural) species, including phosphatidylcholines (PCs, n = 55), phosphatidylethanolamines (PEs, n = 25), phosphatidyl-inositols (PIs, n = 3), phosphatidylserines (PSs, n = 4), lysophosphatidylcholines (LPC, n = 12), lysophosphatidyl-ethanolamines (LPEs, n = 2), sphingomyelins (SMs, n = 28) and ceramides (Cers, n = 7).
Prenatal famine exposure and lipidomics
Lipid profile
We determined if the lipid profile of individuals exposed to famine during any stage of gestation differed from unexposed individuals. When we compared all unexposed against all exposed individuals using a random forest model trained on 70% of the data and tested on the remaining 30%, we identified differences in the lipid profiles. The generated model, achieving a modest classification accuracy, correctly predicted the identity of 127 of the 198 samples (64.1%). From this model, we were able to identify five lipids that were responsible for over 95% of the classification achieved by the model (Fig. 1). These lipids were three PEs (PE-O(36:3), PE(40:3), and PE-P(40:7)) and two CEs (CE(20:2) and CE(18:3)), which were taken forward for further analysis.

A Variable importance plot of lipids responsible for driving classification of prenatal famine exposed versus non-exposed individuals. B ROC curve showing diagnostic ability of random forest model.
Individual lipid species
Univariate analysis showed that the five lipids identified by the generated random forest model had abundances that were significantly different (p < 0.05) when we compared those exposed in early, mid or late gestation to those unexposed to famine in utero (Table 2, all models corrected for covariates (sex, age, BMI, HDL, Triglycerides, ApoE4)). The only exception was CE(18:3) of which the abundance did not significantly differ between those exposed in mid-gestation and those unexposed. When controlling for type 1 errors, the following differences remained: the abundance of PE-P(40:7) was significantly higher in those exposed to famine in late or mid-gestation, PE-O(36:3) was significantly lower in those exposed in mid or early gestation, and CE(18:3) was significantly higher in those exposed in early gestation compared to the abundances in individuals unexposed to famine during gestation.
Additionally, looking at men and women separately showed ORs of similar size and direction as the ORs resulting from the grouped analysis, with some small deviations (Table 3).
Lipid profile, cognitive performance and BrainAGE
None of the five lipids responsible for driving the random forest model of prenatal famine exposure were associated with Stroop task performance in men nor in women (Table 4). Several of the lipids were associated with leptin levels and predictive of BrainAGE 10 years post-sampling. In women, CE(18:3) and CE(20:2) levels were significantly negatively associated (p < 0.05) with BrainAGE. In men, PE-O(36:3) and CE(20:2) were negatively associated (p < 0.05) with BrainAGE.
Prenatal famine exposure and leptin
Plasma leptin concentrations did not significantly differ according to prenatal famine exposure (see Table 5). Looking at men and women separately also did not result in statistically significant differences between exposed and unexposed groups.
Lipid profile, leptin, cognitive performance and BrainAGE (independent of prenatal famine exposure)
Lipidomics, cognitive performance and BrainAGE
Using a random forest model, we showed that there was no association between lipid profile and Stroop performance (Fig. S1). We next explored the relationship between lipid profile and BrainAGE using a predictive random forest model in which lipid data as well as age, sex and BMI were set as our x-variables and BrainAGE as the y-variable. The calculated model showed a significant relationship between the actual measured BrainAGE 10 years after blood sampling and the BrainAGE predicted by the model (r = 0.53 and p = 3.0 × 10⁻³, Fig. 2). Of the 10 variables most responsible for driving the models’ predictive performance (>95% model performance), five were LPCs. Considering that the LPCs account for only 12 of the 259 total lipids, having five LPCs driving the predictive model represents an enrichment of 1084% over the number of lipids we would expect to see in the top 10 by chance. Univariate analysis of the top 9 lipid variables that could predict BrainAGE showed that six were significantly associated with BrainAGE (p < 0.05) after correcting for covariates (Table S2), although none were significant after controlling for type 1 errors.
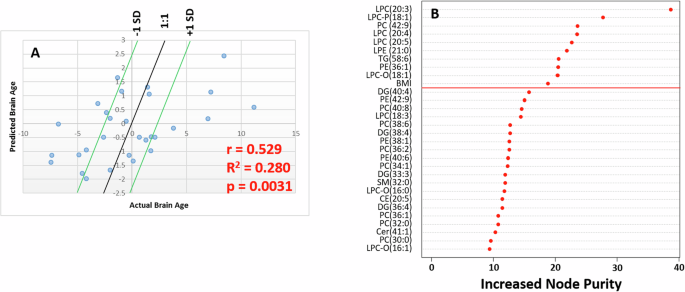
A Scatter plot of actual BrainAGE against predicted BrainAGE in an independent test set. B Variable importance plot of lipids responsible for driving the random forest model used to generate the predictions in A.
Leptin, cognitive performance and BrainAGE
There was a negative association between leptin concentrations and performance on the Stroop task, but this association was fully explained by sex with women exhibiting higher levels of leptin and lower levels of Stroop task performance. There was no association between leptin and BrainAGE. Leptin concentrations did thus not seem to relate to cognitive function or BrainAGE.
Discussion
In the present study, we tested for the first time the long-term associations between exposure to famine during gestation and the lipidome profile of the blood as well as levels of plasma leptin at age 58 and the relationship of these measures to cognitive function (based on Stroop task performance) at the same age as well as to BrainAGE (an MRI-based measure of the biological age of the brain) 10 years later. We found a signature of five lipids that identified individuals who had been exposed to famine in utero. Of these five lipids, PE-P(40:7) was significantly higher in those exposed to famine in late or mid-gestation, PE-O(36:3) was significantly lower in those exposed in mid or early gestation and CE(18:3) was significantly higher in those exposed in early gestation compared to those unexposed to famine in utero. While the five lipids did not correlate with performance on the Stroop task, three of the five lipids were predictive of the BrainAGE 10 years later. In addition, the lipid profile, independent of prenatal famine exposure, was able to predict BrainAGE without correlating with cognitive function at the same age. As to leptin, there were no significant associations with prenatal famine exposure, Stroop performance or BrainAGE.
Lipidomics is a rapidly evolving field, and with our approach, in contrast to other commonly used platforms, we were able to detect also rare species such as specific PEs. This is a first time in humans that such detailed lipid profile is studied in relation to an early-life exposure approximately 60 years earlier and later life cognitive and brain outcomes. Due to a large variation in the field of lipidomics in terms of details of such molecular characterization and our unique study design, placing our findings in the context of existing literature is challenging. However, we will discuss 1) the possible relevance of these lipids as biomarkers of early-life exposures and predictors of age-related decline in brain structure and function; 2) the possible functional role the identified lipids might play in the observed deficits; 3) the absence of relations between leptin and prenatal famine exposure, cognitive and brain outcomes that we observed; 4) the strengths and weaknesses of our study.
A specific lipid profile could be identified that characterized participants prenatally exposed to famine compared to unexposed participants. This was mainly due to five lipid species of which the abundance differed between the exposed and unexposed groups. PE(40:3) and PE-P(40:7) were more abundant in the exposed group and PE-O(36:3), CE(20:2) and CE(18:3) were less abundant. The differences we observed in these lipid species between the exposed and unexposed groups appeared to be roughly similar for those exposed in early, mid or late gestation, also when split up according to sex. We have previously shown that LDL, total cholesterol and LDL:HDL ratio levels predominantly differed between those exposed to famine in early gestation and those unexposed to famine28,29. The fact that we did not confirm this specific gestational effect in the current study, is probably due to the reduced power due to the statistical choice of combining all the exposed groups in the first step of the analysis applying Random Forest modeling, while in the earlier study, we were able to keep the exposure groups separated. Interestingly though, three of the five lipids (CE(18:3), CE(20:2) and PE-O(36:3)) predicted BrainAGE 10 years later and the latter two lipids also differed significantly in men exposed to famine in early gestation who were also previously shown to have higher BrainAGE compared to unexposed individuals10.
There are several pathways by which prenatal undernutrition may affect the lipid profile in later life. Plasma lipid levels are affected by lifestyle factors such as diet and physical activity. We have previously shown that the individuals in our cohort exposed to famine in early gestation were twice as likely to consume a high-fat diet and had a tendency to be less physically active29. Prenatal famine exposure may have programmed food preferences and physical activity behavior, thereby indirectly affecting the lipidome. Alterations in lipid profiles may have also been the result of the programming of set points of lipid metabolism by prenatal famine exposure. For example, the composition of the maternal diet during pregnancy in rats has been shown to influence the activity of hepatic enzymes that are involved in cholesterol metabolism in the offspring and Khaire et al. proposed that it is specifically a good balance between certain micronutrients, such as folic acid and vitamin B12, and fatty acids in the maternal diet that is critical for optimal programming of lipid metabolism40. These micronutrients and fatty acids interact in the one-carbon metabolism cycle, which, amongst others, is involved in lipid biosynthesis and methylation reactions. Shortages or imbalances in maternal levels of folic acid, vitamin B12 and fatty acids may influence the fetal lipid metabolism through various mechanisms including PE-N-methyltransferase activity, peroxisome proliferator-activated receptor, adiponectin signaling and epigenetic processes like chromatin methylation40. Interestingly, we have previously shown that supplementing early-life stress-exposed mice with micronutrients such as Vitamin B12 and folic acid early on, protects the animals from developing cognitive impairments41. Unfortunately, we have no information on the composition of the maternal diet with respect to micronutrients and fatty acids in our study population, however, the famine is likely to have had an adverse effect on diet composition and may thus have programmed lipid metabolism in exposed participants in a form as suggested by Khaire et al40.
As this is the first study to relate early-life adversity exposure in humans to the lipidome in late life, we cannot say if the lipid profile that we found to be associated with prenatal famine exposure is specific to this type of exposure (prenatal and nutrition related) or may be generalizable to other early-life exposures (perinatal, postnatal, stress-related). If future studies would show generalizability of the lipid profile that we identified to be related to early-life adversity, the lipid profile could serve as a biomarker for such exposure and predict accelerated aging of the brain. It has been shown that the pathophysiological processes, which lead to aberrant brain aging and dementia disorders begin more than 20 years before clinical symptoms can be observed42,43. This provides a window of opportunity for finding interventions, which can slow or even prevent the progress of brain aging and dementia disorders. The early-life adversity-related lipid profile may then serve as a starting point for potential intervention. In fact, we have recently shown in an animal model that early-life adversity exposure in mice leads to long-term alterations in the brain lipidome profile and that supplementing mice exposed to early-life adversity early in life with a diet enriched in omega 3 fatty acid was able to rescue the early-life adversity induced alterations in brain fatty acid composition, the long-term cognitive decline and the associated alterations in brain plasticity suggesting that alterations in lipidome profile might contribute to cognitive deficits and increased risk to dementia and that these might be modifiable via dietary interventions30,44.
We showed that PE(40:3) and PE-P(40:7) were more abundant in the prenatal famine-exposed group and PE-O(36:3), CE(20:2), and CE(18:3) were less abundant than in the unexposed group. Interestingly, the less abundant lipids were also shown to be able to predict BrainAGE 10 years later. In women, lower levels of CE(18:3) and CE(20:2) predicted a higher BrainAGE, while in men, lower levels of CE(20:2) and PE-O(36:3) predicted higher BrainAGE over a follow-up period of 10 years.
CEs are the product of esterification, the process by which cholesterol is converted to neutral CEs either for storage in lipid droplets or for secretion as constituents of lipoproteins45. PEs are abundant membrane phospholipids that are essential for membrane integrity, cell division, and maximum mitochondrial respiratory function46. Both PEs and CEs have been shown to be altered in relation to aging of the brain, cognitive decline and AD27,47,48,49,50,51,52, which is in line with our finding that CE(18:3), CE(20:2) and PE-O(36:3) predicted the BrainAGE of the participants measured 10 years later. In particular, CE(20:2) belongs to the group of polyunsaturated fatty acids (PUFAs). The incorporation of n-3 PUFA in plasmalogens has been related to cognition and the prevention of cognitive decline53. It has also been shown that the n-3 PUFA status affects n-6 PUFA status54. If and how the cholesterol esters of n-3 and n-6 PUFAs affect the concentration of plasmalogen with these PUFAs will need further research.
The lipids were not related to performance on the Stroop task, which was measured at the same time as the lipids. This could be interpreted in various ways. The specific lipids that we identified may be unrelated to cognitive function; or they may be predictive of cognitive decline in the future, which we did not investigate in the present study but was demonstrated by a recent study27; or they may relate to cognitive functions other than what is measured by a Stroop task (cognitive inhibition and selective attention).
In addition, we could show that there was a set of lipids unrelated to prenatal famine exposure that was also able to predict BrainAGE 10 years later. Lysophosphatidylcholines (lysoPCs) were dominant in this random forest model of BrainAGE. LysoPCs have been shown to play a crucial role in transporting fatty acids across the blood-brain barrier55,56. Furthermore, it has been demonstrated that arachidonic acid (lysoPC(20:4)) as well as eicosapentanoic acid (lysoPC(20:5)), both in our lipid set that predicted BrainAGE, are beneficial for cognitive function57,58. Our findings seem to confirm previous evidence that lysophosphatidylcholines may serve as predictors of brain aging59.
Although previous animal work from our group demonstrated that early-life adversity leads to lastingly altered plasma leptin concentrations, which was in line with evidence for altered leptin metabolism in maltreated children33,34, we did not find evidence for an association between prenatal exposure to undernutrition and leptin levels in later life in the present study.
Plasma leptin concentrations were not associated with performance on the Stroop task or with BrainAGE 10 years later. As mentioned above in relation to lipids, the Stroop task may measure cognitive abilities (selective attention, cognitive inhibition) that are unrelated to leptin levels. Leptin levels have been associated with cognitive abilities such as learning and memory possibly through the effect of leptin on hippocampal functioning60. Similarly, BrainAGE is a reflection of the structural aging of the brain. Leptin may show stronger associations with specific functional brain aging parameters, such as memory decline.
This study has some clear strengths and limitations. The major strength is that the cohort specifically allowed investigation of the effect of prenatal exposure to famine on the long-term outcomes in lipid metabolism. Although our study is observational, the quasi-experimental set up provided by the situation of the 5-month famine that struck a population receiving adequate nutrition before and after the famine allows a unique opportunity to examine potential effects of an early-life exposure on the late life lipid profile. The samples were collected 58 year post exposure and the estimation of BrainAGE 10 years later also allowed us to study the potential predictive power of the lipid profile for aging of the brain.
The first limitation of the study is the long time span between exposure and outcome, which stretches almost 60 years. To be noted, there are many other factors that participants have been exposed to during this stretch of time, including childhood, lifestyle and socio-economic factors, that may have influenced the relationship between prenatal exposure to famine and the lipidome as measured at age 58, which we have not taken into account here. Another important limitation to our study was the relatively small size of our study groups. One of the strengths of the design of the Dutch famine birth cohort, is that it allows investigation of exposure to undernutrition during specific stages of pregnancy. Indeed, we have shown in our previous studies that effects of prenatal famine exposure on health in later life depend on timing of the exposure during gestation. Exposure to famine specifically in early gestation was associated with an increased cholesterol levels, poorer Stroop task performance and a higher BrainAGE in men7,10,28. However, the small size of the gestation-specific groups forced us to pool these exposed groups when applying Random Forest modeling, limiting us in finding gestation-specific associations. Another limitation was that BrainAGE was only measured in a subsample of the cohort (n = 99), resulting in limited statistical power to detect associations. Also, the subsample may have been hampered by potential selection bias, as the more healthy members of the cohort participated in this study. Also, we used Stroop task performance as a measure of cognitive function. We have previously shown that Stroop performance was worse in those exposed to famine in early gestation compared to controls at age 587. However, the Stroop task measures only some aspects of cognitive function, such as selective attention and inhibition. We have previously also investigated general intelligence, memory and perceptual motor learning, which were not shown to be different upon exposure to prenatal famine, and there are many other aspects of cognitive function that we have not measured. A more complete characterization of cognitive function would have allowed us to investigate whether the lipid profile associates with cognitive functions other than these specific aspects. It is also important to note that the lipids were measured from venous blood samples and may not be the same as the levels circulating in the brain, although recent evidence suggests that early-life adversity was also associated with lipid levels in the brain61. Further validation of our observations in an independent cohort is needed before these blood lipids could be postulated as candidate biomarkers of early-life adversity exposure and future aging of the brain.
In conclusion, this study suggested that prenatal exposure to famine may have a lasting effect on the lipid profile including cholesterol esters and phosphatidylethanolamines as lipid classes of importance in both men and women. The resulting lipid profile was predictive of BrainAGE 10 years later suggesting its possible use as a biomarker of early-life exposure and of future BrainAGE. Contrary to expectations, we did not find evidence for a relationship between prenatal famine exposure, leptin and cognitive function, and brain aging.
Materials and methods
Study participants
Study participants were members of the Dutch famine birth cohort, a historical cohort of 2414 men and women born as term singletons in the Wilhelmina Gasthuis, a local hospital in Amsterdam, the Netherlands, between 1 November 1943 and 28 February 1947. The selection procedures of the cohort have been described in detail elsewhere36,37. Data were collected between 2002 and 2004 and between 2012 and 2013. The 2002–2004 study comprised a visit to the clinic to which all eligible cohort members were invited7. The 2012–2013 study comprised a subsample study to which 151 cohort members were invited after random selection from the cohort8. The 2002–2004 and 2012–2013 studies were both approved by the local Medical Ethics Committee of the Amsterdam Medical Center and conducted according to the Helsinki Declaration. All participants gave written informed consent.
Exposure to famine
The official daily food-rations for the general population of 21 years and older were used to define exposure to famine36. A person was considered to be prenatally exposed to famine if the average daily food-ration of the mother during any 13-week period of gestation contained less than 1000 calories. Based on this definition, babies born between 7 January 1945 and 8 December 1945 had been exposed in utero. In correspondence with previous publications on this cohort, we delineated periods of 16 weeks each to differentiate between those exposed in late gestation (born between 7 January and 28 April 1945), in mid gestation (born between 29 April and 18 August 1945) and in early gestation (born between 19 August and 8 December 1945)37. People born before 7 January 1945 and people born after 8 December 1945 were considered as unexposed to famine in utero and acted as control groups.
Study parameters
Birth characteristics of the participants were retrieved from their medical birth records. At age 58, participants were invited to the clinic for a standardized data collection protocol, which included collection of a fasting blood sample by venipuncture, anthropometry and a standardized questionnaire assessing lifestyle parameters and socio-economic status.
As part of a standardized psychological stress protocol, we administered a short computerized version of the Stroop task7,62. The Stroop task measures executive function, specifically selective attention. A name of a color was presented in one of four different ink colors (i.e. the word ‘blue’ printed in yellow ink). Participants had 5 sec to name the color of the ink and to choose the correct option out of four names of colors printed in different ink colors. Total time of testing was 5 min. The number of correct and incorrect answers was recorded. From these, the percentage correct answer was calculated as Stroop task performance.
DNA was isolated from fasting blood and Apoe4 carrier information was extracted from genome wide SNP profiling using the 670 K Affymetrix Axiom UKB WCSG-96 array. At age 68 years, 118 of the 151 invited study participants underwent MRI scanning of the brain. Using T1 weighted images, BrainAGE was estimated. For a detailed description of MRI processing and BrainAGE computation see ref. 10,11.
Liquid-liquid extraction of lipid from plasma
Samples were extracted from plasma (which was stored at −80 C until assay) as described63. In short, 100 µl of LC-MS grade water and 150 µl of internal standard mix (Table S1) were added to 15 µl of plasma in a 96-well glass-coated plate prior to mixing for 10 sec. Subsequently, 750 µl of LC-MS grade methyl-tertiary butyl ether (MTBE) and a further 200 µl of LC-MS grade water were added to each well before shaking for 10 sec. Once mixed, plates were spun at 2000rpm for 2 min to achieve phase separation with 25 µl of the upper organic phase transferred to a new glass-coated plate with 90 µl of MS-mix (7.5 mM ammonium acetate in IPA:CH3OH 2:1), which was subsequently added to each well.
DIMS lipidomic profiling
Samples were infused into an Exactive Orbitrap (Thermo, Hemel Hempstead, UK) using a Triversa Nanomate (Advion, Ithaca, USA). Data collection began 20 sec after the infusion began, initially analyzing samples in the positive ionization mode with an ionization voltage of 1.2 kV applied. After 72 sec, acquisition switched to the negative ionization mode with an applied voltage of −1.5 kV with data acquired for a further 66 sec.
Lipidomic data processing
Raw data files were converted to .mzXML files using msConvert (ProteoWizard), and were subsequently processed in R (version 3.2.2) using an in-house script to compare spectra against a list of 1649 lipid species, with a relative intensity and mass deviation value recorded for each lipid in every sample, with 4 filtering steps applied to quality control the data and focus subsequent analysis on analytically robust signals. The first step was to remove lipids with a mean mass deviation between expected and recorded mass of greater than 5ppm. The second step was to remove signals with an average intensity in the samples less than five times greater than in the blanks. The third step was to remove signals with 0 values in greater than 10% of samples. The final step was to remove lipids with an r < 0.9 in our QC dilution series.
Plasma leptin measurement
Leptin was measured (from fasting plasma samples stored at −80 °C) with 125I radioimmunoassay (Millipore; intra-assay variation 2.9–4.4%; total assay variation 3.6–6.3%; detection limit 0.5 ng/ml).
Statistics
SPSS version 27 was used to describe the clinical characteristics of the study population and to test differences in clinical outcomes (including levels of leptin) between those exposed (during early, mid or late gestation) and those unexposed to famine during gestation. As leptin showed a skewed distribution, we applied a log transformation when using this variable in analyses.
For the lipidomic analysis, the dataset was split into balanced training and testing sets (70:30). Random forest ML approaches were used to calculate multivariate classification and regression models to assess the association between the generated lipid profile, prenatal famine exposure (yes/no) and clinical parameters. The relationships between individual lipid species and famine exposure, specifically in late, mid or early gestation, Stroop task performance, BrainAGE and leptin were determined using generalized linear models applied to the whole of the dataset. Next to analyzing the associations between prenatal famine exposure, lipid profile, leptin and cognitive and BrainAGE measures, our study design allowed for the exploration of associations between lipid profile, leptin, cognitive performance and BrainAGE independent of famine exposure. To this end, we again applied random forest models and univariate analyses. All first models were uncorrected models and in additional models, we corrected for age, sex, BMI, HDL, triglycerides and ApoE4 status. Controlling for type 1 errors was performed by determining if p values calculated passed a Bonferroni adjusted significance threshold of p = 0.0002 which was calculated based on all 259 lipids measured in this study. Models were calculated in ‘R’ (version 3.4.2) and in SPSS (version 27).


Responses