Complexity of leaf trait covariation for mangrove species

Introduction
The worldwide leaf economics spectrum (LES) defines a single axis of trait covariation representing a slow-to-fast continuum in leaf resource-investment strategies and plant growth strategies1,2. The ‘fast’ leaves have low leaf mass per area (LMA), short leaf lifespan (LL), high nitrogen (N) and phosphorus (P) per unit of leaf mass, and high photosynthetic and respiration rates, while ‘slow’ leaves are characterized by high LMA, long LL, low N and P, and slow physiological rates1,2. These relatively slow or fast strategies are associated with plant ecological niches1,2. Plants growing in harsh environments, such as arid and nutrient-poor conditions, typically possess traits positioned towards the conservative end of the LES (e.g., high LMA, low leaf N), while plants in humid environments often demonstrate a fast-growing strategy with traits positioned towards the acquisitive end (e.g., low LMA, high N)3,4. LES has been successfully obtained mainly from terrestrial vegetation, but also from various other plant communities, such as tundra5, fresh wetlands6, the Lemnaceae family (the world’s fastest growing plant community)7, and vascular epiphytes8. However, mangroves have been largely overlooked in these global trait analyses9,10, leaving a critical gap in our understanding of coastal ecosystems. Despite growing interest in examining individual traits, a comprehensive understanding of trait coordination and its ecological implications is lacking9,11,12,13. To fill this knowledge gap, further investigation into trait coordination of mangrove species and its relevance to resource-investment strategies is necessary.
Mangrove species grow mainly in coastal saline or brackish water. They are often categorized into true mangroves and mangrove associates11,14,15,16, although the assignation of some species to these categories is still under debate11. True mangroves thrive in the intertidal zone, constantly exposed to tidal fluctuations, while mangrove associates tend to occupy landward areas, experiencing less frequent tidal influence16,17,18,19. These differing ecological niches suggest that true mangroves may adopt more conservative resource-investment strategies compared with mangrove associates. Indeed, true mangroves typically exhibit lower specific leaf area or higher LMA and lower leaf N compared to mangrove associates13,20. Thus, it can be hypothesized that the trait coordination patterns of true mangroves and mangrove associates are consistent with their different resource-investment strategies.
However, some true mangrove species exhibit unexpected trait performance beyond this general trend. For instance, some slow-growing species like Kandelia obovata may have higher leaf nutrient concentrations than faster-growing species like Laguncularia racemosa20,21. Additionally, succulent and thick leaves, common adaptations to high salinity, can lead to high LMA values20,22,23. However, these trait performances may not always indicate a slow-growth strategy. This complexity can obscure the relationship between trait coordination and the resource-investment strategies of mangrove species.
This study aimed to investigate how trait coordination varies across and within mangrove species, and whether these patterns are associated with leaf resource-investment or plant growth strategies. Using a comprehensive dataset of leaf traits encompassing most Chinese mangrove communities, we examined trait coordination both across and within species. We also conducted a case study in the field to explore how intraspecific trait variation influences the links of trait coordination with plant growth strategies. Our findings confirm the presence of LES in mangrove communities but also highlight the complexity of trait-strategy relationships.
Results and discussion
Trait coordination across species and between groups
This study is based on a comprehensive dataset of leaf traits collected from 38 mangrove species, representing most species found in China24 and the most widespread mangrove species across the Asia-Pacific region25. The sampling sites spanned subtropical and tropical regions, extending over 20,000 hectares and 935 km north to south24. This broad geographic coverage and comprehensive dataset ensure the representativeness of our findings for mangrove communities.
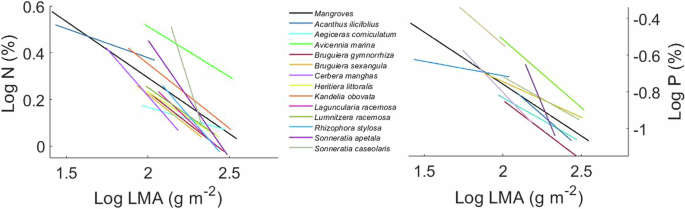
Our results confirm the presence of LES in mangrove communities. We detected strong trait correlations across species (n = 468 for LMA-N and n = 456 for LMA-P, p < 0.001 for individual trait pairs; n = 38 species, p < 0.001; Fig. 1a). The strong correlations were also observed at regional scales (n = 210 at Guangdong province, n = 145 at Hainan province, and n = 118 at Xiamen city; p < 0.001 for all analyses; Fig. 1b). The slope of LMA-N was similar to the global LES (p = 0.052) but the slope of LMA-P was less steep than the global pattern (p = 0.036)1, suggesting that mangrove species exhibit less variation in leaf P relative to the variation in LMA.

a Trait spectrum of LMA-N and LMA-P for all sampled mangrove species (solid yellow, r = −0.608 for LMA-N, r = −0.568 for LMA-P) and all individuals (open yellow, r = −0.628 for LMA-N, r = −0.654 for LMA-P) with the global leaf economics spectrum (gray dots) as a reference for comparison. b Slope of trait spectra for Guangdong province (orange, slope = 0.47 for LMA-N, slope = 0.62 for LMA-P), Hainan province (blue, slope = 0.39 for LMA-N, slope = 0.36 for LMA-P), and Xiamen city (purple, slope = 0.30 for LMA-N, slope = 0.32 for LMA-P) with all the tested species (black, slope = 0.48 for LMA-N, slope = 0.56 for LMA-P) as a reference for comparison. c Trait spectra of true mangroves (blue, 23 species) and mangrove associates (purple symbols, 13 species) as well as their trait ranges. Black lines are the results derived from all tested mangrove species.
As hypothesized, true mangroves showed overall higher LMA and lower leaf N or P, while mangrove associates tended to have lower LMA and higher N or P (p < 0.001 for all analyses; Fig. 1c). These results align with previous observations on trait variation9. The more conservative resource-investment strategy of true mangroves was likely associated with the harsh environments where they naturally occur23,26. These findings support the link between LES and plant resource-investment strategies at community scales.
Large variation in trait coordination within species
Some species showed significant intraspecific trait coordination, with 13 species showing significant correlation of LMA-N and 10 species showing significant correlation of LMA-P (p < 0.05 for all analyses; Fig. 2). These intraspecific trait coordination generally aligned with the cross-species patterns, as indicated by similar slopes between trait co-variation within species and the one across species (p = 0.159 for LMA-N; p = 0.288 for LMA-P). Such consistent patterns in LMA-N were also observations in a wide range of plant communities27. However, considerable intraspecific trait variation was observed in some species, particularly in Cerbera manghas, Kandelia obovata, and Avicennia marina (Fig. 2). These species, sampled from a wide geographic range with varying climate and sediment conditions, which may result in large variation in traits28,29,30,31,32.
The black lines are the trait correlation across all tested mangrove species. Each colored line indicates intra-specific trait variation (13 species for LMA-N and 10 species for LMA-P; these species exhibited a significant Pearson correlation between traits at p < 0.05; slopes provided in supplementary Table 1).
Species re-sorting
Our case study conducted in Xiamen city demonstrated that Sonneratia apetala exhibited a faster-growing strategy compared to K. obovata. Specifically, S. apetala consistently exhibited greater tree height (2.84 ± 0.27 m) and photosynthetic rate (13.24 ± 0.50 μmol CO2 m−2 s−1) compared to K. obovata (1.31 ± 0.15 m; 8.76 ± 0.53 μmol CO2 m−2) across all sites (p < 0.001 for all analyses; Supplementary Fig. 2). However, at the JMB site, their trait performance contradicted their growth strategies (Fig. 3). S. apetala exhibited higher LMA and lower leaf N and P than K. obovata (p < 0.001 for all analyses) despite sharing the same soil conditions. This observation supported the hypothesis of species re-sorting proposed by Tautenhahn et al. (ref. 33), i.e., that species exchange their relative position along the trait coordination spectrum.
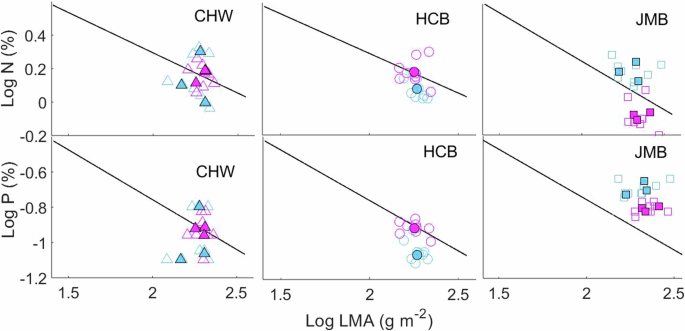
The black lines are the trait spectra derived from all tested mangrove species. Blue and purple symbols refer to K. obovata and S. apetala, respectively. Open symbols represent individual data and solid one represent mean value of each species.
The observed species re-sorting was primarily driven by an increase in LMA of S. apetala at the JMB site compared to CHW (p = 0.022) and HCB (p = 0.001). Among soil conditions, a significant difference was observed in soil salinity between JMB (ca. 18‰ on average with the range of 13–26‰) and the other two sites (ca.14‰ on average with the range of 8–21‰; p = 0.013). Generally, salinity can lead to increase in LMA, while for halophytes such increase in LMA occurs only at high saline condition34,35. This is likely the reason why K. obovata showed no difference in LMA between sites (p = 0.418).
To further explore the increase in LMA of S. apetala at the JMB site, we analyzed leaf thickness and density, the primary composition of LMA36. The fast-growing species S. apetala consistently showed higher leaf thickness (p < 0.001) and lower leaf density (p < 0.001) compared to K. obovata across all sites (Fig. 4a, b). Notably, at the JMB site, S. apetala had nearly double the leaf thickness of K. obovata (p = 0.029; Fig. 4b). Leaf thickness of S. apetala was strongly correlated with LMA (r = 0.60, p = 0.001) while leaf density showed no significant correlation with LMA (p = 0.334), indicating that increased leaf thickness was the primary driver of higher LMA in S. apetala at JMB site. That leaf thickness rather than leaf density is the primary component of LMA has reported in some succulent or sclerophyllous leaves22,36,37,38, as adaptation to low water availability39.
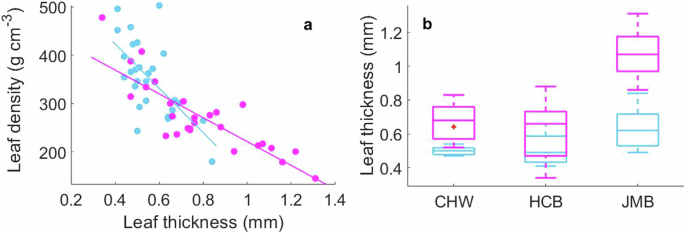
a Trade-off between leaf density and leaf thickness (n = 54, r = −0.656 and −0.835 for K. obovata and S. apetala, p < 0.001 for both species). b Comparison of leaf thickness between species across three sites (p < 0.001 at all sites). Blue and purple colors represent the data for K. obovata and S. apetala; CHW, HCB, and JMB are the three sites.
Thicker leaves, typically with more mesophyll layers and a larger surface area of mesophyll and chloroplast within leaves34,36,38,40, can potentially achieve greater photosynthetic rate even without increased stomatal conductance36. The performance of S. apetala was one of the cases. It showed a higher photosynthetic rate than K. obovata (p < 0.001) without difference in stomatal conductance (p = 0.713). The presence of stomata on both leaf surfaces of S. apetala could further enhance internal gas conductance by reducing diffusion distance41,42. For succulent plants, internal conductance may be more critical for photosynthesis than stomatal conductance under stress conditions like drought or salinty43. Salinity stress can induce increased mesophyll cell size or higher chloroplast density per unit leaf area, improving photosynthesis when stomatal conductance is limited44. Collectively, increasing leaf thickness and LMA is likely an adaptive response for S. apetala to maintain high photosynthetic rate under high salinity.
The lower leaf N and P of S. apetala compared to K. obovata also contributed to species re-sorting. Fast-growing species having lower N and P compared to slow-growing mangrove species have been also observe between Laguncularia racemosa and K. obovata despite they sharing the same environmental conditions21. However, when analyzing nutrient concentration as per unit leaf area, S. apetala at JMB site displayed a consistently higher P: N ratio (0.150 ± 0.007) compared to K. obovata (0.115 ± 0.003; p = 0.001). This may contribute to the increase in leaf thickness as P fertilization can enhance stomatal conductance, specific leaf conductivity, phloem proportion, palisade parenchyma and leaf thickness of some plant species45,46,47. In addition, S. apetala also showed consistently higher nitrogen use efficiency (73.06 ± 3.75) than K. obovata (45.27 ± 3.06) across all sites (p < 0.001), contributing to a higher photosynthetic rate in S. apetala by enhancing carboxylation capacity47.
Overall, our findings highlight the complex nature of trait co-variation in mangrove communities and emphasize the importance of considering LMA composition in understanding these relationships.
Methods
Examination of trait coordination across species, between groups and within species
Experimental design and sampling
To investigate leaf trait co-variation and the LES patterns in mangroves, we conducted a comprehensive sampling across a range of mangrove forests in China. These mangrove forests included two sites in Hainan province, six sites in Guangdong province, and five sites in Xiamen city (Supplementary Figure 1). These sites encompassed both subtropical and tropical regions, covering a total area of approximately 20,000 hectares24 and over 935 km north to south, exceeding 4 degrees of latitude (Supplementary Figure 1). This broad geographic and species coverage allows us to capture the full range of potential variation in leaf traits and construct robust trait spectra. The 38 species encompasses nearly all known Chinese mangrove species (Supplementary Table 2). Sampling was conducted across all sites in autumn.
We sampled the leaves of these plants randomly based on their occurrence within the study area. For each species, at least three individuals were selected and 30–50 mature green leaves of each individual plant were collected and then carefully stored in self-sealing plastic bags at 4 °C until further analysis. We categorized the sampled species based on established classification systems11,14,15,16,17,18. True mangroves are exclusively growing in mangrove forests and mangrove associates encompass all other species, including those found in peripheral tidal habitats or forming mixed communities, and also those species are often in the debated11,14,15,16,17,18 (Supplementary Table 2).
Measurement of leaf traits
Leaf area, fresh mass, and dry mass were measured immediately after sampling (excluding the petiole). For most species, we used a portable leaf area analyzer (YMJ-B, Zhejiang Top Cloud-Agri Technology) to measure leaf area. However, for species with trichomes (hair-like structures) on their leaf surfaces, such as Avicennia marina and Heritiera littoralis, we used ImageJ for leaf area analysis. To ensure consistency, a standard relationship was established between both methods. Leaves were oven-dried for 48–72 h at 65 °C to determine dry mass. Leaf mass per area (LMA) was calculated by dividing the dry mass by the one-sided leaf area. Leaf nitrogen (N) concentration was analyzed using an EA-HT Elemental Analyzer (Thermo Fisher Scientific, Inc., Bremen, Germany) and leaf phosphorus (P) concentration was determined using an inductively coupled plasma optical emission spectrometer (ICP-OES; Optima 5300 DV, PerkinElmer, Waltham, MA, USA).
Statistical analyses
All the data were analyzed using SPSS (version 16.0 for Windows). Figures were generated with MATLAB (version 2021a). Data were log-transformed to ensure normality. We examined trait coordination (LMA-N and LMA-P) across and within species by conducting two-tailed correlation analyses (significance at p < 0.05) and Pearson correlation coefficient was used to indicate the strength and the direction of trait correlations. For examination of trait coordination across species, both all individual data and the mean value of each species were analyzed. Slopes of correlated trait spectra were obtained by General Linear Model. To examine whether the slope of mangroves differ from global ones, One-Sample T-Test was used (significance at p < 0.05). One-Sample t-test was also used to compare the slopes of intraspecific variation and mangrove LES. To compare LMA, N, and P between true mangroves and mangrove associates, Independent t-tests were used (significance at p < 0.05).
Test of trait coordination between species
Experimental design and sampling
To investigate whether intraspecific trait variation impact the link of trait coordination to resource-investigate strategy, a case study was carried out in Xiamen City (Supplementary Figure 1c). This experiment focused on a pair of mangrove species with contrasting growth strategies: the fast-growing Sonneratia apetala and the slow-growing Kandelia obovata. Both species were found at three sites: CHW, HCB, and JMB. To increase the credibility of our research, we also set three plots at CHW and JMB sites, and one plot at HCB. Leaf sampling followed the same method above.
Measurements of leaf traits and soil conditions
Photosynthetic capacity (maximum photosynthetic rate) and maximum tree height were measured to determine plant growth performance (fast or slow). Photosynthetic capacity was assessed using a Li-Cor 6400 portable photosynthesis system (LI-COR, Lincoln, NE, USA) under saturating light conditions (> 800 µmol m−2 s−1)47. A vernier caliper was used to measure the maximum tree height. The measurement of LMA, N and P was used the same method above. To explain the variation of LMA, we further analyzed leaf thickness and leaf density, the main composition of LMA. Leaf thickness was measured with a vernier caliper, and leaf density was calculated as dry mass divided by leaf volume (thickness multiplied by leaf area)39. To characterize sediment properties, we collected three soil cores from each plot. Sediment pH, electrical conductivity (EC), and salinity were measured with a Benchtop pH/ISE/EC/DO Meter (DDSJ-308F, INESA Scientific Instrument Co., Ltd, Shanghai, China). Sediment N and P concentrations were analyzed using an EA-HT Elemental Analyzer (Thermo Fisher Scientific, Inc., Bremen, Germany) and X-ray fluorescence spectroscopy (Axios-MAX, Panalytical, Netherlands), respectively.
Statistical analyses
Differences in leaf traits between species were evaluated using Independent-Samples t-tests with confidence interval at 95% and significance at p < 0.05. To compare soil properties (pH, EC, salinity, N, and P) among plots within each site, a one-way analysis of variance (ANOVA) was used followed by post-hoc LSD tests. Independent t-tests were also used to compare soil conditions between JMB site and the other two sites, after an ANOVA was conducted among three sites (which rendered no significant differences between CHW and HCB).

Responses