Bioenergetically constrained dynamical microbial interactions govern the performance and stability of methane-producing bioreactors

Introduction
Anaerobic degradation represents a pivotal biotechnological advancement, offering a sustainable solution for converting organic waste into renewable energy, which is a critical step toward achieving an energy-neutral future1. In this process, a consortium of trophic microbes collaborates to degrade organic wastes and convert them into valuable biogas products (primarily methane). For example, the anaerobic degradation of sucrose, a carbohydrate, into methane involves coordination among three trophic groups. First, fermentative anaerobes degrade sucrose primarily into C2-C4 volatile fatty acids (VFAs) and H2. Subsequently, syntrophic bacteria and methanogenic archaea catabolize these metabolites into biogas through a syntrophic interaction. Notably, the oxidation of VFAs must overcome inherent thermodynamic limitations (Fig. 1A)2,3,4. These closely intertwined microbial interactions profoundly influence the energy released from organic degradation, which benefits the growth and methane production of the interactions5,6.

A The anaerobic degradation process of sucrose by three primary trophic groups involves a series of steps. First, a fermentation step is mediated by fermentative bacteria (FB, yellow circle). Subsequently, a syntrophic oxidation step for fermentation products such as butyrate (Bu) and propionate (Pr) is responsible for syntrophic bacteria (SB, green circle). Finally, a methane-producing step from the methanogenic precursors, hydrogen/carbon dioxide (H2/CO2) and acetate (Ac), is facilitated by methanogenic archaea (MA, red circle). B As the microbial communities in the reactor undergo succession after start-up, dynamic changes in microbial interactions among various trophic groups affect system performance (substrate catabolism) and community assembly over time. Each of these components can be described conceptually using an equation expressing the microbial growth, dX/dt, as a function of microbial growth yield (Y), substrate catabolism (dS/dt), time-varying microbial interactions of various trophic groups (finteraction), and the environmental factors (fenv). IS, the interaction strength of positive (blue arrow) and negative (red arrow) edges; VFAs, volatile fatty acids; ΔG′, Gibbs free energy change for the reaction. Assuming constant environmental factors, changes in microbial growth or abundance are determined by both substrate catabolism and microbial interactions with time.
Acclimation of an inoculated consortium into a functional community is a major challenge during the startup of anaerobic reactors. Although studies have examined the relationships between reactor performance, community composition, and potential microbial interactions7,8,9, the altered microbial interactions and their impact on system performance during succession remain unclear. Some studies have explored interaction networks among microbial species in anaerobic reactor systems using co-occurrence or model-based methods10,11,12. However, many of these studies have been limited by infrequent sampling intervals and the fact that correlation does not always imply interaction13,14. Moreover, assumptions of linear and static interactions under steady-state conditions may not adequately capture the complexity of anaerobic reactor systems composed of numerous microbes engaging in dynamical, time-varying networks. Those microbes are particularly likely to adapt to changing conditions during reactor startup, resulting in a time-varying interplay between microbial networking, bioenergetics, and community assembly. The time-varying community assembly arises from differential growth rates among microbes, which are regulated by energy allocation and interactions between the microbes, and changes in microbial assembly further influence microbial interactions and metabolite composition (Fig. 1B). Despite its profound implications, the dynamical nature of this interplay remains elusive, primarily because of challenges related to quantifying large microbial networks and their dynamics over time in highly fluctuating reactor environments15,16,17,18. According to our review of relevant literature, the selection force, such as variations in temperature9 and ammonia8, drive the deterministic microbial assembly processes. However, when operation parameters are maintained steady, the governing mechanism of microbial community succession and their associated time-varying interaction network in anaerobic reactors have not been explored. Thus, an attempt to unravel the intricacies of microbial networking and bioenergetics within the anaerobic degradation process would potentially open new avenues for optimizing biotechnology for waste minimization and the renewable biofuel industry.
To capture the non-static and dynamical nature of microbial interactions, we employed a novel analytical framework known as empirical dynamic modeling (EDM)14, specifically designed for analyzing nonlinear dynamical systems. EDM offers a unique solution to analyzing such systems in that it directly evaluates microbial time-series data rather than assuming static statistical properties. Within the EDM framework, we employed the multiview distance regularized (MDR) S-map approach to reconstruct high-dimensional, time-varying interaction networks19. This approach can provide insights into crucial network topological properties, such as centrality, strength distribution, and derived stability measures (see Methods). Consequently, it serves as an effective tool for unraveling the dynamical networks involved in microbial succession. Moreover, an in-depth understanding of networking dynamics offers significant potential for improving reactor startup strategies. By leveraging these insights, we can further develop technologies to optimize reactor performance through targeted manipulation of microbial interactions.
The MDR S-map approach was applied to reconstruct high-resolution, time-varying networks using 110 daily time-series datasets obtained during methane biogas production from anaerobic sucrose degradation in an upflow anaerobic sludge bed bioreactor after startup. This bioreactor system has long served as a crucial platform for advancing anaerobic biotechnology and deepening the understanding of microbiology and ecology. To further elucidate the mechanisms underlying the reactor dynamics, we applied the convergent cross-mapping (CCM) method13,20 to identify causal relationships among various time-series features. Through CCM, we elucidated the causal relationships among interaction network properties, bioenergetic parameters, and community structure variables. Our primary objective was to elucidate the dynamical interplay between sucrose-to-methane bioenergetics and network properties to ultimately reveal the mechanisms governing community succession from reactor startup to the achievement of stable, high-performance anaerobic degradation operation. Such insights hold the potential to enhance renewable biofuel production and contribute to its long-term sustainability.
Methods
Startup and operation of the bioreactor
A 54-L upflow anaerobic sludge blanket reactor (1900 mm height, 186 mm diameter) constructed of double-layer acrylic was newly established for this study. (Supplementary Fig. 1). The inoculum for the reactor was derived from meshed (30 mesh, 0.595 mm) methanogenic sludge obtained from a full-scale UASB plant that treats fructose manufacturing wastewater near Tainan City, Taiwan (Supplementary Fig. 1). The mixed liquid-suspended solids of concentrated sludge for inoculation is 60,000 mg/L. For the startup of the bioreactor, 20 L of this concentrated sludge was combined with 30 L of sucrose-free medium21 for inoculation. The reactor temperature was maintained at 33 °C using a water bath. Sucrose served as the sole substrate, introduced into the reactor at a loading rate of 1.12 kg-chemical oxygen demand (COD)/m3/day with a hydraulic retention time of 48 hours. A heat-sterilized concentrated sucrose solution and sucrose-free medium (prepared per a modified previous study recipe21), were combined as the influent. Recirculation was applied to maintain an upflow velocity of 1 m/h. The reactor was operated continuously for 110 days (2021/10/12-2022/01/29), with daily performance measurements obtained from Day 3 to Day 110.
Evaluation of reactor performance
Temperature, pH, and oxidation-reduction potential (ORP) were monitored using online sensors (SenTix XO pH probe and SenTix RO ORP probe, WTW, Munich, Germany; PT100 temperature sensor, SUNTEX, Kaohsiung, Taiwan), transmitters (PC-3110, SUNTEX, Kaohsiung, Taiwan), and a data logger (GL220, Graphtec, Tokyo, Japan). Electrical conductivity (EC) measurements of the effluent were taken by using a conductivity electrode (8-241-01 Quadrupole conductivity electrode, SUNTEX, Kaohsiung, Taiwan) and conductivity transmitter (EC-4110, SUNTEX, Kaohsiung, Taiwan). Gas production was quantified using a wet gas meter (W-NK-0.5B, SHINAGAWA, Tokyo, Japan). Gas composition (H2, CO2, and CH4) was performed using a gas chromatograph (GC2000, China Chromatograph, New Taipei City, Taiwan) equipped with a stainless-steel column (carboxen-1000 60/80) and a thermal conductivity detector with argon carrier gas at 30 mL/min. COD was analyzed using a commercial kit (COD Digestion Vials, High Range, HACH, Colorado, United States). Carbohydrates (sucrose and glucose) and VFAs (formate, acetate, propionate, and butyrate) were determined using a high-performance liquid chromatograph (1260 Infinity, Agilent Technologies, California, United States) with a refractive index detector and a UV detector. The filtered sample was injected into a 20-μL loop and then passed through an Aminex HPX-87H Column (300 × 7.8 mm, BioRad, California, United States) at a flow rate of 0.6 mL/min, with 0.008 N H2SO4 at 40 °C used as the eluent. Suspended solids (SS) and bicarbonate alkalinity were analyzed in accordance with the Taiwan EPA standard methods (NIEA W210.58A and NIEA W449.00B). Effluent samples collected daily (around 6–8 PM) and filtered through a 0.22-μm membrane were analyzed immediately. Hourly online data were averaged daily and combined for further analysis.
Energetics analysis
The Gibbs free energy change (ΔG33′) was applied to assess the energy available for the biochemical equations in this study (Table 1), defined as ΔG33′ = ΔG330′ + RT × ln(Q), where ΔG33′ is the Gibbs free energy change corresponding to the metabolite composition at 33 °C and pH = 7, ΔG330′ is the standard Gibbs free energy change adjusted using the Van ‘t Hoff equation (33 °C, [H+] = 10−7M), R denotes the ideal gas constant, T denotes the absolute temperature, and Q is the reaction quotient. The Gibbs free energy change was calculated by assuming that the activities of the reaction components were equal to the measured concentrations, or partial pressures, with cytoplasmic pH maintained at 7. Standard Gibbs free energy and standard entropy of formation obtained from previous research22,23,24. Assuming complete sucrose degradation into fatty acids, hydrogen, carbon dioxide, and methane, the degradation process is described as Eq. (10).
The coefficients (y1i and x1i to x8i) calculated based on stoichiometry revealed the distribution of metabolites per mole of sucrose degradation in the day i. The ΔG33′ was calculated using Eq. (11).
If VFA values fell below the detection limit (0.025 mM), they were substituted with 0.001 mM. Similarly, gas partial pressures below the detection limit were set to 1 Pa, the minimum hydrogen threshold for most hydrogenotrophic methanogens25.
Microbial community analysis
16S rRNA gene amplicon metabarcoding was employed to analyze the prokaryotic community composition. The sample used for microbial community analysis was taken at around 6–8 PM every day. Sludge samples (5 mL each) from four different sampling points (label #5 in Supplementary Fig. 1) of the reactor were meticulously mixed, and 1 mL mixture sample was centrifuged at 16,000 g. The sludge pellet was stored at −20 °C until DNA extraction; the sludge mixture aliquot was also used for SS analysis. DNA was extracted using the DNeasy PowerSoil Pro Kit (Qiagen, California, United States) following the manufacturer’s protocol. The hypervariable V5–V6 region of the 16S rRNA gene was amplified with primers 515F and 926R, as outlined in another study26. Sequencing was conducted using v3 Chemistry Kits (2 × 300 bp) on the MiSeq platform (Illumina, California, United States). PCR and library preparation following established methods outlined in another study27. Amplicon sequence variant table was generated with DADA2, and annotated using classify-sklearn against the SILVA 138 rRNA database28. Microbiome analysis was conducted using Qiime2 (2021.11 version)29. This included the evaluation of Shannon alpha diversity and Bray-Curtis-dissimilarity-based beta diversity. Data were normalized to 25,000 sequences per sample for alpha diversity. The sequence data were deposited in the database of the National Center for Biotechnology Information under accession number PRJNA1047765.
Analysis of dynamic interaction networks
The MDR S-map, an EDM-based approach19, was employed to reconstruct the high-dimensional and time-varying dynamical interaction Jacobian network from the time-series data, including core genus taxa, defined as those accounting for more than 0.01% of the total prokaryotic community and more than 0.01% in a minimum of 60% of the samples in the community analysis and reactor performance (i.e., gas composition, and VFA concentrations). The interaction Jacobian, ({J}_{{ij}}=frac{{partial x}^{(i)}(t+1)}{{partial x}^{(j)}(t)}) represents the net effects of changes in the abundance of node j (between two consecutive observations) at time t on the abundance of species i at the subsequent time point t + 1. Here, x(i) is the abundance of species i19. The MDR S-map approach is a novel nonparametric method that integrates multiview embedding30 and a regularized S-map31 to construct high-dimensional time-varying interaction networks. This method addresses problems associated with high dimensionality by using state space reconstruction SSR under the optimal embedding dimension.
Network properties
The characteristics of each microbial node in the time-varying network were assessed by analyzing various topological indices. The calculated indices included strength in (summary interaction strength (IS) from all other nodes to one node), strength out (summary IS from one node to all other nodes), and strength all (summary of the strength in and strength out)32, along with centrality indices, such as hub33, authority34, and degree35. To evaluate the structural instability of the interaction network, we applied the trace of Jacobian matrices36. Average positive and negative IS were computed as the sum of positive or negative edges divided by their respective counts. Interaction proportions were calculated as the number of positive or negative edges divided by the total edge count. Interaction complexity was quantified using Shannon entropy, with consideration of six interaction types: cooperation (+/+), competition (−/−), exploitation (+/−), commensalism (+/0), amensalism (−/0), and neutral (0/0), where the symbols +, −, and 0 respectively denote positive, negative, and no interaction between nodes.
Causality analysis between characteristics
To investigate the causal relationships among reactor performance, community structure, and network properties, we employed CCM13, a method for identifying causality in nonlinear dynamical systems based on Takens’ theorem37,38 and followed the procedure described in a previous study20. The higher cross-map skill at the maximal library size (ρ(Lmax)) represents the more substantial causation. We presented only those significant causal links with CCM skills that exhibited a significant increasing trend and improvement (both p < 0.05 in Fisher’s Z test and Kendall’s τ test) as the library length increased (i.e., convergence in CCM). The factors investigated were categorized into three groups: i) reactor performance, including COD removal efficiency, ΔG33′, concentrations of acetate, propionate, butyrate, H+, partial pressure of H2, and CH4; ii) community structure, including PCo1 and PCo2 as the primary axes from PCoA analysis, Shannon alpha diversity, and biomass in the reactor; and iii) network properties, including instability, average positive interaction strength, average negative interaction strength, interaction complexity, positive interaction proportion (P %), negative interaction proportion (N %), and average degree (centrality).
Computation
The reconstruction of the time-varying interaction network and causality analysis were conducted in R (version 4.3.0). CCM analyses utilized the rEDM package (version 1.2.3)39. The elastic-net regularization employed in MDR S-map was solved using the glmnet package (version 3.0)40. Network topological properties were computed using the igraph package (version 1.4.2)41. Principal coordinates analysis (PCoA) with a Bray-Curtis distance was performed using the ape package (version 5.7.1)42. The Mann–Kendall test was performed using the Kendall package (version 2.2.1)43.
Results
Assessment of reactor performance and corresponding catabolism energetics
During the study period, the bioreactor was operated under relatively constant operational parameters (Supplementary Fig. 2). Following the initiation of the bioreactor with sludge inoculum sourced from a sugar manufacturing facility, the consortia within the bioreactor promptly began to degrade the input sucrose, resulting in the generation of methane and carbon dioxide as final gaseous products. Throughout the 110-day startup phase, the COD removal exhibited substantial fluctuations, ranging from 77.9% to 97.6% (Fig. 2A). Initially, the COD removal exhibited a decline followed by substantial fluctuations. However, at approximately Day 80, COD removals stabilized, reaching a relatively high level with relatively high and stabilized methane production yields (Supplementary Fig. 3). Concurrently, the daily metabolite profile (VFAs and H2) demonstrated a discernible succession pattern. Acetate, propionate, and butyrate synchronously accumulated during the initial 50–60 days of operation, followed by a shift toward a predominant mixture of acetate and propionate in the effluent during the later period (Fig. 2B). These distinct VFA profiles were associated with a high hydrogen partial pressure (up to 1000 Pa) in the gas produced within the first 40 days, which then dissipated (Fig. 2C) and caused a decline in the total VFA concentration.
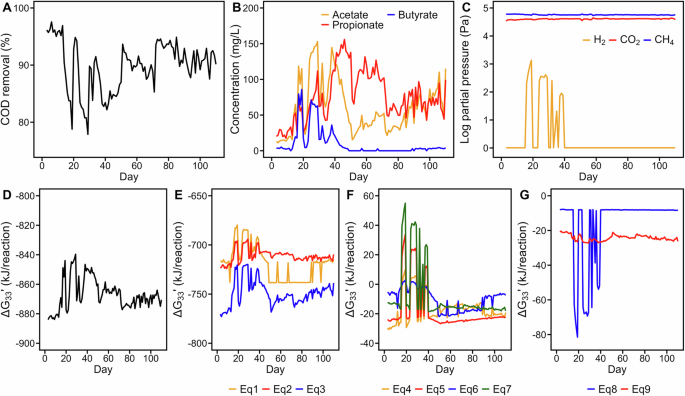
A COD removal efficiency, (B) concentrations of acetate, propionate, and butyrate in the effluent, (C) gas partial pressure in the produced biogas, (D) actual Gibbs free energy changes (ΔG33′) of the overall reaction, (E) ΔG33′ of fermentation reactions of sucrose to individual fatty acids with Eq. (1–3), (F) ΔG33′ of syntrophic oxidation of fatty acids with Eqs. (4–7), and (G) ΔG33′ of methanogenic reactions with Eqs. (8), (9). The ΔG33′ values were calculated using actual concentrations under the conditions of pH = 7 and 33 °C. The equations used in this figure are listed in Table 1. The detailed calculation process is available at https://github.com/Chao-Jui/Time-varying-Microbial-Interactions.
In terms of energy dynamics, a fluctuating actual Gibbs free energy change (i.e., ΔG33′ at 33 °C and pH = 7) for the overall reaction from sucrose to metabolized products (−884 to −840 kJ/reaction) was observed during the first 60 days, and it gradually converged to approximately −870 kJ/reaction (Fig. 2D). This trend indicates a tendency toward stability in reactor performance, particularly for sucrose degradation, with stronger exergonic energetics. Regarding individual reactions, sucrose fermentation released considerably more energy (Eqs. 1–3, −780 to −680 kJ/reaction) than did the energy allocation from VFA degradations (Eqs. 4–8, −30 to 50 kJ/reaction) and methane-producing reactions (Eq. 8 [hydrogenotrophic], −8 to −80 kJ/reaction; Eq. 9 [acetoclastic], −20 kJ/reaction; (Fig. 2E–G), indicating that the energy gained from sucrose-to-methane reactions was highly uneven among different trophic groups, with fermentative bacteria conserving most of the energy (~90%); syntrophic bacteria and methanogenic archaea shared the remaining portions. Notably, VFA degradation (Eqs. 4–8) occasionally became endergonic during Days 20–40 under high H2 partial pressure, indicating that propionate and butyrate oxidation could not occur unless the H2 partial pressure was substantially reduced by methanogens (Fig. 2F). After Day 40, the ΔG33′ values [−17.81 ± 3.18 (Eq. 4) and −24.17 ± 1.27 (Eq. 5)] approached the minimum biochemically convertible energy for syntrophic bacteria (i.e., ΔG′ = −15 to −25 kJ/reaction)2,6,44. Such minimal energy conservation limits the degradation activities of syntrophic butyrate oxidation bacteria (SBOB) and syntrophic propionate oxidation bacteria (SPOB). Overall, our bioenergetic analyses indicated the dependency of anaerobic degradation on distinct energy allocation among microbial trophic groups participating in corresponding degradation steps. Moreover, metabolite-derived bioenergetics influenced the reactivity of key biochemical reactions and potentially influenced microbial interactions crucial to subsequent changes in the microbial community.
Changes in community structure
According to 16S rRNA gene amplicon sequencing, microbial communities were predominantly composed of fermentative bacteria, which accounted for 71.4% ± 6.7% of the top 10 abundant fermentative bacteria, followed by methanogenic archaea (4.9% ± 1.9%) and syntrophic bacteria (3.6% ± 1.0%). Dominant fermentative bacterial genera, including Clostridium sensu stricto 6, Streptococcus, Propioniciclava, and Anaerolineae (SJA-15), varied considerably over time. Succession was also evident among strict SBOB (Syntrophomonadaceae and Syntrophomonas) and SPOB (Syntrophobacter and Smithella) but not among versatile syntrophic bacteria (Syntrophus and Syntrophorhabdus). The acetoclastic Methanosaeta and hydrogenotrophic Methanolinea, Methanobacterium, and Methanospirillum exhibited similar abundance patterns (Fig. 3A). Further details regarding the dynamical characteristics of these taxa are provided in the Supplementary Note 1.
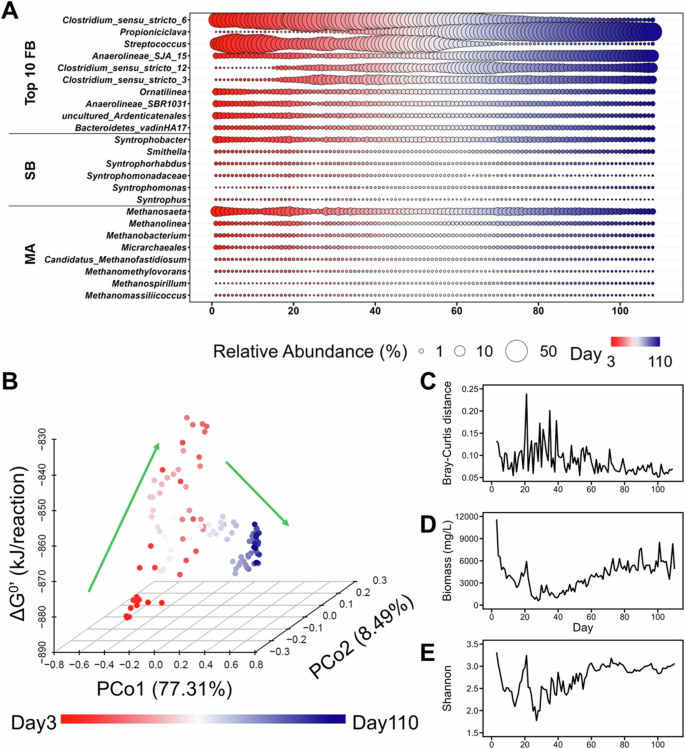
A Key microbial populations of the three trophic groups including the top 10 most abundant fermentative bacteria (FB), identifiable syntrophic bacteria (SB), and methanogenic archaea (MA) listed at the left side of panel A. B Microbial community changes in the ordination space, as assessed using the first two principal coordinates (PCo1 and PCo2) in principal coordinate analysis with the Bray-Curtis distance at the genus level for the entire community and the corresponding ΔG33′ of the overall reaction. C The time series variation of the microbial community, as revealed by the Bray–Curtis distance of two adjacent days. D The time series variation of biomass in the reactor, as revealed by the suspended solid concentration. E The time series variation of Shannon alpha diversity. The color-coded bar corresponds to the operational day.
Drastic shifts in the microbial community structure during the startup phase of the reactor were strongly correlated with changes in bioenergetic conditions. PCoA revealed a noticeable shift in the microbial assembly toward a more positive ΔG33′ of the overall reaction in the first 50–60 days (Fig. 3B). Concurrently, microbial composition exhibited a high turnover rate between consecutive days, as evidenced by the high Bray–Curtis dissimilarity (Fig. 3C). This fluctuation might be a consequence of intense environmental filtering during the early stages of reactor startup, and it is consistent with a substantial biomass loss (Fig. 3D). Subsequently, the microbial composition stabilized, with reduced Bray–Curtis dissimilarity and stabilized Shannon diversity (Fig. 3E). This stabilization of the microbial assembly coincided with enhanced COD removal efficiency and a stable ΔG33′ for the overall reaction within a narrow range (−870 ± 4 kJ/reaction), ultimately leading to efficient methane production. These findings suggest a potential interdependency between catabolism energetics, microbial diversity, and community succession.
Changes in interaction networking
The interaction networks reconstructed for the core taxa (97.5% ± 1.4% in abundance) indicated a clear transition during the succession, as evidenced by the tracking of structural instability in these networks. The MDR S-map method for quantifying interaction networks (i.e., interaction Jacobian matrices19) enabled tracking of the structural instability (defined as the trace of interaction Jacobian matrices36) of these networks over time. The derived network structural instability was used to identify three dynamical phases (Fig. 4A). The stability of the interaction network increased over time (τ = −0.50 for instability in the Mann–Kendall τ test ; p < 0.0001). In the early unstable phase (Phase I, Days 3–40), network instability peaked around Days 20–30, plateaued until Day 40, and then declined in the transition phase (Phase II, Days 41–80). Finally, the instability index was maintained at a low level, indicating a phase of greater dynamical stability (Phase III, Day 81–110) in a relative sense.
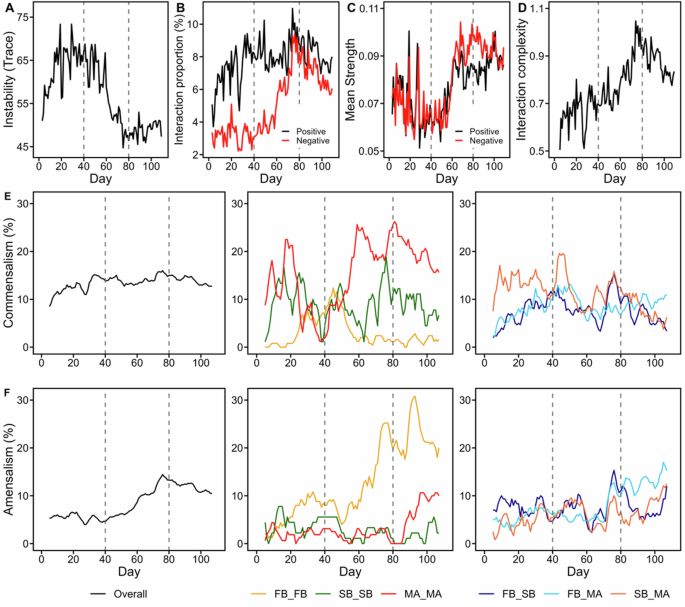
The time-varying interaction networks was reconstructed using the MDR-S map method. A Trace of the Jacobian matrix indicating the degree of community instability. B Proportions of positive and negative interaction edges. C Mean strength of positive and negative interaction edges. D Interaction complexity, as illustrated by the Shannon index of interaction types from all populations included in the MDR S-map; different interaction types are illustrated in panels (E) and (F) and Supplementary Fig. 4. Panels (E) and (F) indicate the 5-day moving average proportion of interaction types (E) commensalism (+/0) and (F) amensalism (−/0) within and between different trophic groups. The symbol “Overall” represents the sum proportion of each interaction type, calculated using all genus-level taxa in the network analysis. The proportion of interaction types between microbial taxa from various trophic groups is denoted by different colored lines, accompanied by the symbol name “XX_XX” (where XX represents the trophic group). The trophic groups included FB (Top 10 abundant fermentative bacteria), SB (syntrophic bacteria), and MA (methanogenic archaea). The taxa of FB, SB, and MA analyzed are listed in Fig. 3A. The dashed vertical lines partition the total time series into three phases according to the instability index in Panel (A). The interaction networks were reconstructed using 111 core genera (abundance > 0.01% in total samples and abundance > 0.01% in at least 60% of samples).
By closely examining the average contribution of individual microbial nodes to the total trace of the community, we found that 5 of the top 10 abundant fermentative bacteria (Propioniciclava, Streptococcus, Anaerolineae (SJA-15), Clostridium sensu stricto 6, Bacteroidetes vadinHA17), 1 of syntrophic bacteria (Smithella) and 3 of methanogenic archaea (Methanosaeta, Methanolinea, and Micrarchaeales) were among the top 25% contributors to community trace (i.e., more detrimental to the network stability). Conversely, SPOB – Syntrophomonas and methanogenic archaea (Methanospirillum and Methanomassiliicoccus) were listed in the least 25% (i.e., more favorable to the network stability) (Supplementary Table 1). Furthermore, the fraction of fermentation bacteria contributing to the total trace (i.e., the sum of trace from fermentation bacteria in Fig. 3 divided by total community trace) increased from Phase I to Phase III. In contrast, those from syntrophic bacteria and methanogenic archaea gradually decreased (Supplementary Table 2). This observation suggests that the fermentative bacteria may play a critical role in exacerbating system instability during the succession process (from Phase I to Phase III), potentially hindering the microbial community toward a stable interaction network.
Reactor performance and community assembly exhibited distinctive features corresponding to the three dynamic phases. During the unstable phase (Phase I), COD removal rates were low and exhibited fluctuations, along with variable accumulation of VFAs (acetate, propionate, and butyrate) and H2. Subsequently, in Phase II, COD removal rates gradually increased, and VFA accumulation decreased. In the final stable phase (Phase III), profound stabilizations were observed in the reactor performance with only mild temporal variations in acetate and propionate (Fig. 2A–C). Moreover, a marked change in community structure was observed in the transition Phase II, which gradually stabilized in Phase III. For instance, the dominant microbes in Phase I were Clostridium sensu stricto 6 (39.6% ± 12.0%) and Streptococcus (21.3% ± 10.6%), whereas in Phase III, the dominant taxa were Propioniciclava (4.9% ± 1.9%) and Anaerolineae SJA-15 (4.9% ± 1.9%) (Fig. 3A–C). A closer analysis of the interaction types revealed that the interaction complexity increased during microbial succession. Initially, the proportions of both positive and negative interactions were significantly increased throughout the succession (τ = 0.27 and 0.56 for positive and negative proportions in the Mann–Kendall τ test, respectively; p < 0.0001 for both), indicating a greater interconnectedness among microbes in later phases. That is, the proportion of negative interactions remained low in Phase I but increased sharply in Phase II before reaching a peak and plateauing in Phase III. By contrast, the proportion of positive interactions increased only in Phase I and then plateaued with slight fluctuations in Phases II and III. By the end of Phase III, the proportions of negative and positive interactions became nearly equal (Fig. 4B). Regarding the IS magnitude, the mean strengths of both positive and negative IS were relatively low in Phase I, exhibited a marked increase in Phase II, and stabilized in Phase III (τ = 0.43 for both positive and negative IS in the Mann–Kendall τ test ; p < 0.0001 for both). In Phase III, the mean negative strength was slightly higher than the positive (Fig. 4C). The diversity of the interaction types increased as the number of interactions increased over time, primarily because of the increased commensalism (+/0) in Phase I and amensalism (−/0) in Phase II. Other interactions, such as cooperation (+/+), competition (−/−), and exploitation (+/−), were less frequent (<1.5%) but still exhibited positive trends, particularly in Phase II. Ultimately, the interaction complexity increased (τ = 0.58 in the Mann–Kendall τ test, p < 0.0001) throughout the reactor startup process, although it experienced a slight decrease upon entering Phase III (Fig. 4D).
Distinct microbial interactions
To explore microbial interactions, we first focused on specific taxa at the genus level within the same trophic group. The proportions of these interactions exhibited more pronounced fluctuations within trophic groups than between groups (Fig. 4E, F; Supplementary Fig. 4). Notably, amensalism (−/0) was prevalent among the taxa within the fermentative bacteria, with the proportion of amensalistic interactions sharply increasing from Phase I to Phase III and surpassing that of the entire community. For example, in Phases I and II, Clostridium sensu stricto 6 exhibited the highest values for average strength out and hub centrality among the 10 fermentation taxa, exhibiting strong negative edges to Streptococcus in Phases I and II and to Propioniciclava and the uncultured SJA-15 in Phases II and III (Supplementary Table 1; Supplementary Fig. 5). Conversely, the commensalistic (+/0) interactions within methanogenic archaea and syntrophic bacteria exhibited greater fluctuations than did those occurring between trophic groups (Fig. 4E). Fluctuations in the commensalistic interactions of taxa within the syntrophic group were primarily due to shifts in interactions between syntrophic genera strictly specialized in butyrate and propionate niches (i.e., between Syntrophomonadaceae and Syntrophobacter) or between versatile syntrophic genera capable of degrading aromatics and VFAs (i.e., between Syntrophus and Syntrophorhabdus45,46; Supplementary Fig. 6). Within the methanogenic group, the commensalistic (+/0) interactions primarily involved methylotrophic methanogens (Methanomethylovorans and Methanomassiliicoccus) and functionally unknown Micrarchaeales. Although no methyl compounds, such as methanol and methylated amines, were detected in this study, these taxa exhibited positive edges to hydrogenotrophic methanogens such as Methanospirillum and Methanobacterium (Supplementary Fig. 7).
Syntrophic degradation of propionate and butyrate typically requires cooperation (+/+) between syntrophic bacteria and methanogenic archaea6,47. Our investigation revealed that these trophic groups were primarily engaged in commensalistic (+/0) interactions. Versatile syntrophs exhibited stronger edges (mean order of magnitude: 10−2 for Syntrophorhabdus and 10−3 for Syntrophus) to methanogenic archaea than did strict SBOB (10−3 for Syntrophomonadaceae and 10−4 for Syntrophomonas) and SPOB (10−3 for Syntrophobacter and 10−5 Smithella); during the transition from Phase I to II, Syntrophorhabdus exhibited a robust positive edge to hydrogen-dependent methylotrophic Methanomassiliicoccus (10−1) and hydrogenotrophic Methanobacterium (10−2) (Supplementary Fig. 8), indicating a hydrogen-dependent syntrophic association. This observation aligns with the concentration profiles of butyrate and H2 (Fig. 2B, C). However, in Phase III, when H2 levels were undetectable, Syntrophorhabdus received weak edges from methylotrophic Methanomethylovorans and Ca. Methanofastidiosum. This finding suggests that the syntrophic association was highly dynamical and may be associated with H2 concentrations. Moreover, the finding of a distinct three-phase transition pattern in various network topological properties, including node properties (strength in, strength out, and strength all)32, hub33, authority34, and degree35, further supported that highly dynamical microbial interactions occur (Supplementary Fig. 9).
Causation between reactor performance, community structure, and microbial interaction
The structural instability of the interaction network was significantly associated with system performance, bioenergetics, IS, and microbial alpha diversity (Supplementary Fig. 10). The strong interdependency among the three key modules—reactor performance, community structure, and network features—suggests the presence of feedback interactions among them. To validate this notion, we conducted CCM analyses to establish causal links between and within the variables across modules13,20. The analysis of the causal network revealed bidirectional causations with crucial coupling feedback between variables within the same module and robust causal links between different modules (Fig. 5; Supplementary Fig. 11). These findings indicate that the bioreactor functions as a complex feedback dynamical system, where microbial interactions, community composition, and metabolite profile (e.g., ΔG33′) mutually influence each other, driving microbial community succession from one stage to the next. These intricate feedback mechanisms guided the microbial community of the sludge inoculum toward establishing a robust network structure and elevated species interaction during succession. This, in turn, facilitated a more stable and enhanced reactor performance. That is, stronger exergonic activity during sucrose decomposition corresponded to increased stability in the structure of the microbial community and interaction network.
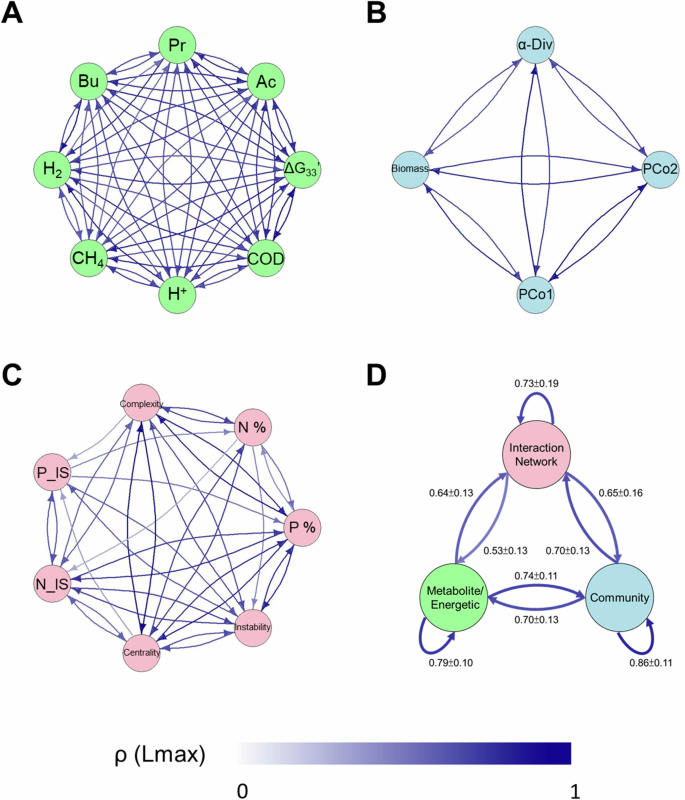
A The metabolite/energetic group. B The community structure group. C The interaction network group. Panel D illustrates the averaged strength of causality of variables across the three groups, with the self-pointing arrow indicating the averaged causality strength within the group. The summary distribution of CCM skills between pair-wise groups is visualized in Supplementary Fig. 11. The color bar represents the scale of the CCM skill at the maximal library length, ρ(Lmax), indicating the causal strength (See Methods). Only significant (p < 0.05) causal linkages are included in the causal network. Detailed abbreviations can be found in the Methods section. Bu, butyrate; Pr, propionate; Ac, acetate; α-Div, Shannon diversity; PCo1 and PCo2, first and second axis of PCoA; P_IS, average positive interaction strength; N_IS, average negative interaction strength; P %, proportion of the positive interaction; N %, proportion of the negative interaction; centrality, average degree.
Discussion
By analyzing each day of a 110-day dataset through EDM, we revealed a complex causal interplay among reactor performance, bioenergetics (or metabolite profile), community structure, and properties of reconstructed networks. This analysis revealed a more robust causality within the methanogenic reactor system (ρ(Lmax) = 0.68 ± 0.18) compared to natural systems (e.g., the causal relationship (ρ(Lmax) = 0.19 ± 0.16) from temperature to ecosystem function20). Our study provides the first comprehensive description of the intricate feedback among these aspects within a methanogenic reactor. Whereas previous studies have focused on the influence of single deterministic factors, such as temperature9, ammonia8, sludge bulking7, and ion strength48, on community assembly or reactor performance, we focused on the inherent dynamics and complexity of anaerobic reactor systems. Interestingly, even without exogenic factors (i.e., reactor operation at fixed parameters), significant changes in community structures and reactor performance were observed, emphasizing that microbial populations autonomously drive temporal variations in community assembly. These variations are underpinned by the complex feedback mechanisms between chemical reactions (metabolite and free energy), community structure, and species interactions.
We observed increased stability in the microbial community as complexity and mean IS increased during the transition (Phase II) from the initial inoculum (Phase I) to a functional community (Phase III), effectively converting sucrose to biogas. The observed increase in community stability with the mean IS is consistent with findings from studies on bacterial communities in natural beach environments, where strong positive interactions were noted to stabilize microbial communities19. However, this contrasts with the findings of another study that weaker interactions drive community stability in fish communities49. This discrepancy may be attributed to the simultaneous increase in IS and the diversity of interaction types (i.e., interaction complexity); furthermore, our research indicates that interaction complexity may play a more critical role in determining stability. This finding aligns with the theoretical hybrid community model, which posits that greater interaction complexity, characterized by higher species richness and a wider variety of interaction types with more balanced proportions, enhances community stability50. Also, the study involving paddy soil samples analyzed using a co-occurrence network method suggested that the complexity of the microbial interaction network has a great impact on soil function than species diversity51. An increase in positive interactions was observed during Phase I, which coincided with environmental filtering and a relatively unstable microbial community and reactor performance. Subsequently, a notable rise in the proportion of negative interactions was observed during the transition from Phase II to III, which may have contributed to stabilizing community assembly and reactor performance in Phase III. This time-dependent pattern can be partially explained by Wigner’s semicircle law, suggesting that negative interactions, such as competition, can enhance community stability by forming more stabilizing negative feedback loops52,53. Furthermore, as the reactor operation proceeded, positive and negative edges increased, with the average negative strength outweighing the positive (Fig. 4B and C). This may have contributed to a sharp increase in stability from Phase II onward until the reactor system stabilized in Phase III. Notably, the timing of the transition from positive to negative interactions coincided with the alleviation of H2 accumulation starting from Phase II, indicating a crucial regulatory link to temporal variations in H2 levels. Previous research on anaerobic digesters demonstrated that H2 injection increases the number of cooperative interactions54. The strengthened cooperative interactions may mitigate H2-related stress, which represents the thermodynamic barrier of the anaerobic catabolism.
The analysis of interaction identities revealed greater variability in interaction types within trophic groups (coefficient of variation: 61 ± 33 for commensalism and 76 ± 17 for amensalism) than between them (31 ± 6 for commensalism and 40 ± 8 for amensalism between trophic groups) (Fig. 4E and F). The interactions within each trophic group were predominantly asymmetric. As the system stabilized, the fermentation group exhibited an increase in the proportion of amensalism (−/0) and a stronger mean negative IS (Fig. 4F; Supplementary Fig. 12). Because of the high functional redundancy in saccharide fermentation abilities55, this upward trend indicates that various fermentative populations may have experienced elevated competition for sugar56. Conversely, the populations within syntrophic bacteria and methanogenic archaea demonstrated elevated commensalism (+/0) levels and distinct fluctuations across different phases (Fig. 4E). This disparity may have arisen because different syntrophic bacteria and methanogenic archaea might use different substrates, depending on their chosen catabolic pathways, whereas the fermentative bacteria solely competed for sucrose. Additionally, commensalistic (+/0) partnership may benefit syntrophic bacteria and methanogenic archaea, enabling them to thrive under changing substrate/metabolite conditions (e.g., VFA concentration and H2 partial pressure) and the thermodynamic edge5,57.
Our network analysis explored the unique species interactions and associated dynamics within the network and provided novel insights into prominent interactions within three trophic groups. The findings indicated that Clostridium sensu stricto 6 played a crucial role in the network and exhibited strong, negative strength-out activity across the three phases, forming positive edges only in Phase I. The hub centrality of Streptococcus was reduced in Phase III, whereas the authority magnitude of Propioniciclava and uncultured Anaerolineae SJA-15 was increased in Phase II (Supplementary Table 3). These dynamic shifts in network characteristics partly explain the transition of dominant fermentation populations from Clostridium sensu stricto 6 and Streptococcus in Phase I to Propioniciclava in Phase III, reflecting the progression of sucrose fermentation. Compared with the syntrophic interactions between versatile syntrophic bacteria and methanogenic archaea, those involving strict SBOB and SPOB were weak (Supplementary Fig. 8). Additionally, the strict SBOB exhibited higher interaction activity (i.e., strength in) than the strict SPOB did in Phases I and II (Supplementary Table 3), aligning with the observed slow development of propionate degradation capability. The rate-limiting nature of syntrophic propionate degradation in the sucrose-to-biogas conversion process may stem from its higher free energy barrier for oxidation than that for butyrate. Efficient syntrophic propionate oxidation requires the establishment of structured consortia to enhance interspecies electron transfer58,59. However, most of the biomass in the reactor remained flocculant throughout the study period.
Our results suggest a strong feedback loop between reactor performance and the stability of the interaction network, with superior reactor performance being linked to a more stable microbial community (Fig. 5; Supplementary Fig. 10). This finding suggests enhancing reactor efficiency and stability may be possible by managing microbial interaction complexity16,60,61. In particular, selecting appropriate seeding microbial consortia – such as those with high species diversity or taxa that promote network stability – could improve overall stability when initiating a new reactor. Another approach involves bioaugmentation, where specific microbial taxa are introduced to biogas-producing systems to enhance performance. For example, targeting microbes with favorable network characteristics such as a modest contribution to network stability (trace), significant influence on other microbes (hub), and strong connectivity (degree) – could be effective. The syntrophic bacteria Syntrophus and Syntrophorhabdus, which rank in the top 25% for hub characteristics and moderate for network trace (26% ~ 50%), and the hydrogen-dependent methylotrophic Methanomassiliicoccus, with high degree values and low trace (top 25% in degree and bottom 25% in trace) (Supplementary Table 1), exhibit high potential for such applications. These populations, crucial to microbial networks, are rarely highlighted in bioreactors treating the non-aromatic substrates. Given their pivotal role as the rate-limited step in converting organics into methane, further exploration of these microbes in stabilizing community interactions is warranted. Additionally, several lesser-known taxa, often referred to as “microbial dark matter,” were found to play crucial roles within the interaction network (Supplementary Table 1). For instance, uncultured Desulfobacterota and SAR324_clade_marine_group_B rank among the last 25% in trace, and the top 25% for both hub and degree, indicating strong network influence. However, these taxa show potential benefits for reactor performance; their unculturability and lesser-known nature present challenges for practical application. Considering their robust interaction activities, further investigation of their physiological and ecological functions using culture-dependent and omics approaches is necessary.
The MDR S-map operates within the EDM framework and can be applied to all non-linear systems, including UASB reactors, batch anaerobic digestion processes, and other biological reactors. However, its application comes with technical limitations. Adequate time series data with equal intervals (e.g., daily or weekly) are required, and the necessary data length depends on factors such as data quality and the degree of stochasticity. This study successfully employed a nonlinear empirical dynamic modeling approach with high-resolution time series data to systematically explore the features of time-varying interaction networks and the catabolic performance of microbial consortia within a biogas-producing system post-startup. The results suggest that the community succession of microbial consortia from reactor startup to stable performance is driven by complex feedback mechanisms involving microbial interactions, community structure, and catabolic energetics. We identified that fermentative bacteria, which exhibited significant variations in community composition and interaction properties, may contribute to an unstable network structure. Conversely, microbes, such as syntrophic bacteria (Syntrophus and Syntrophorhabdus) and hydrogen-dependent methylotrophic Methanomassiliicoccus, likely play key roles in stabilizing network dynamics, thereby improving system performance. These insights provide an in-depth understanding of microbial interaction dynamics, enhancing our comprehension of microbial ecology and unlocking new opportunities for managing the stability and efficiency of sustainable biogas-producing systems. However, these findings should be validated in the future since the metabarcoding analysis used to assess the microbial community may introduce biases during amplicon preparation and sequencing, potentially affecting the accuracy of microbiomic state-space reconstruction.

Responses