Deep generative modeling of annotated bacterial biofilm images

Introduction
Aggregates of microorganisms in which cells are frequently embedded in a self-produced matrix1 of extracellular polymeric substances (EPSs) that are adherent to each other and/or a surface are called biofilms2. Biofilms form on medical devices3, industrial lines4, food5, water pipes6, soil7, and other sources. Biofilms are extremely widespread, ranging from the bottom of the ocean to human organs.
The importance of this emergent form of bacterial life is that biofilms are responsible for many biogeochemical cycling processes and numerous infectious diseases8,9,10. Biofilm-related diseases affect cardiovascular11, reproductive12,13, respiratory9 and digestive14 systems. Thus, biofilm studies can seriously affect the quality of life of many people. The effects of antibiotic treatment on biofilms have been actively studied with a large range of imaging methods to invent new pharmacological drugs15. Biofilms are also actively used in biotechnology. The applications include biofilters, bioreactors, biosensors, and biocatalysts16,17,18. The design of these devices also requires versatile and in-depth analysis of biofilm structure and biofouling.
Biofouling is a multistep process of biofilm growth and development19. The first step is attachment, where cells are separated from each other. During the phase of cell-cell adhesion, clusters of cells are formed. As the biofilm matures, the number of cells increases, and matrix is formed1. By the end of the maturation process, a complex multilayer biofilm is typically developed. Understanding the mechanism of biofouling is key to managing the nature of biofilms20. A crucial step in studying biofouling and many processes involving cells is to investigate the locations of individual cells21,22,23. All of these described procedures rely on image analysis techniques24 such as segmentation and object detection (Fig. 1a).

a Automated quantitative analysis of macroscale areas covered by a biofilm requires the creation of segmentation and detection models. b Image analysis tasks: segmentation and detection can be performed in three ways: human annotation, classical computer vision algorithms, and supervised artificial intelligence (AI) models. c A synthetic image training dataset for high-quality AI segmentation and detection can be collected with the use of generative neural networks.
Biofilm imaging can be accomplished through various types of microscopy. Two popular methods—confocal laser scanning microscopy (CLSM) with fluorescent labels25 and electron microscopy (EM)26—have been widely used in biofilm studies. While epifluorescence confocal microscopy is commonly used27 for biocide effect evaluation, electron microscopy is of much demand in the field of morphology characterization28 due to its significantly higher resolution. Scanning electron microscopy (SEM)29 is an instrumental method for studying the surfaces of solid objects. It is widely used for morphological observation of materials30,31, characterization of nanoparticles32, investigation of bacterial cells26 and detection of viruses33. Modern electron microscopy imaging of microbial samples allows precise identification via deep morphological examination. The study of the internal structure and wide external appearance of macroscale bacteria-covered areas can also be performed34. With a high resolution unachievable for optical detection as a key advantage, SEM has crucial limiting disadvantages, such as a slow rate of data accumulation, expensive hardware, specific sample preparation and time-consuming operation.
SEM image segmentation can be automatically performed using various software tools (Fig. 1b), which are based on classical computer vision algorithms (e.g., thresholding)35. However, such approaches usually exhibit low performance. Compared with classical computer vision algorithms, deep learning (DL) segmentation36 and object detection37 models have demonstrated superior performance36,38. Unfortunately, these models rely heavily on annotated data for training, which again emphasizes the problem of fast accumulation of annotated SEM images39. Moreover, models that have been trained on images from a particular electron microscope may lose performance on images from another electron microscope. This issue is called the data bias problem40. Training dataset augmentations (specific image transform operations that artificially expand the training data space) can help to address this issue.
The generation of annotated training images could make the data collection process more adaptive41,42. Generative neural networks, such as diffusion models, generative adversarial networks (GANs)43,44, and variational autoencoders (VAEs)45,46, are already widely used in the computer vision field. The generation of synthetic imaging data allows effective segmentation and detection model training for quantitative analysis when the volume of manually annotated images is limited47.
However, there may be some artifacts in the obtained synthetic images caused by the generative models and distribution mismatch with the experimental data. The inaccuracies of the generated data can be corrected using image-to-image translation models such as CycleGAN48,49. This approach allows synthetic images to look like real biofilms and removes minor differences. One of the advantages of CycleGAN is the possibility of using unpaired datasets in such situations when the creation of paired image datasets is impossible.
In the present study, we developed a DL framework for the generation of synthetic electron microscopy data of fully annotated biofilm images. With the use of the developed approach, neural network single-cell segmentation and detection have become available with different instruments and imaging modes. Only one hundred manually annotated SEM images are required to create a dataset as large as needed for model training (Fig. 1c). We show the applicability of the generated training data in segmentation and detection downstream tasks. A high speed of synthetic data generation has been demonstrated. The models can be accessed through a custom web application.
The various settings of our method allow the generation of images of both the early phase of biofilm development and the later phases. Moreover, we test the developed approach on various source data and show that it adapts easily to images of other types of microorganisms, such as coccobacilli and cocci. All these factors prove the sufficient flexibility and versatility of the framework for generating microbiological synthetic data.
Results
Pipeline overview
The workflow for the generation of a synthetic dataset is presented in Fig. 2. First, an experimentally recorded starting number of bacterial images were obtained in this study using SEM. Then, the process of pre-annotation allows the extraction of single cells and separate support. Pre-annotation can be performed manually with computer vision annotation tools or using weak unsupervised algorithms for segmentation. This procedure makes it possible to extract single cells and support from the image and create training datasets for subsequent synthetic image generation. Then, the training and validation of the generative models are performed for single-cell generation (VAE, GAN, diffusion network)43,45,50 and cell-free support generation (diffusion network). The merging of single cells and cell-free support is implemented at the final stage of the developed pipeline. Since combining multiple images can produce artifacts, image-to-image translation had to be performed to match the distribution of real data. However, paired training data are not available. CycleGAN48 allows learning to translate an image with artifacts to high-quality images in the absence of paired examples. The result of running the pipeline is a large dataset with synthetic annotated biofilm SEM images, which were generated from a small number of pre-annotated real images of bacteria. All the steps are described in detail in the respective sections below.
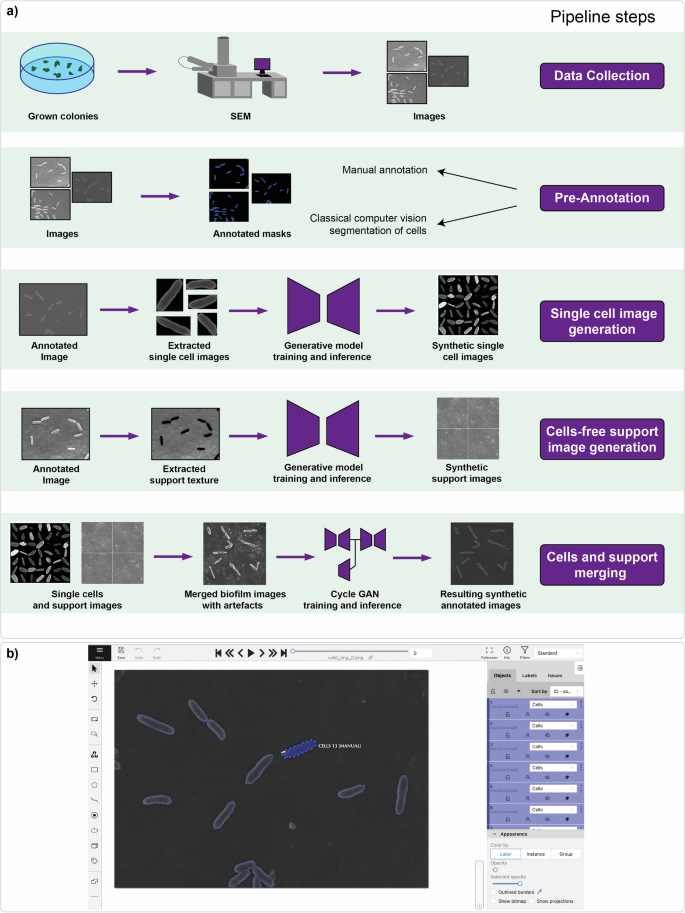
a Pipeline steps: 1) data collection of grown colonies at the initial stage of biofilm formation with SEM imaging; 2) pre-annotation of collected images from the first step to create datasets for generative model training; 3) single-cell image generation implemented with VAE, GAN, and diffusion neural networks; 4) cell-free support image generation implemented with a diffusion model; and 5) merging of single cells and cell-free support on one image can be performed with the CycleGAN network. b Manual annotation process. The CVAT web instrument was used in this research.
To generate images of the late phase of biofilm development, the use of a larger number of single cells while merging with a cell-free support is sufficient. After that, it is necessary to train the CycleGAN model for style transfer from real biofilm images to synthetic images.
Pre-annotation
As mentioned above, pre-annotation can be performed in two ways: manual annotation (Fig. 2b) or unsupervised computer vision segmentation. The comparison is presented in Table 1.
Manual annotation
Single-cell ground truth annotation was performed by researchers trained by an expert with domain knowledge. The computer vision annotation tool (CVAT)51 was used to speed up the annotation process. The number of processed images of Pseudomonas veronii was equal to one hundred, and the total number of extracted single cells was equal to 1910 (Fig. 2b).
Unsupervised segmentation of cells
When human annotation is impractical, classical algorithms for image processing and interpretation can be used instead. In the described workflow, two approaches for cell extraction were implemented.
The first method is based on Blob detection. The main assumption for the successful application of this algorithm to SEM images is that individual bacteria have a round or elliptical shape. Thus, segmentation is based on detecting the boundaries of these geometric shapes (so-called blobs).
To implement this approach, the OpenCV Python library52 was used. We followed these steps:
-
1.
Image blurring with an averaging filter.
-
2.
Image thresholding (Inverse-Binary and Otsu algorithms). After this process has been completed, the image will have a white background alongside black regions that could represent cells.
-
3.
Morphological closure operation to reduce noise.
-
4.
SimpleBlobDetector parameters initialization (area, circularity, convexity and inertia).
-
5.
Final mask construction from the collected boundaries of the blobs.
The second method is based on image thresholding with automated contour analysis for artifact removal. The technique can be described with the following steps:
-
1.
Image thresholding is used to obtain binary masks, where cells and artifacts are still in the same segmentation class.
-
2.
Artifact filtering was performed based on the difference between the lengths of the initial and approximated contours (most artifacts have an irregular contour, unlike the contours of cells).
We compared both methods and calculated several metrics to evaluate the segmentation quality. The average values of each metric for the entire biofilm dataset are shown in Table 2.
Single-cell image generation
Single-cell images can be generated with various neural network architectures. In the developed workflow, VAEs, GANs, and diffusion models act as single-cell image generators. A wide variety of architectures are necessary to enable fast sampling (VAE, GAN), high-resolution of generated images (GAN, Diffusion) and diversity (VAE, Diffusion).
Variational autoencoder (VAE) training
Training data were extracted from manually annotated SEM images of bacteria (see the “Manual annotation” subsection in the “Results”).
To ensure accurate neural network training, it is necessary to implement proper preprocessing techniques for cell images of varying sizes. Notably, simple image resizing leads to distortion of the cell shape. To overcome this issue, we perform the transformation, which pads the rectangular image with a cell to a square and then resizes it to a fixed size.
There are two main approaches for implementing the VAE architecture to generate images: utilizing linear or convolutional layers. Convolutional layers facilitate local feature extraction53. Convolution involves the application of learnable filters (kernels) to small regions of the input image. This allows the network to automatically learn features such as edges and corners. The technical details of the VAE training can be found in the Supplementary Information.
The results of the model training are shown in Fig. 3a. It is evident that the convolutional VAE yields superior generation quality. The converging loss and Kulback-Leibler (KL) divergence learning curves (Fig. 3b) indicate that the neural network was able to learn latent state distribution.
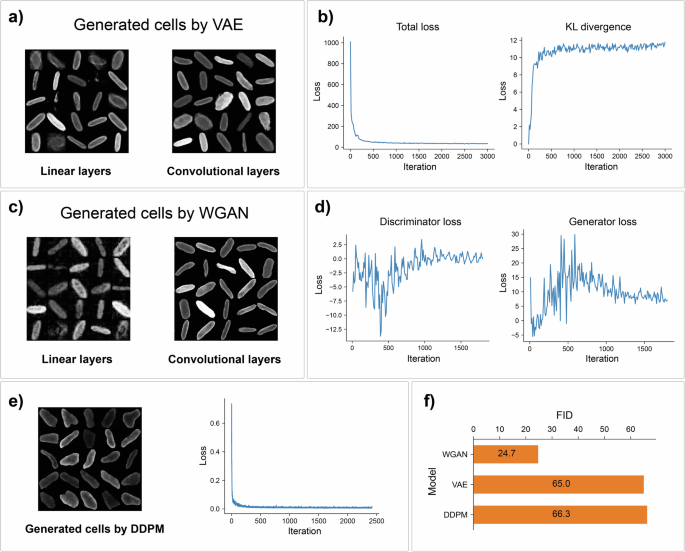
a VAE implementation with convolutional layers yields more realistic images. b Learning loss curves for the convolutional VAE. c Comparison of images generated by WGAN with linear and convolutional layers. d Training losses of the discriminator and generator for WGAN with convolutional layers. e Example of images generated using the diffusion model and training loss curve. f Comparison of the FID metric for the implemented generative models: WGAN achieved much better results than the other models.
Generative adversarial network (GAN) training
The Wasserstein GAN (WGAN)54 implementation achieved better results. The reasons for choosing the WGAN over the original GAN formulation are as follows: 1) WGAN is more stable than Vanilla GAN because of the use of the Wasserstein distance instead of the Jensen-Shannon divergence to measure the distance between real and generated data distributions; 2) WGAN uses gradient clipping to prevent excessively large gradients, which could result in instability during training; 3) WGAN does not suffer from the problem of generator saturation, where the generator produces only a limited range of outputs; and 4) WGAN shows greater robustness during hyperparameter tuning.
Similar to the VAE, the WGAN performs better when convolutions are used (Fig. 3c). The discriminator and generator loss curves for the convolutional WGAN (as shown in Fig. 3d) indicate that there is no vanishing gradient problem since the generator is able to acquire sufficient information for learning. The technical details of the GAN implementation can be found in the Supplementary Information.
Diffusion model training
The diffusion probabilistic model50 is another approach that can be used for image generation. It represents a parameterized Markov chain that is trained using variational inference to produce better samples that better fit the space of the source data. The diffusion generative model consists of two processes, forward and reverse, which aim for opposite purposes. In the forward process, a small amount of Gaussian noise is iteratively added to the images in a finite number of steps until the signal is destroyed. When the number of steps tends to infinity, the distribution of the data converges to N(0, I); in other words, the complex data distribution is converted into the chosen simple distribution. In the reverse process, the images are gradually restored using a neural network that trains to predict parameters for the reverse diffusion kernel at each timestep.
One of the benefits of diffusion probabilistic models is the diversity of generated images. To produce a new image, one has to take a random sample from the Gaussian distribution and perform the reverse diffusion process.
Generally, U-Net36 is used as an architecture for denoising neural networks. For the best representation from the usual U-Net architecture, the original double convolutions were replaced with residual blocks55. In addition, the self-attention module56 can be included in the neural network architecture. More technical details about the architecture can be found in the Supplementary Information.
To ensure that the neural network reverse process operates on consistently scaled inputs, the source data are mapped linearly to [−1, 1]. Additionally, we perform the transformation to resize all the images to square form and fixed size.
The results of the training diffusion model are shown in Fig. 3e.
The evaluation of generative models
The quality measurement of generative models is a separate nontrivial task57 because, in this case, it is impossible to compare only the predicted output and the true output, for example, as for supervised learning models. Generative models produce new images that should look as real as possible and have two properties: high quality and diversity. Therefore, it is necessary to use a metric that can evaluate both listed criteria.
Currently, in computer vision, two main approaches are used to compare images:
-
1.
The pixel distance measures the pixel-by-pixel difference between two images, for example, the mean squared error. When generating new images, we want to avoid the precise reproduction of training data, so this metric is not relevant here.
-
2.
The feature distance compares not the images themselves but their high-level representations extracted from the pretrained image classification model. This method allows calculating the distance between obtained representations.
The most popular metric for evaluating generative models is the Frechet Inception Distance (FID)58, which assesses the distance between two distributions. In the case of images, the FID compares the distribution of real images and the distribution of generated images. As a feature extractor, this metric usually uses the Inception V3 model pretrained on the ImageNet dataset without the last layer.
We calculated FID scores for each generative model implemented for cell image generation (Fig. 3f). All models yielded different qualities of generated data, and this difference can be observed both visually and based on FID values.
Generated cell filtering
Naturally, the generated data can include several artifacts that may have strong differences between synthetic and real images. We generated a large number of cell samples and identified three main failure modes (Fig. 4a), which should be filtered from the obtained image set.
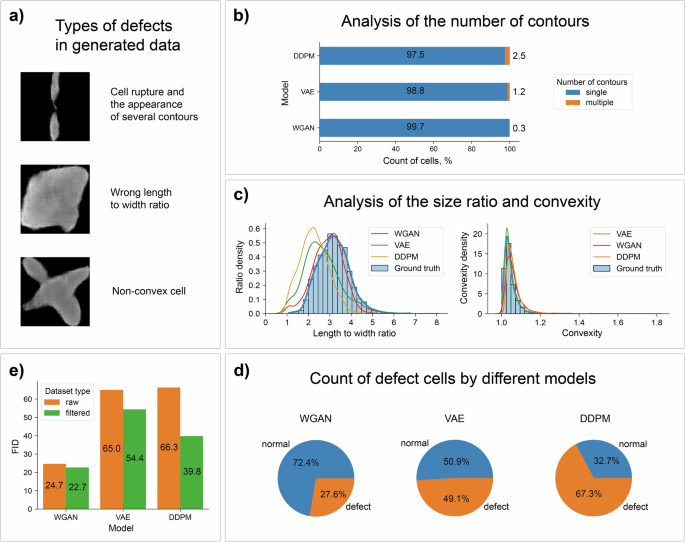
a The most frequent defects in the generated data. b Calculation of the percentage of images with multipart cells. c Distributions of the length-to-width ratio and convexity for cell images from each synthetic dataset. d Calculating the total number of images with artifacts from each generative model. e The implementation of filtering datasets has led to an improvement in the FID metric and quality of the obtained synthetic data.
The first defect type is a cell consisting of multiple parts. To detect and filter this case, we searched for contours present in the image and calculated their count (Fig. 4b).
The second artifact type is the length-to-width ratio of the cell, which is unusual for real data. Such cells look like large spots or, on the contrary, are too elongated. We calculated the distribution of the size ratio in the source cell dataset (Fig. 4c) to choose the boundary parameters for filtration. As a result, the size ratio of suitable cells is in the range [2.5, 5.5]. Moreover, as one can see, the WGAN samples match the real data distribution much better than the samples from the other models. Notably, the distributions for the VAE and diffusion models are quite close.
Finally, the third defect type is a nonconvex cell that has a significant discrepancy between the area of the contour and the area of its convex hull. The distribution of the cell convexity was calculated and is shown in Fig. 4c. Note that most cells have a convexity value less than 1.25, and this value was used for filtering generated cell images.
Overall, the WGAN had the smallest number of defective cells (Fig. 4d). Additional information about cell artifacts from different generative models can be found in the Supplementary Information.
To confirm the significance of the observed artifacts, we calculated the FID metric using the raw and filtered synthetic cell datasets for each generative model (Fig. 4e). The calculations showed that the FID values decreased as expected, which indicates an improvement in the quality of the generated images.
Support image generation
Synthetic images of the supports were obtained using the diffusion probabilistic model due to the high quality and diversity of the produced data. The training dataset consisted of support images extracted from source SEM biofilm images by isolating areas without cells (Fig. 5a). The retrieved images were 256 × 256 pixels in size, and the total number of samples in the dataset was 7503.
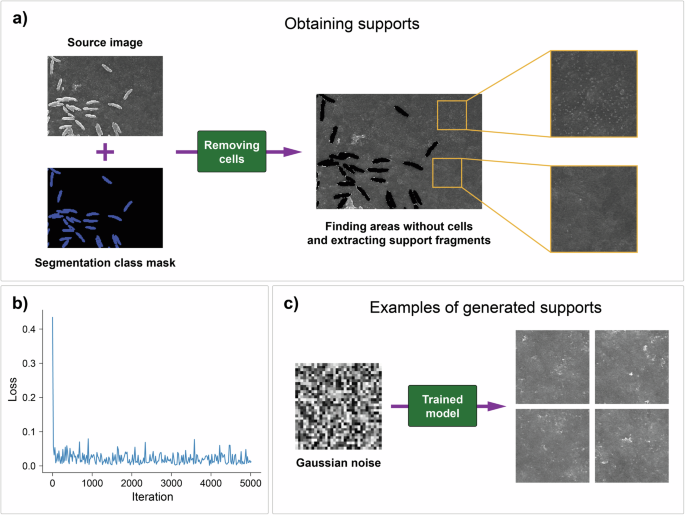
a The process of obtaining support images using a segmentation mask for search areas without cells. b Learning loss curve for the diffusion probabilistic model. c Generation of new samples from random Gaussian noise.
To improve the training and performance of a model, certain augmentations were applied to the training support images:
-
1.
Random horizontal and vertical flips.
-
2.
Changing brightness and contrast.
-
3.
Linear mapping of the image tensor to the range [−1, 1].
Additional information about training details and hyperparameters is given in the Supplementary Information. The loss curve (Fig. 5b) shows that the model was successful in predicting the noise added in the forward diffusion process. Additionally, we computed the FID metric for the generated support images (Fig. 5c), which was equal to 138.5.
Finally, VAE and WGAN were also explored for generating support images; however, these models were not further used due to the significantly lower empirically observed quality of the obtained synthetic data.
Cell and support merging
We investigated a real dataset to identify specific patterns in the biofilm images, hypothesizing the importance of determining the relative locations of cells on the support for generating new images. For example, manual inspection of the dataset revealed that there are some cases in which microorganisms form pairs adjacent to each other in a certain way. We identified five basic types of cell positions: single-cell, vertical pairs, coroner pairs, horizontal pairs, and horizontal pairs with shifts (Fig. 6a). The discovered cell configurations are observed at different frequencies, and this information should be used in the synthetic image generation process. We calculated the fractions of various cell positions in the real dataset (Fig. 6b). Notably, the most common types are single cells and vertical pairs, accounting for approximately three-quarters of all cells.
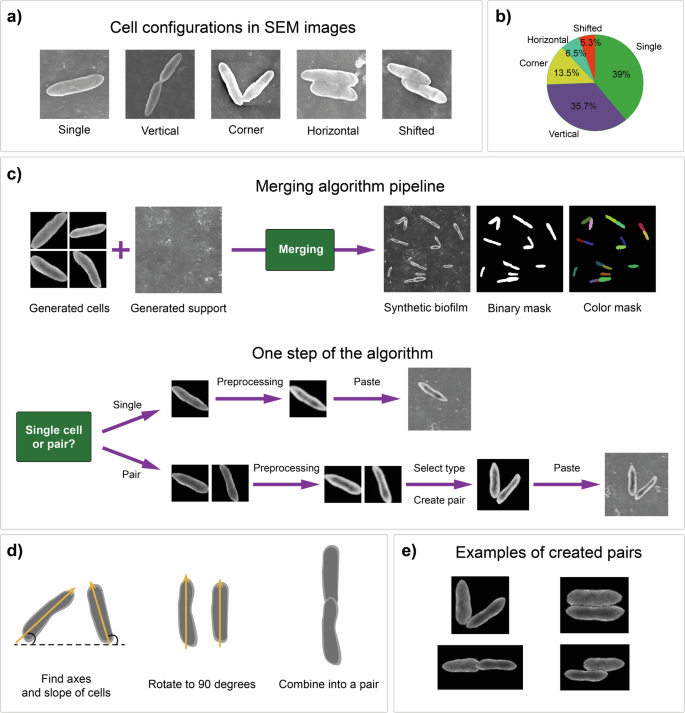
a Main cell configurations observed in biofilm images. b Frequencies of different cell location types in the source dataset. c Logic of the merging algorithm and key operations performed at each step of adding the cell structure. d Common principle of forming cell pairs from two separate cells. e Main types of pairs obtained from synthetic cell images using the algorithm.
The general workflow of the merging algorithm is shown in Fig. 6c. Each synthetic biofilm is constructed from a random sample of generated cell images and a single generated support image. This approach allows for the production of not only biofilm images but also binary and color masks, along with an annotation file with labels, which can be useful for object detection, semantic and instance segmentation, or other computer vision and image processing tasks.
During the creation of the entire biofilm, individual cells or pairs of cells are inserted with certain probabilities at each step of the algorithm. Several preprocessing operations are performed on all the cell images:
-
1.
Brightness correction to the average brightness level of real cells.
-
2.
Blurring of images with a Gaussian filter.
-
3.
Resizing images to a certain cell size for a particular biofilm.
The merging algorithm includes the preliminary construction of one of the cell location types. The choice of configuration is determined by its probability. The formation of the pair occurs in three basic steps (Fig. 6d): 1) the axis of each cell and its angle of inclination relative to the horizontal are identified; 2) the angle of rotation was calculated to be 90 degrees to adjust the position of the cells; and 3) two cells were combined into a pair.
The cells are located next to each other with a small overlap depending on the cell configuration type. Examples of different obtained pairs are shown in Fig. 6e.
Additionally, at each step of the algorithm, an annotation label list is formed by saving the corresponding cell types. For example, if at the current step a single cell is placed on the biofilm, the value 1 is appended to the annotation list. However, if a vertical pair is inserted on the biofilm, the list is updated with two values equal to 2. This list of labels can be useful, for example, for calculating quality metrics of detection and segmentation models.
CycleGAN training
The algorithm described above combines cell and support images according to specific rules but does not inherently account for complex similarities with real biofilms. For instance, SEM images exhibit several artifacts, such as shadows (artifacts resulting from charge accumulation on the sample surface) and unique textures of the support, attributed to the three-dimensional structure of the observed objects.
To give synthetic images these characteristics, we utilized the image-to-image translation capabilities of the CycleGAN model. The choice of CycleGAN was motivated by its ability to work with unpaired datasets and its stable training process. This model allows the transfer of characteristics from one image domain to another, effectively enabling mapping from the input to the output images.
CycleGAN is based on generative adversarial models and comprises two generators and two discriminators, each corresponding to their respective image datasets. We denote the set of synthetic biofilm images constructed by the algorithm as Set A and the set of real biofilm images as Set B. The generator GAB receives image A and generates image B (referred to as “generated B”). The discriminator DB is trained to determine whether the sample is a real B image or a generated B image (Fig. 7a). Similarly, the generator GBA creates image A from image B, and the discriminator DA differentiates the sample from real Set A and from generated Set A.
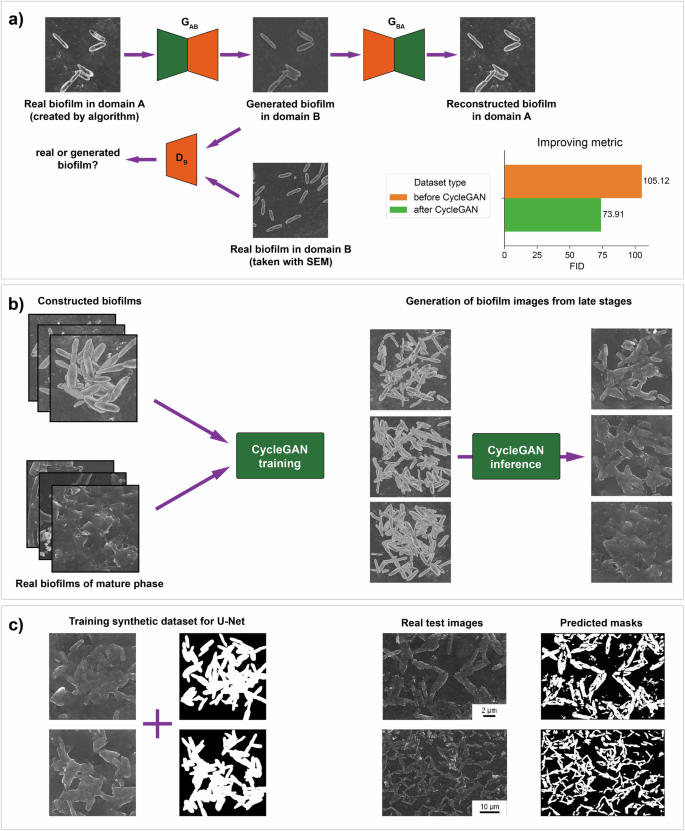
a The CycleGAN model allows image-to-image translation. This model is used to transfer the characteristics of real biofilms to synthetic biofilms. With this approach, the quality of images has increased. b Training the CycleGAN for the generation of biofilms from late stages of formation. The model allows visualization of the matrix and cell adhesion. c Application of generated datasets for training the U-Net model for segmentation.
For the purpose of training CycleGAN, we prepared two datasets: one consisting of 700 real SEM biofilm images extracted and another consisting of 700 synthetic images produced by the merging algorithm using generated cells and supports. All the images were resized to a size of 256 × 256 pixels. The technical details of the training are provided in the Supplementary Information.
In the inference phase, we employed the generator from the 60th epoch to generate a dataset of synthetic biofilm images. This approach significantly enhanced the realism of the synthetic images, enabling a more accurate representation of biofilm structures and characteristics.
Generation of late stages of biofilm development
In nature, the biofilm development process consists of several stages: initial attachment, irreversible attachment, maturation and dispersion59. The possibility of complex studies of these mechanisms is important for microbiology, which requires a sufficient amount of data from all stages. For this reason, the developed approach should be extended to the possibility of generating images of later phases of biofilm formation.
We assumed that for this purpose, it would be enough to place a larger number of cells on the support image and then train a new CycleGAN model.
First, we collected approximately 50 SEM biofilm images from 2–4 stages of formation and prepared a real dataset containing 800 cut-out fragments of 256 × 256 pixels. We created a synthetic dataset of 800 images of 256 × 256 pixels size via our algorithm, where from 50 to 120 cells were located with overlap within each image. According to the assumption made above, this way allows to approximately reproduce clusters of clumped cells. Finally, we use these two datasets to train the CycleGAN model for style trans“training” instead of “traning”fer. As shown in Fig. 7b, the trained CycleGAN allows the simulation of realistic clusters of cells and the matrix. The detailed training information is given in the Supplementary Information.
For the inference phase, we used the generator from the last 400th epoch and created a synthetic dataset consisting of 450 images to train the U-Net model for segmentation (Fig. 7c).
Training Mask R-CNN on synthetic data
We applied the developed approach to generate an annotated biofilm image dataset for training a detection and segmentation model. Mask R-CNN60 was selected as such a model because it enables the simultaneous solving of both tasks. We started from a model pretrained on the COCO dataset61 and finetuned it for our case.
To prove that highlighting specific cell configurations is important and can improve the accuracy of the model, two experiments were performed (Fig. 8a). The first model was trained on a dataset with random locations of cells on the support. In contrast, the dataset for the second model was created by a merging algorithm that considers cell configurations.
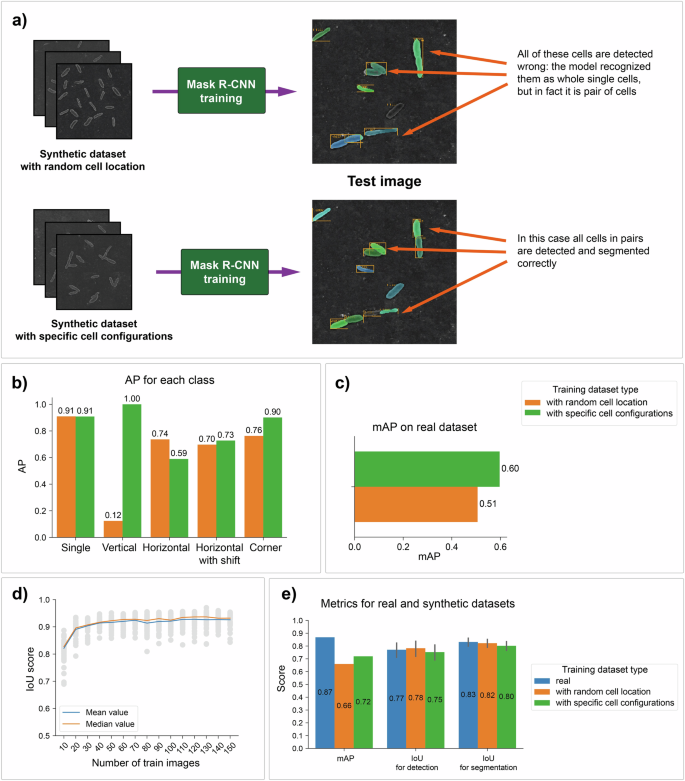
a, b Comparison of Mask R-CNN models trained on two different synthetic datasets: one with random cell locations and one with specific patterns. The second model showed better results in the detection and segmentation of paired cells, and these results can be observed both visually and quantitatively. c Comparison of two Mask R-CNN models on a real biofilm dataset. d The relationship between the IoU score and the number of images in the training dataset. The IoU reaches a plateau at 110 images. e Comparison of Mask R-CNN trained on the real manually annotated dataset with two models trained on generated datasets. Gray lines denote percentile intervals.
To evaluate the obtained models, we created a synthetic annotated test dataset and calculated the AP metric for each cell class for both models (Fig. 8b). The results revealed a much better quality of detection when the model trained on the dataset with specific cell locations was used.
Additionally, we compared the mAP metric using the real biofilm dataset consisting of one hundred images (Fig. 8c). The model trained on the dataset with cell patterns yielded a larger value of the metric. This result shows that the synthetic biofilm dataset can represent simple cell configurations found in real data.
We investigated how the IoU metric depends on the size of the training dataset (Fig. 8d). This information may be useful for choosing the number of synthetic biofilm images that are necessary for detection and segmentation model training. Stable quality is achieved when the size of the training dataset reaches 120 images.
Finally, we compared the performance of the models trained on synthetic data with that of the Mask R-CNN model trained on real data. The training dataset for this model consisted of 70 real manually annotated images, and the validation dataset for all the models consisted of 30 real images. The mAP metric showed that the model trained on manually annotated data works slightly better, but the IoUs for the detection and segmentation metrics are almost equal for all three models (Fig. 8e). Thus, in general, synthetic datasets are not inferior in quality and are suitable for training models used for the detection and segmentation of real biofilm images.
Synthetic data generation performance
To estimate the performance of the developed algorithm, a test was performed using a regular personal computer routinely available in the laboratory. With a personal computer having a 3.4 GHz 16-core CPU and NVIDIA GeForce RTX 3090 GPU during one day of operation, 1,296,000 images (including biofilms constructed by the algorithm, binary and color masks and biofilms processed by CycleGAN) containing 7,500,000 bacterial cells with a 640 GB total volume of data were generated. A set of 32 computational units after one month of operation can produce approximately 19 TB of data, which should be sufficient even for highly data-demanding applications.
Application of the method to other microorganisms
To demonstrate the flexibility of the developed approach, we ran the full pipeline not only for bacilli but also for coccobacilli and cocci. We present the results for Acinetobacter baumannii, Arthrobacter halodurans and Staphylococcus aureus below (Fig. 9a). For each of bacterial strains we trained three models (VAE, WGAN, DDPM) to generate cells and two CycleGAN models to style transfer for the early and late phases of the biofilm formation process, respectively. More examples of synthetic biofilms are provided in the Supplementary Information.
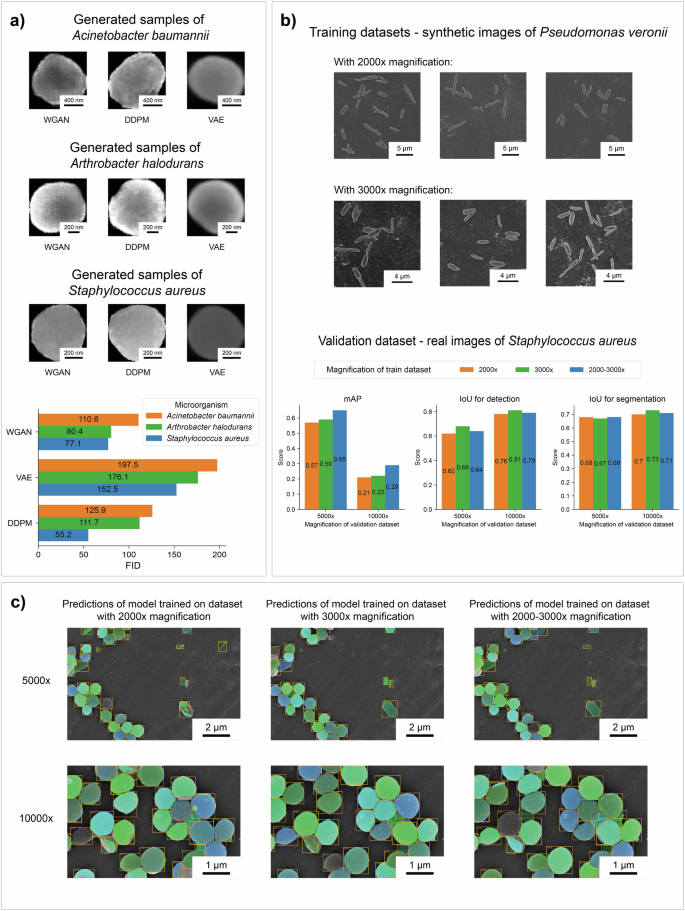
a Samples of generated cells by different models and the calculated FID metrics. b, c Results of testing the ability of the Mask R-CNN to recognize cocci in biofilm images. The models were trained using synthetic biofilm datasets with bacilli at different magnifications.
In this way, the small number of pre-annotated real images of microorganisms is sufficient for the generation of synthetic biofilm datasets. The approach is universal and can be used with various species of bacteria.
To investigate the generalization ability of detection and segmentation model, we performed the following additional experiment. The Mask R-CNN model was trained on the synthetic datasets of Pseudomonas veronii with cell pairs at different magnification and tested on a public dataset of Staphylococcus aureus34 (Fig. 9b, c). The results showed that the model still retains a good ability to recognize cells despite the presence of another type of microorganism in the images.
Notably, the model trained on images at 2000x magnification tries to find smaller objects, which leads to false detection of support defects, the space between cells and separate cell parts as individual bacterial cells. However, the model still correctly recognizes most cocci cells at different magnifications despite the difference in shape. Training on a mixed dataset that consisted of images with different magnifications partially solved the problem and improved the quality of recognition.
Therefore, models trained on synthetic data manage to generalize across different species. We suppose that this ability will improve with an increasing number of species imaged at various magnifications.
Discussion
This work demonstrates the application of deep generative modeling techniques for the generation of synthetic annotated biofilm images derived from electron microscopy data, which substantially contributes to advancing automated quantitative analysis at macroscale levels. Through the implementation of a diverse set of generative neural networks—Variational Autoencoders (VAEs), Generative Adversarial Networks (GANs), diffusion models, and CycleGAN for effective image-to-image translation—we have been able to produce a high-quality, extensive dataset from a relatively small collection of manually annotated SEM images. This achievement is particularly noteworthy, as it addresses critical limitations in the field of biofilm research related to data scarcity and bias, enabling more accurate and expansive computational analyses.
Our synthetic dataset can closely mimic real biofilm structures, facilitating the training of robust computer vision models. The application of the Mask R-CNN framework to our generated data illustrates a significant improvement in model performance, particularly in identifying and analyzing complex biofilm cell configurations. This not only underscores the efficacy of our generative modeling approach but also highlights its potential in enhancing the understanding of biofilm behaviors and structures.
The developed algorithm has high performance and allows generation of large automatically annotated datasets in a few hours. This approach minimizes human time costs on the manual annotation of SEM images and does not create restrictions on the amount of data produced.
We also provide a web application for on-demand biofilm image generation. Users can choose the number of images, models, image sizes, mean number of cells, and magnification levels. The generated images and masks are provided in a .zip archive, which can be downloaded.
Finally, the generative modeling framework presented in this study establishes a scalable and adaptable solution for overcoming data limitations in SEM image analysis and other microscopy techniques. By enabling the creation of large-scale, annotated training datasets, our methodology sets the groundwork for future explorations into automated biofilm analysis and offers promising avenues for both environmental and biomedical applications.
It is important to note the limitations of the described method that we intend to address in future work. First, adding new bacterial species requires the collection of corresponding images and labeling them to obtain an initial sample of cells. The development of more efficient species-agnostic cell segmentation methods could significantly reduce the time needed at this step. Second, to train a CycleGAN model, one would need biofilm images at different stages of the biofilm formation process, which can again be time-consuming. The collection of large datasets across multiple species could enable us to train a model that is general enough to eliminate the need for this step. Finally, this approach was validated on SEM data, and it is not clear how it would perform with other methods, such as confocal microscopy.
Methods
Biofilm data collection
Bacterial biofilms of Pseudomonas veronii DSM 11331T, Acinetobacter baumannii B-3190 and Arthrobacter halodurans NBRC 078085 were cultivated in LB medium within glass vials. Polypropylene samples, pre-sterilized in 95% ethanol and manufactured by fused filament fabrication (FFF), were used as a support. The plastic samples were immersed in vials containing medium inoculated with microorganisms and incubated at 28°C. The cultivation period ranged from two hours to seven days. The surface was then washed with water to remove any remaining culture medium and planktonic cells. The microorganisms were fixed onto the support surface using a 2.5% glutaric aldehyde solution at 4 °C for 4 hours, followed by a water wash.
Microscopy measurements
Prior to the measurements, the samples were fixed to an aluminum sample stub with double-sided carbon tape, and the interface between the sample and the sample stub surface was coated with carbon adhesive. A Cressingtor 208HR magnetron sputtering device was used to sputter 20 nm of Cr onto the surface of each sample. Measurements were made on a Hitachi SU8000 field emission scanning electron microscope with a secondary electron detector at an accelerating voltage of 5–10 kV at different magnifications.


Responses