Gut microbes modulate the effects of the flavonoid quercetin on atherosclerosis

Introduction
The digestive tract of mammals harbors microbial communities that fulfill important functions including the breakdown of non-digestible carbohydrates (e.g., dietary fiber), shaping of the immune system, and provision of colonization resistance against pathogens1. The gut microbiome has also been implicated in regulating host energy metabolism and the onset of various disorders such as inflammatory bowel disease2, cancer3, and neurological diseases4. Recent studies have highlighted the significant roles of the gut microbiome and chronic inflammation in the development of cardiovascular diseases (CVD) including atherosclerosis5,6,7,8. Atherosclerosis is a chronic inflammatory disorder characterized by the accumulation of fatty deposits in the artery, leading to life-threatening CVD such as myocardial infarction and stroke. A number of bacterial metabolites arising from specific dietary components, including trimethylamine, phenylacetylglutamine, and short-chain fatty acids (SCFAs), have gained recognition as important mediators of cardiovascular health9,10,11,12.
Epidemiologic studies have linked a high intake of flavonoids—polyphenolic compounds naturally occurring in fruits, vegetables, and cereals—with a lower risk of metabolic and CVD13,14. This association is supported by animal studies in which the administration of flavonoids as supplements reduces the progression of atherosclerosis15. Many flavonoids, including the commonly occurring flavonoid quercetin, have been shown to possess anti-oxidative and anti-inflammatory activity16. In general, dietary quercetin and other flavonoids are not efficiently absorbed in the proximal small intestine, with a significant fraction of these compounds reaching the distal small intestine and the colon, where they are metabolized by gut microbes17,18. Gut bacterial metabolism of quercetin and other flavonoids results in several phenolic acids that can exert beneficial effects on the host19. Consumption of quercetin is also known to impact gut microbiome composition20,21.
Despite the evidence suggesting that quercetin supplementation has protective effects on atherosclerosis and modifies gut microbiota composition22, it is still unknown whether the gut microbiota contributes to the beneficial effects of this flavonoid on vascular disease. In addition, the bioavailability of flavonoids varies depending on the food matrix23. Quercetin is lipophilic, and diets with high lipid content enhance its absorption24. However, it is not known whether other food components, such as plant polysaccharides, which largely co-occur with flavonoids and modulate the gut microbiome, affect the beneficial effects of this flavonoid on atherosclerosis. Interestingly, a meta-analysis of human trials showed considerable inter-individual variability of cardiometabolic biomarkers in response to flavonoid supplementation25, which may be associated with inter-individual differences in the gut microbiome and diet. In this study, we hypothesized that i) the gut microbiota contributes to the beneficial effects of quercetin on atherosclerosis and that ii) the effects are dependent on dietary plant polysaccharides. Our results suggest that bacterial metabolism and complex plant polysaccharides modulate the protective effect of quercetin on atherosclerosis.
Results
The beneficial effects of quercetin on atherosclerosis are microbiome dependent
We tested the effect of quercetin on atherosclerosis progression in ConvR and GF ApoE KO mice fed a low-fat high-microbiota-accesible carbohydrates (MAC) diet supplemented with 0.1% w/w quercetin (Supplementary Table 1) starting at 6-week old and maintained in the diet for 16 weeks (Fig. 1A). Atherosclerosis burden was analyzed in tissue collected from 22-week-old animals. Unexpectedly, quercetin did not affect plasma lipid profiles in these mice (Fig. 1B). However, we observed an interaction between quercetin supplementation and the presence of microbes that resulted in reduced atherosclerotic lesions and reduced accumulation of macrophages in ConvR animals but not in GF mice (Fig. 1C–E). There was also a strong trend in the levels of collagen that accumulated in ConvR in the presence of quercetin that was not detected in GF mice (Fig. 1F); however, this did not reach significance.

A Experimental design. B Plasma lipid profiles (n = 17 in the ConvR/high-MAC group, n = 12 in the ConvR/high-MAC + Q group, n = 11 in the GF/high-MAC group, and n = 8 in the GF/high-MAC + Q group). C–F Representative sections and quantitative analyses of Oil Red O staining (C, D; n = 17 in the ConvR/high-MAC group, n = 12 in the ConvR/high-MAC + Q group, n = 11 in the GF/high-MAC group, and n = 8 in the GF/high-MAC + Q group), MOMA-2 staining (C, E; n = 8 in the ConvR/high-MAC group, n = 12 in the ConvR/high-MAC + Q group, n = 11 in the GF/high-MAC group, and n = 8 in the GF/high-MAC + Q group), and Masson’s trichrome staining (C, F; n = 8 in the ConvR/high-MAC group, n = 12 in the ConvR/high-MAC + Q group, n = 11 in the GF/high-MAC group, and n = 8 in the GF/high-MAC + Q group) in the aortic sinus. The data were expressed as box-and-whisker plots, where the boxes indicate the median values and the interquartile ranges and the whiskers represent the minimum and maximum values. Significance was calculated by two-way ANOVA with Bonferroni post-tests as follows: *P value of <0.05; ***P value of <0.001. MAC microbiota-accessible carbohydrates, ApoE Apolipoprotein E, ConvR conventionally raised, GF germ-free, Q quercetin, MOMA monocytes and macrophages.
Quercetin consumption modulates gut microbiome composition in ConvR mice fed a high-MAC diet
To investigate whether the effect of quercetin on atherosclerosis is associated with changes in gut microbiota composition, we characterized the cecal microbiomes of the ConvR ApoE KO mice discussed above using 16S rRNA gene sequencing. We found that mice consuming the high-MAC diet supplemented with quercetin showed significantly increased richness of the gut microbiota as determined by the Chao1 index relative to control (high MAC, no quercetin) mice (Fig. 2A). Quercetin-fed animals also harbored more diverse microbiomes as determined by the Shannon index (Fig. 2A). Non-metric multidimensional scaling (NMDS) analysis of weighted UniFrac distances26 revealed a significant influence of quercetin (PERMANOVA; P = 0.017) on microbial community composition (Fig. 2B). Furthermore, linear discriminant analysis (LDA) effect size (LEfSe Galaxy Version 1.0)27 was performed to identify taxonomic differences in microbiota composition between the two groups of mice. Figure 2C illustrates the differential phylogenetic distributions of microbial communities in these two groups. Taxa belonging to the Eggerthellaceae, Ruminococcaceae, and Desulfovibrionaceae families and Parvibacter, Dorea, and Ruminiclostridium genera were increased in the quercetin-fed mice relative to control mice, whereas the members of the Lactobacillaceae family were detected at lower levels in the presence of the flavonoid (Fig. 2C–E, Supplementary Fig. 1A). Furthermore, atherosclerotic plaque areas were negatively associated with the Eggerthellaceae and Erysipelotrichaceae families and positively associated with the Lactobacillaceae family (Fig. 2F, Supplementary Fig. 1A). Collectively, these results suggest that dietary quercetin increased bacterial richness and modified the abundance of several microbial taxa associated with atherosclerosis.
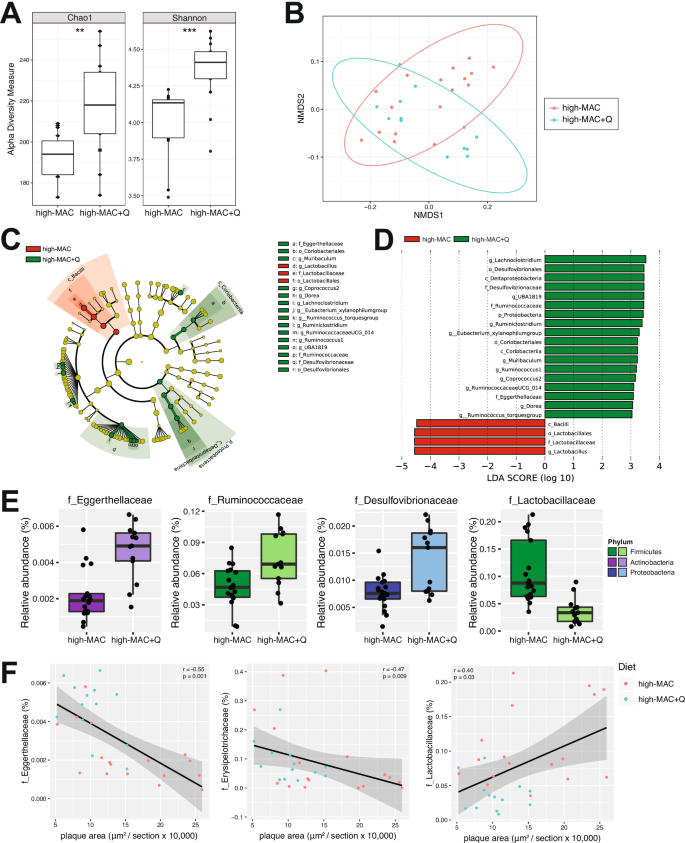
A Alpha diversity of gut microbial communities assessed by Chao1 and the Shannon index (t test; **P value of <0.01; ***P value of <0.001). B NMDS plot of weighted UniFrac analysis of relative sample ASV composition with the PERMANOVA test showing a significant influence of quercetin on microbial community composition. C Cladogram generated from LEfSe analysis showing the relationship between taxa (the levels represent, from the inner to outer rings, phylum, class, order, family, and genus). D LDA scores derived from LEfSe analysis, showing the biomarker taxa (LDA score [log 10] of >3 and a significance of P < 0.05 determined by the Wilcoxon signed-rank test). E Bacterial families differentially represented in cecal contents from the high-MAC + Q mice compared to the control group (P value of <0.05, FDR-corrected). F Correlation of bacterial families with atherosclerotic plaque area. Pearson’s rho and P values were calculated by Pearson correlation coefficient. n = 17 in the ConvR/high-MAC group and n = 12 in the ConvR/high-MAC + Q group. MAC microbiota-accessible carbohydrates, ConvR conventionally raised, Q quercetin, ASV amplicon sequence variant, NMDS non-metric multidimensional scaling, LDA linear discriminant analysis.
Microbial phenolic metabolites in blood are associated with atheroprotection
Bacterial fermentation of carbohydrates that reach the distal gut results in the production of SCFAs, including acetate, propionate, and butyrate, which have been previously associated with athero-protection9,12. Previous work suggests that flavonoids may influence the production of SCFAs28. To start exploring potential mechanisms by which quercetin inhibits the development of atherosclerosis, we measured levels of SCFAs in cecal contents. Quercetin did not change cecal levels of acetate, propionate, and butyrate in ConvR mice (Supplementary Fig. 2A).
We next analyzed phenolic metabolites in plasma samples using Ultra Performance Liquid Chromatography-Tandem Mass Spectrometer (UPLC-MS/MS). Sparse partial least squares discriminant analysis (sPLS-DA) plot showed significant separation between ConvR, and GF mice, with modest separation between control and quercetin-supplemented diets. Interestingly, there was no separation between GF controls and GF quercetin animals (Fig. 3A). We also determined levels of quercetin and its derivatives (quercetin 3-O-glucuronide, quercetin 3-O-sulfate, isorhamnetin glucuronide) in the circulation. Unexpectedly, there was little to no changes in those metabolites (Supplementary Fig. 3A), suggesting that quercetin was further metabolized by gut microbes. Comparison of phenolic metabolites in ConvR mice consuming control vs. high-quercetin-supplemented diet showed that several metabolites, such as benzoylglutamic acid, 3,4-DHBA and its sulfate-conjugated form, trans-4-hydroxy-3-methoxycinnamic acid (ferulic acid), and 3-methoxybenzoic acid methyl ester, were significantly increased by the quercetin supplementation (Fig. 3B, C). This was also confirmed by Variable Importance in Projection (VIP) scores (Supplementary Fig. 4A) and correlation coefficients (Supplementary Fig. 4B). Moreover, atherosclerotic plaque areas from the ConvR mice consuming high-MAC diets (plus/minus quercetin) were negatively associated with hydroxyhippuric acid, benzoylglutamic acid, and 3,4-DHBA sulfate (Fig. 3D). Plasma levels of these metabolites were also negatively associated with macrophage area but did not correlate with collagen area (data not shown). Collectively, these results suggested that dietary quercetin increased several plasma phenolic metabolites derived from bacterial metabolism including 3,4-DHBA, when provided in concert with dietary plant polysaccharides.
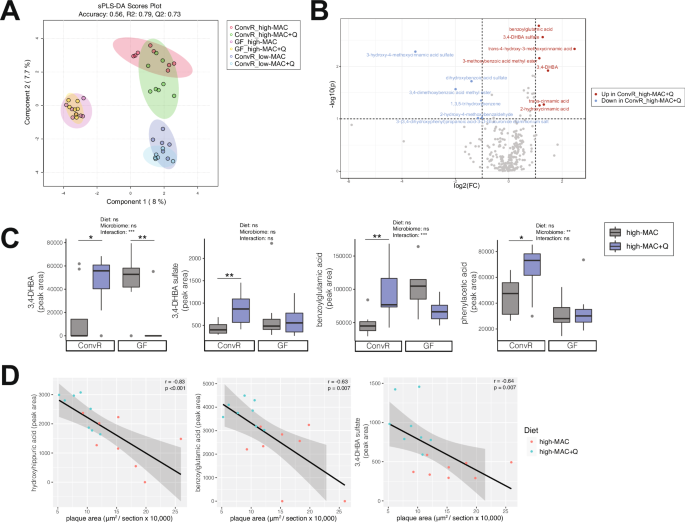
A Sparse partial least squares discriminant analysis (sPLS-DA) plot based on the data derived from the targeted metabolomics of plasma in the ConvR mice and the GF mice. (n = 8 in the ConvR/HPP high-MAC group, n = 8 in the ConvR/high-MAC + Q group, n = 7 in the GF/high-MAC group, n = 7 in the GF/high-MAC + Q group, n = 6 in the ConvR/low-MAC group, n = 6 in the ConvR/low-MAC + Q group). B Volcano plot of metabolites in the ConvR/high-MAC vs ConvR/high-MAC + Q group, with log-transformed adjusted P values and fold changes. Red circles; increased in the ConvR/high-MAC + Q group. Blue circles; increased in the ConvR/high-MAC group. C The values for 3,4-DHBA and its sulfate, benzoylglutamic acid, and phenylacetic acid were expressed as box-and-whisker plots. Significance was calculated by two-way ANOVA with the Benjamini–Hochberg correction as follows: *P value of <0.05; **P value of <0.01; ***P value of <0.001. D Correlation of phenols with atherosclerotic plaque area. Pearson’s rho and P values were calculated by Pearson correlation coefficient. MAC microbiota-accessible carbohydrates, ConvR conventionally raised, GF germ-free, Q quercetin, 3,4-DHBA 3,4-dihydroxybenzoic acid.
Quercetin does not impact atherosclerosis progression in mice consuming a low-MAC diet
We next tested the effect of quercetin on atherosclerosis progression in mice fed a low-MAC diet. ApoE KO mice were fed a low-MAC diet or a low-MAC diet supplemented with 0.1% w/w quercetin (Supplementary Table 2) starting at 6-week old and maintained in the diet for 16 weeks (Fig. 4A). It is important to note that this is a synthetic diet consisting of pure/semi-pure ingredients (e.g. casein) as opposed to the high-MAC diet which consists of whole ingredients (e.g., ground wheat, ground corn middlings, dehulled soybean meal etc.). Interestingly, quercetin did not affect plasma lipid profile, atherosclerosis lesion size, and macrophage or collagen levels in the aortic sinus from these mice (Fig. 4B-F). While quercetin supplementation resulted in microbiome changes in this diet (Supplementary Fig. 5), it did not impact plasma levels of phenylacetic acid, benzoylglutamic acid, 3,4-DHBA, and its sulfated form (Supplementary Fig. 3C). Altogether these results support the notion that MAC may support bacterial metabolism of quercetin and that bacterial metabolites derived from the flavonoid may contribute to the atheroprotective effects.
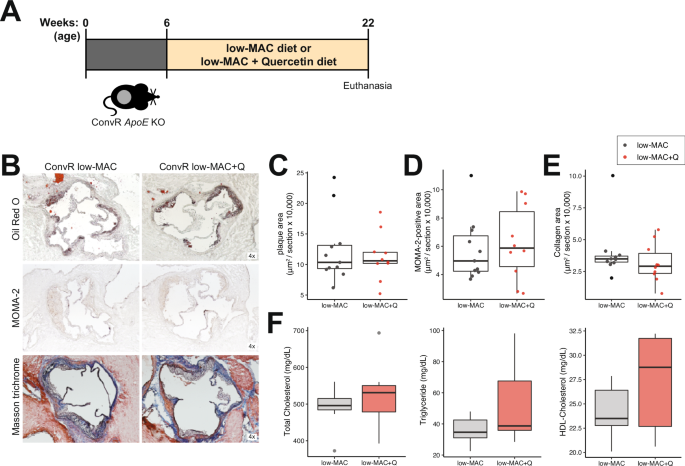
A Experimental design. B–E Representative sections and quantitative analyses of Oil Red O staining (B, C; n = 11 in the ConvR/low-MAC group and n = 10 in the ConvR/low-MAC + Q group), MOMA-2 staining (B, D; n = 11 in the ConvR/low-MAC group and n = 10 in the ConvR/low-MAC + Q group), and Masson’s trichrome staining (B, E; n = 11 in the ConvR/low-MAC group and n = 10 in the ConvR/low-MAC + Q group) in the aortic sinus. The data were expressed as box-and-whisker plots, where the boxes indicate the median values and the interquartile ranges, and the whiskers represent the minimum and maximum values. F Plasma lipid profiles (n = 7 in the ConvR/low-MAC group and n = 7 in the ConvR/low-MAC + Q group). Unpaired two-tailed Student’s t test were performed. MAC microbiota-accessible carbohydrates, ApoE Apolipoprotein E, ConvR conventionally raised, Q quercetin, MOMA monocytes and macrophages.
3,4-DHBA reduces the detrimental effect of LPS on human aortic endothelial cells (HAoEC) monolayer integrity
We examined whether 3,4-DHBA modulates inflammation by testing its effects on bone marrow-derived macrophages (BMDM). We focused on this metabolite because it is well-known bacterial metabolite of quercetin29 and because we see elevated in ConvR mice consuming quercetin, and its sulfated form negatively associated with disease (Fig. 3). The effects of 3,4-DHBA on inflammatory cytokine production were tested. BMDM were initially stimulated with LPS and subsequently treated with 3,4-DHBA followed by the addition of ATP. We found that 3,4 DHBA treatment did not impact levels of IL-1β or IL-6 levels secreted by BMDM (Fig. 5A).
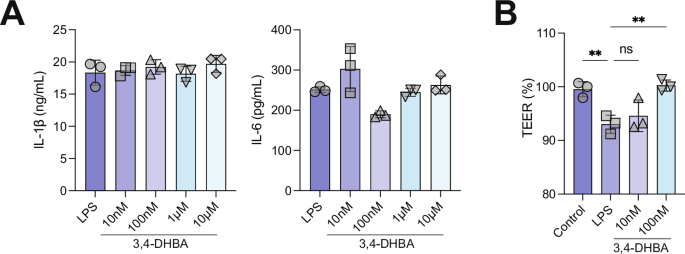
A 3,4-DHBA does not affect LPS-mediated activation of inflammation in macrophages. B The detrimental effect of LPS on endothelial cells monolayer integrity is ameliorated by 3,4-DHBA. Human aortic endothelial cells were grown to confluence on transwell inserts (12 well plates) and exposed to LPS (100 ng/ml) and LPS together with two different BA concentrations for 24 h. After that time, the endothelial monolayer integrity was evaluated using a voltohmmeter. Cells were equilibrated and transendothelial electrical resistance (TEER) was measured at room temperature. Data are presented as mean ± SEM (n = 3). LPS lipopolysaccharide, 3,4-DHBA 3,4-dihydroxybenzoic acid.
We also examined the effects of 3,4-DHBA on vascular permeability, as increased permeability facilitates the entry of lipoproteins, inflammatory cells, and other macromolecules into the arterial wall, initiating and propagating the atherosclerosis process30. Primary HAoEC were grown to confluence on transwell inserts and exposed to LPS with two different 3,4-DHBA concentrations for 24 h, and the endothelial monolayer integrity was evaluated using a voltohmmeter. We found that LPS significantly lowered TEER whereas 3,4-DHBA supplementation attenuated the effects of LPS (Fig. 5B). These results suggest that the microbial metabolite 3,4-DHBA may protect endothelial barrier integrity.
Discussion
A large body of literature supports the notion that consumption of flavonoids decreases the risk of CVD14. More recent studies have established that flavonoids impact the gut microbiome and have suggested that microbes impact their efficacy31. Our study provides causal evidence linking the effect of quercetin consumption, atherosclerosis and the gut microbiome.
Flavonoids are metabolized by phase I and phase II metabolism in the intestine and liver. In the colon, resident gut bacteria can convert unabsorbed flavonoids into small phenolic acids and aromatic metabolites32,33. The effects these metabolites have on the host are poorly described. Feeding studies with tracing of metabolic conversion suggest flavonoid catabolites are readily absorbed in the colon, often possess longer half-lives and reach substantially higher systemic concentrations than parent compounds34. These observations have increased the interest in microbiota-generated metabolites, which might mediate cardiometabolic effects of flavonoids. Degradation of quercetin by the gut microbiota involves C-ring fission, formation of 3-(4-hydroxyphenyl)propionic acid, and subsequent transformation to 3,4-dihydroxyphenylacetic acid35. Further modification leads to 3,4-DHBA and 4-hydroxybenzoic acid. 3,4-dihydroxyphenylacetic acid can also be dehydroxylated to 3-hydroxyphenylacetic acid or 4-hydroxyphenylacetic acid and phenylacetic acid, further degrading into various smaller products36. Our semi-quantitative targeted phenol metabolomic analysis identified several microbiota-generated metabolites from quercetin, such as 3,4-DHBA, its sulfated form 3,4-DHBA sulfate, and trans-4-hydroxy-3-methoxycinnamic acid (ferulic acid) that were elevated in plasma from conventional animals consuming diet supplemented with quercetin. These results are consistent with previous findings showing that 3,4-DHBA and ferulic acid are protective against atherosclerosis development in animal models37,38, whereas the effect of benzoylglutamic acid (also increased by quercetin in colonized mice fed high MAC diet) on atherogenesis has not been explored. Importantly, these metabolites were not increased by quercetin consumption in GF mice or mice consuming the low-MAC diet, emphasizing the role of the gut microbiota and MAC in the generation of these metabolites. Furthermore, dysfunction of the endothelial lining of lesion-prone areas of the vasculature contributes to atherosclerosis lesion initiation and progression39. We found that 3,4-DHBA lower the detrimental effects of LPS on HAoEC barrier integrity. Altogether, these results suggest that microbial products of quercetin may contribute to the beneficial effects of the flavonoid observed in ConvR mice.
Dietary quercetin may alter gut microbial composition in part by stimulating the growth of specific bacteria28. Similarly, our 16S rRNA sequencing data showed that quercetin increased microbiota richness and alpha diversity. Eggerthellaceae, Ruminococcaceae, and Desulfovibrionaceae families were highly enriched in the quercetin-fed mice. However, whether these taxa have the capacity to degrade quercetin is still unknown. Interestingly, Ellagibacter isourolithinifaciens belonging to the Eggerthellaceae family, a recently isolated bacterium from human feces, can metabolize ellagic acid into isourolithin A so that the taxa in the Eggerthellaceae family would potentially metabolize quercetin in the gut40. Future studies using gnotobiotic mice colonized with a defined consortium of microbes will help clarify the role of flavonoid-metabolizing bacteria on host physiology and disease.
Flavonoids are commonly mixed with different macromolecules including carbohydrates, lipids, and proteins that affect their bioaccessibility (i.e., amount of an ingested nutrient available for absorption in the gut after digestion) and bioavailability (i.e., proportion that is digested, absorbed, and used)23. While the protective effects of quercetin on atherosclerosis have been previously described in mice15,22,41,42, in most cases, western-type diets (i.e., high-fat, high-cholesterol diets) were used to exacerbate the disease. Quercetin is lipophilic, and the high lipid content in these diets enhances the efficiency of quercetin absorption24. This may explain why we did not observe a reduction in atherosclerosis in mice fed the low-fat, low-MAC diet. Furthermore, our results suggest that quercetin’s effect on atherosclerosis is influenced by dietary plant polysaccharides. Although we did not provide the mechanisms by which the dietary plant polysaccharides impact quercetin to exert its action, it has been shown that they prolong gastric emptying time and delay the absorption of flavonoids. In addition, dietary fiber may reduce rates of flavonoid absorption mainly by physically trapping the flavonoids within the fiber matrix in the chyme23.
The current study has some limitations that should be addressed. First, this study used only male mice, precluding us from testing the effect of sex. Additionally, the low-MAC and high-MAC diets used in this study differ dramatically between them beside their contents of plant polysaccharides making it impossible to conclude that the differences in the effects of quercetin are due to carbohydrate accessibility to gut microbes. Likewise, the baseline lesion size was slightly higher for mice consuming the high MAC diet, but the diets have too many differences and experiments using the two diets were done at different times, preventing us from being able to make direct comparisons. Furthermore, we tested the effect of one metabolite derived from quercetin (i.e., 3,4-DHBA) in vitro; it is not clear that this metabolite reaches plasma levels needed to elicit its effects in vivo or if other bacterial metabolites made from quercetin contribute to the flavonoid effects. Lastly, we observed that 3,4-DHBA (but not 3,4-DHBA sulfate or other microbial-derived metabolites) was increased in GF mice consuming the control diet. This was unexpected as this diet was not supplemented with quercetin. It is possible that the diet has small levels of this compound that are detected in some of the samples.
Despite these limitations, the work presented here shows that the protective effect of quercetin on atherosclerosis depends on the gut microbiota, and that atheroprotection by this flavonoid is associated with increased accumulation of phenolic acids in the blood. Further studies are warranted to clarify the metabolic processes underlying the generation of specific bioavailable, bioactive phenolic acid metabolites and to identify bacteria consortiums that optimize the generation of these phenolic acids. These studies will facilitate the development of symbiotic approaches for preventing CVD.
Methods
Gnotobiotic husbandry
All GF ApoE KO mice were maintained in a controlled environment in plastic flexible film gnotobiotic isolators under a strict 12 h light/dark cycle and received sterilized water and standard chow (LabDiet 5021; LabDiet, St Louis, MO) ad libitum until 6 weeks of age. Using traditional microbiology methods, the sterility of GF animals was assessed by incubating freshly collected fecal samples under aerobic and anaerobic conditions.
Animals and experimental design
Experiments: i) Six-week-old group-housed male ConvR or GF C57BL/6 ApoE KO mice were fed a standard grain-based chow diet composed of 18.6% (w/w) protein, 58.9% total carbohydrates including 14.7% neutral detergent fiber, and 6.2% fat (i.e., high-MAC diet, 3.1 kcal/g, TD.2018; Envigo, Supplementary Table 1) or the high-MAC diet supplemented with 0.1% (w/w) quercetin (TD.150883; Envigo, Supplementary Table 1) for 16 weeks. Dietary fiber in the high-MAC diet is derived from various plants, including ground wheat, ground corn, wheat middling, dehulled soybean meal, and corn gluten meal. The experimental diets were sterilized by irradiation. ii) Six-week-old group-housed male ConvR ApoE KO mice were fed a defined diet composed of 17.7% (w/w) protein, 60.1% carbohydrate, and 7.2% fat (i.e., low-MAC diet, 3.8 kcal/g, TD.97184; Envigo, Supplementary Table 2) or the low-MAC diet supplemented with 0.1% (w/w) quercetin (TD.150881; Envigo, Supplementary Table 2) for 16 weeks. Littermates from multiple mating pairs were used in this study, and they were randomly assigned to groups at weaning. Due to the different diets used in the experiment, blinding was not feasible for the duration of the study. Blinding was implemented for the measurement of atherosclerosis.
After 4 h fasting, mice were then euthanized at 22 weeks of age between Zeitgeber time 6-8. Mice were placed into a chamber filled with vapor of the anaesthetic isoflurane to induce unconsciousness, and blood samples were drawn by cardiac puncture, followed by cervical dislocation for euthanasia. All animals in the current study were handled and maintained in accordance with the University of Wisconsin–Madison, standards for animal welfare and all protocols were approved by the university’s Animal Care and Use Committee.
Atherosclerotic lesion assessments
Atherosclerotic lesions were assessed as previously described43. Briefly, mice were anesthetized, and the aorta was perfused with PBS. To determine the atherosclerotic lesion size at the aortic sinus, the samples were cut in the ascending aorta, and the proximal samples containing the aortic sinus were embedded in OCT compound (Tissue-Tek; Sakura Finetek, Tokyo, Japan). Five consecutive sections (10 μm thickness) taken at 100 μm intervals (i.e. 50, 150, 250, 350, and 450 μm from the bottom of the aortic sinus) were collected from each mouse and stained with Oil Red O. The atherosclerosis volume in the aortic sinus was expressed as the mean size of the 5 sections for each mouse. Immunohistochemistry was performed on formalin-fixed cryosections of mouse aortic roots using antibodies to identify macrophages (MOMA-2, 1:50; ab33451, Abcam, Cambridge, MA), followed by detection with biotinylated secondary antibodies (1:400; ab6733, Abcam) and streptavidin-horseradish peroxidase (1:500; P0397, Dako, Carpinteria, CA). Negative controls were prepared with substitution with an isotype control antibody. Staining with Masson’s trichrome was used to delineate the fibrous area according to the manufacturer’s instructions (ab150686, Abcam). Stained sections were digitally captured, and the stained area was calculated. Plaque area, Oil Red O-positive area, macrophage area, and fibrous area were measured using Image J software (National Institutes of Health, Bethesda, MD).
DNA extraction from cecal contents
DNA was isolated from cecal contents by extraction using a bead-beating protocol9. Mouse cecal samples were re-suspended in a solution containing 500 μl of extraction buffer [200 mM Tris (pH 8.0), 200 mM NaCl, 20 mM EDTA], 210 μl of 20% SDS, 500 μl phenol:chloroform:isoamyl alcohol (pH 7.9, 25:24:1) and 500 μl of 0.1-mm diameter zirconia/silica beads. Cells were mechanically disrupted using a bead beater (BioSpec Products, Barlesville, OK; maximum setting for 3 min at room temperature), centrifuged to separate phases, then the nucleic acids in the aqueous phase were precipitated by the addition of isopropanol. Following solubilization in 10 mM Tris/HCl (pH 8.0) + 1 mM EDTA, contaminants were removed using QIAquick 96-well PCR Purification Kit (Qiagen, Germantown, MD, USA). Isolated DNA was eluted in 5 mM Tris/HCL (pH 8.5) and was stored at −80 °C until further use.
16S rRNA gene sequencing
PCR was performed using universal primers flanking the variable 4 (V4) region of the bacterial 16S rRNA gene44. Genomic DNA samples were amplified in duplicate. Each reaction contained 25 ng genomic DNA, 10 μM of each uniquely barcoded primer, 12.5 μl 2x HiFi HotStart ReadyMix (KAPA Biosystems, Wilmington, MA, USA), and water to a final reaction volume of 25 μl. PCR was carried out under the following conditions: initial denaturation for 3 min at 95 °C, followed by 20 cycles of denaturation for 30 s at 95 °C, annealing for 30 s at 55 °C and elongation for 30 s at 72 °C, and a final elongation step for 5 min at 72 °C. PCR products were purified with the QIAquick 96-well PCR Purification Kit and quantified using the Qubit dsDNA HS Assay kit (Invitrogen, Oregon, USA). Samples were equimolar pooled and sequenced by the University of Wisconsin–Madison Biotechnology Center with the MiSeq 2×250 v2 kit (Illumina, San Diego, CA, USA) using custom sequencing primers.
Microbiota analysis in QIIME2
Demultiplexed paired-end fastq files were generated by CASAVA (Illumina), and a sample mapping file were used as input files. Sequences were processed, quality filtered and analyzed with QIIME2 (version 2019.10) (https://qiime2.org), a plugin-based microbiome analysis platform45. DADA246 was used to denoise sequencing reads with the q2-dada2 plugin for quality filtering and identification of ASV (i.e. 100% exact sequence match). This resulted in 3,580,038 total sequences, with an average of 81,364 sequences per sample. Sequence variants were aligned with mafft47 with the q2-alignment plugin. The q2-phylogeny plugin was used for phylogenetic reconstruction via FastTree48. Taxonomic classification was assigned using classify-sklearn49 against the SILVA 132 reference sequences50. Alpha- and beta-diversity (weighted and unweighted UniFrac26) analyses were performed using the q2-diversity plugin at a rarefaction depth of 30000 sequences per sample. Subsequent processing and analysis were performed in R (v.3.6.2), and data generated in QIIME2 was imported into R using Phyloseq51. LefSe analysis was performed using parameters as follows (p < 0.05 and LDA score 3.027;).
Plasma biochemical analysis
Plasma was acquired by centrifugation and stored at −80 °C until measurement. The triglycerides, total cholesterol, and high-density lipoprotein cholesterol levels were measured with commercially available kits from Wako Chemicals (Richmond, VA).
Gas chromatography-mass spectrometry (GC-MS) of SCFA measurement
Sample preparation was based on a previously described procedure52, with some modifications. Cecal contents were weighed in 4 mL vials, then 10 μL of a mixture of internal standards (20 mM each; acetic acid-D4, Sigma-Aldrich #233315; propionic acid-D6, Sigma-Aldrich #490644; and butyric acid-D7, CDN isotopes #D-171) was subsequently added, followed by 20 μL of 33% HCl and 1 mL diethyl ether and the vials were sealed with polytetrafluoroethylene-lined screw caps. For plasma samples, 50 μL of each sample, 1.25 μL of the internal standard mix, 5 μL of 33% HCl, and 0.75 mL of diethyl ether were mixed. The mixture was vortexed vigorously for 3 min and then centrifuged (4000g, 10 min). The upper organic layer was transferred to another vial, and a second diethyl ether extraction was performed. After combining the two ether extracts, a 60 μL aliquot was removed, combined with 2 μL N-tert-butyldimethylsilyl-N-methyltrifluoroacetamide (MTBSTFA, Sigma-Aldrich #394882) in a GC auto-sampler vial with a 200 μL glass insert, and incubated for 2 h at room temperature. Derivatized samples (1 μL) were injected onto an Agilent 7890B/5977 A GC/MSD instrument with Agilent DB1-ms 0.25 mm×60 m column with a 0.25 μm bonded phase. A discontinuous oven program was used, starting at 40 °C for 2.25 min, then ramping at 20 °C/min to 200 °C, then ramping at 100 °C/min to 300 °C and holding for 7 min. The total run time was 18.25 min. Linear column flow was maintained at 1.26 mL/min. The inlet temperature was set to 250 °C with an injection split ratio of 15:1. Quantitation was performed using selected ion monitoring (SIM) acquisition mode, and metabolites were compared to relevant labeled internal standards using Agilent Mass Hunter v. Acquisition B.07.02.1938. The m/z of monitored ions are as follows: 117 (acetic acid), 120 (acetic acid-D4), 131 (propionic acid), 136 (propionic acid-D6), 145 (butyric acid), and 151 (butyric acid-D7). Concentrations were normalized to mg of cecal contents.
Targeted phenol metabolome for plasma samples
The UPLC-MS/MS advanced scheduled multiple-reaction monitoring (ADsMRM) scanning methodological workflow was utilized to identify metabolites of quercetin, along with other phytochemical and host metabolites which may be impacted by treatment with quercetin. The metabolites were purified from 100 μl plasma by 96-well plate solid phase extraction (SPE; StrataTM-X Polymeric Reversed Phase, microelution 2 mg/well). The solid phase extraction treated samples were chromatographically separated and quantified using Exion high-performance liquid chromatography-tandem hybrid triple quadrupole-linear ion trap mass spectrometer (SCIEX QTRAP 6500+; UHPLC-ESI-MS/MS) with electrospray IonDrive Turbo-V Source. The samples were injected into a Kinetex PFP UPLC column (1.7 μm particle size, 100 Å pore size, 100 mm length, 2.1 mm internal diameter; Phenomenex) with oven temperature maintained at 37 °C. Mobile phase A and mobile phase B consisted of 0.1% v.v. formic acid in water and 0.1% v.v. formic acid in LC-MS grade acetonitrile, with a binary gradient ranging from 2% B to 90% B over 30 min and a flow rate gradient from 0.55 mL/min to 0.75 mL/min. MS/MS scanning was accomplished by ADsMRM using polarity switching between positive and negative ionization mode in Analyst (v.1.6.3, SCIEX) and with peak area and intensity recorded using SCIEX OS (v.2.0.0.45330, SCIEX). Internal standards included l-tyrosine-13C9,15N, resveratrol-13C6, hippuric acid 13C, 13C6 4-hydroxybenzoic acid propyl ester, and phlorizin dehydrate (Sigma). Peaks matching retention time, fragmentation patterns, and having intensity greater than 1e4, area greater than 2e4, and number of data points across baseline greater than 5 were annotated, and peak area, height, and area:height ratio were returned for statistical analysis.
Metabolome analysis
Metabolites and their respective normalized peak areas were analyzed by the MetaboAnalystR package53. sPLS-DA was used to determine the separation between groups of the metabolite variables through rotation of the principal components obtained by PCA. Volcano plots were used to compare the size of the fold change to statistical significance. Volcano plots of significantly changing metabolites were determined using a two-sample Student’s t-test with a probability threshold of P < 0.05 corrected for multiple comparisons using the false discovery rate for type-1 error control.
TEER measurements
HAoEC (passages 4–6) were grown in 25 cm2 flasks until confluency (80–90%). Using trypsin, cells were released, collected, and centrifuged. The supernatant was removed, and the pellet was resuspended in 7 ml of V2 medium. Initially, 1.5 ml of media alone were added to the outer transwell system, and then, 0.5 ml of the cell suspension was added to the inner compartment. Cells were maintained at 37 °C and 5% CO2. In a separate 12-well plate (no inserts), the remaining 1 ml medium volume was put in a well. This cell monolayer in the plastic surface served as a control to visualize the confluency of cells since this cannot be established in the transwell. When the cells were confluent, they were left 5–7 additional days to obtain a homogeneous monolayer (which can be verified in the control well-plate). At this point, cells were treated as follows: 1. Control cells (no treatment); 2. LPS 100 ng/ml; 3. LPS + 10 nM 3,4-DHBA; 4. LPS + 100 nM 3,4-DHBA. TEER was measured after 5 and 10 min.
Bone marrow-derived macrophages (BMDM)
To prepare murine BMDM, tibias and femurs from C57BL/6 mice were collected and flushed with RPMI 1640 media supplemented with 10% FBS, non-essential amino acids, sodium pyruvate, penicillin/streptomycin, and Glutamax before plating with 20% L-cell conditioned media. Cells were cultured in petri plates for six days at 37 °C and 5% CO2 before use. For IL-1β detection, BMDM were plated at 4 × 10⁵ in a 24-well plate and stimulated with 50 ng/mL LPS for 4 h before treatment with 3,4-DHBA at either 10 nM, 100 nM, 1 µM or 10 µM for 3 h then 5 mM ATP for 1 h. For IL-6 detection, BMDMs were plated at the same density but first treated with either 10 nM, 100 nM, 1 µM or 10 µM for 1 h, then stimulated with 50 ng/mL LPS for 4 h. Cell supernatants were collected and stored at −80 °C until ELISA analysis. IL-1β and IL-6 were detected in cell supernatants by ELISA. Antibodies for IL-1β ELISA (MAB401 and BAF401) were obtained from R&D Systems and used according to the manufacturer’s instructions. The IL-6 ELISA was done using the Mouse IL-6 DuoSet ELISA kit (R&D Systems, Cat. No. DY406) according to the manufacturer’s instructions.
Statistical analysis
The data were expressed as individual dots with mean ± SEM or box-and-whisker plots where the center line was the median, boxes extended to 25th and 75th percentiles, and whiskers extended to min and max values, and analyzed using R (3.6.2). For the high-MAC diet, significance was calculated by two-way ANOVA with Bonferroni post-tests. The correlation between the two variables was calculated by the Pearson correlation coefficient. For the low-MAC diet, significant differences between two two groups were evaluated by two-tailed unpaired Student’s t tests. LDA effect size (LefSe) used a nonparametric Wilcoxon sum-rank test followed by LDA analysis to measure the effect size of each abundant taxon, and two filters (P < 0.05 and LDA score of >3) were applied to the present features.
Responses