Introduction of novel objects to the home cage of mice repeatedly disturbs sleep for seven days with minimal stress induction

Introduction
Sleep research is a growing field, and sleep deprivation or disturbance is an often-used method to study the biological consequences of poor sleep. Rodent models are commonly used to investigate the molecular and cellular changes induced by lack of sleep1,2,3,4. Such studies use a wide range of protocols to disturb sleep. Some are more stressful than others5, and variations in confounding factors such as stress must therefore be considered when designing experiments and interpreting results.
While understanding the acute effects of total sleep loss is important, a more translationally relevant question is whether long-term sleep disruption has detrimental effects. Specially during adolescence, when the brain is still maturing, chronic lack of sleep could be particularly disruptive6,7. In modern society, sleep loss is often induced by voluntary wakefulness, such as with the use of mobile phones, particularly prevalent among the adolescent population8. Studying voluntary wakefulness in experimental rodents, such as with introduction of novel objects, rather than forced wakefulness, such as with gentle handling, platforms over water, and automated setups, is therefore critical to better understand long-term adolescent sleep loss.
When investigating long-term sleep deprivation (SD) in adolescent rodents, the level of stress induced by the procedure is important to consider. Numerous studies have reported major consequences of longer-term (four days or more) stress exposure during adolescence, including chronic effects on emotional behaviors, social behaviors, and alterations in the hypothalamic-pituitary-adrenal axis9,10,11,12. Cotella et al. demonstrated that long-term variable stress during adolescence has lasting effects in rats, increasing anxiety-like and despair-like behaviors, whereas similar stress exposure in adulthood did not result in long-lasting effects10. Consequently, when interpreting results of SD in adolescence stress factors need to be taken into account.
It is likely that stress related to disturbed sleep is an integral part of the deleterious effects of sleep loss, but which of the two contributes more is hard to determine based on current knowledge. Ideally, a completely stress-free SD protocol would isolate the lack of sleep effect from a stress effect. However, as sleep loss and stress are likely intrinsically coupled separating the two experimentally is unlikely to be practically possible. Instead, having a set of methods available that induces SD at varying levels of stress would be valuable. A similar theoretical framework has been proposed for separating the confounding effect of sensory stimuli in a SD protocol from the sleep deprivation itself13.
The gentle handling protocol, where mice are kept awake by gently touching or stroking them or by shaking or tapping the cage, is commonly used for induction of acute SD1,14,15,16. This method is easy to implement at a low cost, but it is highly dependent on the experimenter, increasing the risk of variability and decreasing reproducibility. Implementing gentle handling for long-term SD is very demanding, but has also been done1,17. In Murack et al. eight consecutive days of SD by four-hour daily gentle handling, resulted in elevated blood corticosterone concentrations in adult and adolescent female mice but not male mice1. Indicating that long-term SD of adolescent rodents by gentle handling may induce stress in parallel with sleep loss.
A second method of SD involves placing mice on small platforms over water. This method, called the flower pot method, is primarily used for REM SD, as muscle atonia during REM sleep causes the mice to risk falling into the water so instead they wake up just as they enter REM sleep18,19. If using sufficiently small platforms, the method can also be used for total SD4. The platform-over-water methods utilize that rodents do not sleep in water. A recent paper showed that having mice constantly housed in shallow water will also prevent them from sleeping for several days20. This method is associated with a large increase in blood corticosterone levels both acutely21 and chronically22.
Another often-used approach is an automated setup (e.g., a moving beam or a jumping cage bottom), which is practical for long-term SD23,24,25 as such systems mechanically force the animals to move to keep them awake. This can be set up in a closed loop with an EEG setup to track when sleep is initiated, which will then elicit the mechanical wake stimuli26. It has been argued that this approach induces more movement than in the control mice, but that depends on the specific setup23. Using automated systems for long-term SD have shown to elevate blood corticosterone in some studies27 but not in other studies2,23.
Introducing novel objects into the home cage has been widely explored as an effective method for SD, as it promotes voluntary wakefulness and minimizes the stress associated with forced wakefulness28. Indeed mice prefer novel objects over an empty space or a complex but stable environment29. Studies describing the introduction, timing, and type of objects are sparse, calling for a protocol describing that. Adolescent rodents, in particular, exhibit increased interest in novel objects and environments, making this method particularly useful for this age group30. Further, adolescent mice are more likely to spend time in the open arm of a plus-maze, suggesting increased exploratory behavior in this age group31. Many laboratories are already using novel objects to induce acute SD32,33, but a longer sub-chronical SD protocol with novel objects has not been fully validated.
In conclusion, different SD methods particularly for long-term use have various issues, such as stress, forced immobility/mobility, or lack of standardization. An advanced setup using a closed-loop approach with EEG/EMG can circumvent some of these issues. However, the flexibility of a sleep deprivation experiment could be reduced if it is reliant on EEG/EMG equipment. Additionally, many research groups lack the capacity to implement such advanced setups, highlighting the need for a simple and easy sleep deprivation method. Furthermore, the diverse approaches to sleep deprivation make it challenging to compare results across experiments, emphasizing the need for standardized protocols.
Here, we aim to create a standardized method introducing novel objects over several days to study the effects of long-term SD. Our first objective was to identify objects that effectively promote wakefulness. Next, we developed and validated a standardized protocol for seven days of four-hour SD using novel objects.
Materials and methods
Animals
C57bl/6J female mice (purchased from Janvier to test objects and Taconic to get age specific mice for EEG setup) were used for these experiments with access to ad libitum food and water. The lighting conditions were 12:12 h light: dark cycle and temperature and humidity were kept constant. During the habituation to the EEG cages and video/EEG/EMG recordings, the mice were single-housed, but we chose females to allow for group housing (2-5 mice per cage) between the recordings, minimizing social isolation during the experimental setup. All mice were housed with enrichment such as nesting material, wooden blocks, a hemp robe hanging from the lid, a plastic tube, and a plastic hide. In the recording setup, all the enrichment tools were the same except the plastic tube and hide, which were excluded due to complications with the cord from the head mount. The objects are visible to the experimenter hence blinding is not possible for this setup. The protocol was approved by the Danish Animal Experimental Inspectorate (license number: 2022-15-0201-01194). Per the EU Directive 2010/63/EU on the protection of animals used for scientific purposes, mice were monitored for signs of compromised health or the loss of more than 20% of their body weight.
Selection of objects
To select objects and determine the timing and setup of object exposure for SD, eight female mice were single-housed in EEG cages (9000-K20, Pinnacle Technology Inc.) equipped with infra-red video cameras (9000-K10, Pinnacle Technology Inc.) and habituated for three days before testing.
21 objects were tested by exposing mice to one single object for 30 min at a time and manually scoring for how long each mouse interacted with the object and if the mice were resting in the nest (Supplementary Fig. 1A, C). The objects were selected to be easily accessible by being available in a pet shop or from regular lab equipment. Objects with a total interaction time of less than five minutes were discarded to select the most effective wake-promoting objects. Of the remaining objects, only objects with at least one interaction bout longer than 30 s were selected for the final study (Supplementary Fig. 1B). Sleep/wake behavior was based on observation during the object exposure, here sleep was defined as the mouse being immobile and resting in the nest.

Mice (n = 8) had EEG/EMG/video recording on the baseline, first day of SD, and seventh day of SD to validate the SD by novel objects. Housing conditions switched between single- and double-housing to diminish possible effects of single-housing. The days from which the fecal samples arise are indicated in the figure.
Protocol design
For the final protocol of SD by novel object exposure, the 13 objects (Supplementary Fig. 1A, B, Supplementary Table 1) that passed the aforementioned interaction time and bout number criteria were systematically alternated between cages. To maintain novelty, no object (except for the running disc) was introduced two days in a row during SD. The investigated objects were categorized into high (running disc), medium (e.g., tulle), and low (e.g., flower) effects, and an exposure scheme was made to ensure that two low-effect objects did not occur subsequently. Running discs were selected instead of running wheels to enable simultaneous EEG/EMG recording. The administration of the objects was done with minimum disruption of the cage. They were placed in the cage without touching the mouse, and if the object became integrated into the nest, it was gently removed without ruining the nest. Most objects were not cleaned between introductions to different cages during the protocol for practical reasons although the paper towels were discarded after use due to deterioration. After the four-hour use, the objects of plastic were cleaned with ethanol, and textured objects were cleaned by picking out the wood chips and fecal boli. If the objects were too damaged, they were discarded. To standardize the odor of the objects, new objects were therefore put in a non-experimental cage with mice of the same sex prior to exposure to ensure murine odor on all objects.
An example of a day of SD is attached in the supplements along with a list of objects (Supplementary Tables 1, 2). Since the running disc had the longest interaction time (Supplementary Fig. 1A) it was introduced in the SD protocol twice every day.
Validation of SD by EEG/EMG/video recordings
To validate the wake promotion of the objects, eight female adolescent mice (SD start at postnatal day (p)36-p42) were used for EEG/EMG recording and sampling of fecal boils for corticosterone measurements (Fig. 1). EEG/EMG surgery was performed eight days prior to the SD start at p28.
EEG/EMG surgery
All mice were anesthetized with isoflurane (induction 4%; 4 L/min O2, maintenance 1.5–2.5; 2 L/min O2) to start the surgery. After induction, the mice received analgesia (buprenorphine, 0.05 mg/kg, Bupaq Multidose, Nomeco, Denmark) and antibiotic drugs (Baytril, 5 mg/kg, Nomeco, Denmark), subcutaneously. The core temperature of the mice was monitored by a rectal probe and stabilized by a heating pad. Before attaching the mouse head to the stereotactic frame, the head and neck were shaved. When attached to the frame ophthalmic ointment was applied and the head and neck were cleaned with water and povidone-iodine. Local analgesia (lidocaine, Lidor Vet; Nomeco, Denmark) was injected subcutaneously at the site of the incision and subsequently, the incision (~1 cm) was made from the crown of the head to the neck. The skull was cleaned and dried with ethanol to prepare the attachment of the electrode. The frontoparietal bipolar three-channel EEG/EMG head mount (#8201; Pinnacle Tech. Inc., KS, USA) was placed into a clamp on a standard probe holder to the stereotaxic frame to place and glued three mm anterior of bregma. Two craniotomies were drilled above the frontal lobe and two above the parietal lobe. Subsequently, two 0.10 mm screws were secured in the frontal holes and two 0.12 were secured in the parietal holes fitting in the prefabricated head mount. Screws were secured without penetrating the dura. Epoxy was carefully placed around the screws (#8226, Pinnacle Tech. Inc. KS, USA). EMG wires were placed intramuscularly bilaterally in the nuchal muscles. Dental cement was applied on the head mount to secure it, and sutures were applied in the neck if there was excess wound. To finish the surgery, a long-lasting analgesic (Mexilocam, 5 mg/kg, Metacam, Nomeco Denmark) was injected subcutaneously and the mouse was placed in a cage with a heating lamp for recovery. Post-surgical care was performed three days after the surgery, which included weighing, administration of long-lasting analgesics, and a behavioral assessment.
EEG/EMG recording and scoring
Habituation started three days before the baseline recording by housing the mice individually in a 10” circular transparent recording cage (#9000-K20; Pinnacle Tech. Inc., KS, USA). All experiments were performed in EEG chambers with similar lighting levels. The mice were exposed to novel cages for the first 24 h of habitation and subsequently attached to the cable connecting the EEG head mount to the EEG equipment. Three 24 h recordings were performed – baseline, first day of SD, and seventh day of SD. Mice returned to home cages in between recordings on the first and seventh day of SD and re-habituated to EEG cages and cables one day prior to the seventh day of SD (Fig. 1). One mouse had an unsuccessful EEG/EMG surgery resulting in poor signal (n = 7, for baseline and first day of SD) but were included in the measurements of corticosterone. One mouse was euthanized between the first day and the seventh of SD due to a loose head mount reading to an n of six for the last recording.
To acquire the EEG/EMG and video recording, the Sirenia Acquisition software 2.2.12 (Pinnacle Tech. Inc. KS, USA) was used. The data was digitized at 400 Hz and processed through a preamplifier to filter out noise (×100 gain, high pass filtered at 0.5 Hz EEG and 10 Hz EMG). When scoring the data, it was further amplified (x50) and filtered (0.5 Hz EEG, 10 Hz EMG). The EEG/EMG signals were divided into four-sec epochs, and wake, NREM, and REM were determined manually using standard criteria34. Wakefulness was scored by mixed frequency EEG activity and an active EMG. NREM sleep was defined as high EEG power in the delta range (0.5–4 Hz) and low EMG signal. REM sleep was scored when theta activity was high (6–10 Hz, especially a peak activity at 7 Hz) and EMG signal was low. REM sleep bouts were only registered if they were longer than 16 s (four epochs). The bout count was determined by counting the number of occurrences of a specific vigilance state within a given time period. The average bout duration for that time period was calculated by taking the mean of the durations of all bouts. Blinding was not possible during scoring as the objects were visible on the camera. Instead, the EEG analysis was performed by a person blinded to the hypothesis.
EEG power analysis and EMG root mean square analysis
The raw EEG traces were bandpass filtered using a Butterworth filter (between 0.5 and 100). From each four second epoch the multi-taper spectrum estimates (discrete prolate spheroidal sequences (dpss) for tapers) were computed to determine absolute EEG power in 0.25 Hz bins. The EEG power in each frequency bin was normalized to each mouses average EEG power within the range of 0.5–4 Hz for each artifact free NREM and 0.5–30 Hz for REM epoch. To display state-specific power spectra across the 24 h recordings per treatment day, the power spectrum per zeitgeber time (ZT) hour interval was averaged and shown as the mean ± the SEM.
To investigate the EMG signal, raw EMG traces were filtered using a band-pass filter (0.5 to 130 Hz) and a notch filter at 50 Hz to remove noise. The root mean square (RMS) was calculated for each epoch (4 s). The RMS of the EMG signal was averaged per successive ZT hour across an 24 h signal and the data is displayed as mean across the animals ±SEM.
One mouse was excluded on the seventh day of SD because the EMG signal showed artifacts, possibly caused by a loose EMG wire from grooming.
Fecal corticosterone measurements
During the experimental paradigm, fecal boli were sampled from EEG or home cages bedding material at three-time points – before SD, early SD, and late SD—to measure corticosterone (as immunoreactive fecal corticosterone metabolites (FCM)) in a non-invasive manner (Fig. 1). Before SD, fecal boli were sampled from EEG cages just before novel object exposure on the first day. Early SD fecal boli were sampled from home cages when returning mice into EEG cages for the last recording. Late SD fecal boli were sampled from EEG cages after the last recording. The early SD timepoint only has only four samples due to double housing. All samples were collected at ZT2.
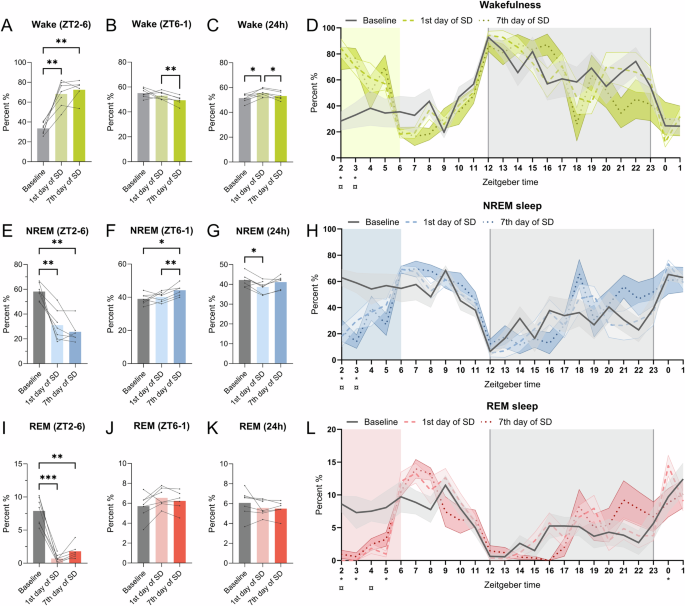
Mice (n = 6–7) had EEG/EMG/video recording on the baseline, first day of SD, and seventh day of SD to validate the SD by novel objects. Duration of wakefulness on all days at A ZT2-6 (SD) B ZT6-2 (20-hour recovery sleep) and C Total 24 h. D Duration of wakefulness per hour. Duration of NREM sleep on all days at E ZT2-6 (SD) F ZT6-2 (20-h recovery sleep) and G Total 24 h. H Duration of NREM sleep per hour. Duration of REM sleep on all days at I ZT2-6 (SD) J ZT6-2 (20-h recovery sleep) and K Total 24 h. L Duration of REM sleep per hour. For the bar plots (A–C, E–G, I–K), data from the same mouse is connected by a line on bar graphs. Repeated measures and paired mixed-effect analysis with the Geisser-Greenhouse correction and Tukey’s multiple comparisons tests, was used to analyze the data illustrated in the bar plots, *p < 0.05, **p < 0.01, ***p < 0.001. For figures (D, H, L), the value plotted at ZT2 is the sum of [2,3[and so on. The shaded gray indicates the dark phase (ZT12-0) and the colored shading indicates the timing of SD (ZT2-6). The line-types indicate the mean across animals and the colored shading around the line indicates SEM. *p < 0.5 indicates significance for baseline vs 1st day of SD and ¤p < 0.05 indicates significance for baseline vs 7th day of SD.
FCM was extracted from the fecal boli and quantified by ELISA, as previously described35,36,37,38. In brief, each fecal sample was weighed and submerged in 96% ethanol (3 ml/g feces), followed by incubation on a shaking table overnight for 12 h. The homogenate was centrifuged for 20 min at 3000 × g (Scanspeed 1236 R, Labogen, Lynge, Denmark), whereafter the supernatant was decanted, and the pellet discarded. One ml of the supernatant was centrifuged for 15 min at 10,000 × g in a tabletop centrifuge (model 5415D, Eppendorf, Hamburg, Germany). A 300-μL aliquot of the supernatant was recovered by using a pipette and evaporated to dryness using an evaporator (model EZ2, Genevac, Ipswich, United Kingdom). The evaporate was then resuspended in 300 μL assay buffer and analyzed by using a competitive corticosterone ELISA (EIA-4164, DRG Diagnostics, Marburg, Germany) according to the manufacturer’s instructions. Cross-reactivities for the assay were reported as follows: Progesterone, 7.4%; deoxycorticosterone, 3.4%; 11-dehydrocorticosterone, 1.6%; cortisol, 0.3%; pregnenolone, 0.3%; and other steroids, <0.1%.
Statistics
To perform statistical analysis and plotting data, GraphPad Prism v10.2.3 (San Diego, CA, USA) was used. A repeated measures and paired mixed-effect analysis, with the Geisser-Greenhouse correction and Tukey’s multiple comparisons, was used for analyzing the dataset. The mixed-effect analysis was used instead of the one-way or two-way ANOVA needs an even number of observations in all groups. A two-way ANOVA with main effects only and a Tukey’s multiple comparison test, with a single pooled variance was used to analyze the distribution count of the bout lengths (timepoint x count of bout length). Significance are reported with p-values and specific p-values and degrees of freedom are reported in the result section. p < 0.05 were considered statistically significant and noted as *p < 0.05, **p < 0.01, ***p < 0.001 on the figures. P values between 0.1 and 0.05 are noted with the specific p value in the figures.
Results
Selection of objects for SD
Testing 21 different novel objects for wake-promoting effects resulted in 13 useful objects. The running disc was the most effective (Supplementary Fig. 1A, B). Already, two hours into SD, the objects were not able to effectively keep the mice awake (Supplementary Fig. 1C). These results show that not all objects are useful for SD, especially as sleep pressure increases during the procedure. It is, therefore, important to always validate objects before using them for SD.
Validation of SD by EEG/EMG and examination of changes in the sleep architecture
Next, we investigated how the SD by novel objects affected sleep using EEG/EMG. Wakefulness, NREM, and REM sleep duration at the first and seventh day of SD showed a pattern different from baseline during the 24 h recording (Fig. 2D, H, L). The duration of wakefulness increased at ZT2 (Fig. 2D, p < 0.001, baseline vs 1st day of SD q(6) = 7.332, p < 0.01, baseline vs 7th day of SD, q(5) = 7.364) and ZT3 (Fig. 2D, baseline vs 1st day of SD q(6) = 3.324, p < 0.01, baseline vs 7th day of SD, q(5) = 3.088) for both the first and seventh day of SD. Correspondently, the NREM sleep duration decreased on the same days (Fig. 2H, ZT2, p < 0.01, baseline vs 1st day of SD q(6) = 5.267, p < 0.01, baseline vs 7th day of SD, q(5) = 6.071, ZT3, p < 0.05, baseline vs 1st day of SD q(6) = 3.059, p < 0.05, baseline vs 7th day of SD, q(5) = 3.244). For REM sleep, there was a decrease at ZT2 (Fig. 2L, p < 0.001, q(6) = 7.098), ZT3 (Fig. 2L, p < 0.05, q(6) = 2.983) and ZT5 (Fig. 2L, p < 0.05, q(6) = 2.916) on the first day of SD and an increase at ZT0 ((Fig. 2L, p < 0.05, q(6) = 3.065) comparing to baseline. On the seventh day of SD, the REM sleep duration was only decreased at ZT2 (Fig. 2L, p < 0.01, q(5) = 7.660) and ZT4 (Fig. 2L, p < 0.05, q(5) = 3.198). To assess the dynamics of the vigilance states, the data was pooled into the SD interval (ZT = [2,6[), rebound (ZT = [6,2[), and total 24 h recording time.
In the interval ZT2-6, when the mice received the novel objects, the wake duration was increased on the first and seventh day of SD compared to baseline (Fig. 2A, p < 0.01, baseline vs 1st day of SD – q (6) = 9.499, p < 0.01, baseline vs 7th day of SD – q (5) = 11.64). NREM and REM sleep duration decreased during SD compared to baseline (Fig. 2E, p < 0.01, baseline vs 1st day of SD – q (6) = 7.683, p < 0.01, baseline vs 7th day of SD – q (5) = 11.44, and Fig. 2I, p < 0.001, baseline vs 1st day of SD – q (6) = 13.42, p < 0.01, baseline vs 7th day of SD – q (5) = 7.079). During the remaining 20 h (ZT6-2) on the seventh day of SD, wake duration decreased compared to the first day of SD (Fig. 2B, p < 0.01, q (5) = 7.506), and NREM sleep increased both compared to baseline and the first day of SD (Fig. 2F, p < 0.05, baseline vs 1st day of SD – q (6) = 4.749, p < 0.01, 1st day of SD vs 7th day of SD – q (5) = 7.165). For the total 24 h, the wake duration increased on the first day of SD compared to baseline but not for the seventh day of SD (Fig. 2C, p < 0.05, baseline vs. 1st day of SD – q (6) = 4.533, p < 0.05, 1st day of SD vs. 7th day of SD – q (5) = 5.033). NREM sleep duration decreased on the first day of SD but showed no difference between the baseline and the seventh day (Fig. 2E, p < 0.05, baseline vs. 1st day of SD – q (6) = 4.496). Moreover, there was an increase of wake duration on the first compared to the seventh day of SD (Fig. 2C, p < 0.05, q(5) = 5.033) and a tendency of increase in the NREM sleep duration during 24-h recording (Fig. 2G, p = 0.0573, q(5) = 4.423). There were no changes in the duration of REM sleep between the time points for the 24 h recording (Fig. 2K). These results show that the mice are sleep deprived during the four-hour SD both on the first day of SD and after a week of daily SD. Further, when accounting for the total 24 h recording, the mice were only deprived of NREM sleep on the first day but not on the seventh day of SD by compensating for the sleep loss in the recovery period (ZT6-2).
To assess whether SD affects the power of the EEG signal, power spectra and the power of NREM sleep over 24 h were analyzed. No significant differences were observed in the power density plots for the 24 h recordings (Fig. 3A–C). However, the distribution of delta power across time varied across recording days (ZT x recording day, p < 0.01, F (46.00, 197.0) = 1.861). On the first day of SD, an increase in NREM sleep power was detected during ZT4 compared to baseline (Fig. 3D, p < 0.05, q(5) = 4.987). On the seventh day of SD, NREM sleep power was increased during ZT3 and ZT4 (Fig. 3D, p < 0.05, ZT3, q(4) = 5.868, p < 0.05, ZT4, q(5) = 4.89), suggesting heightened sleep pressure during the SD exposure. We also see an increase in the delta power on the seventh day of SD at ZT2 compared to the first day of SD (Fig. 3D, p < 0.05, q(3) = 6.126).
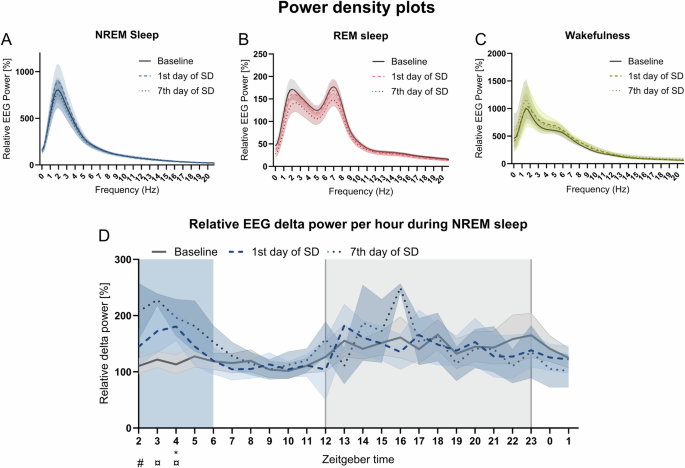
The relative EEG power was calculated for wakefulness, NREM sleep, and REM sleep from the mice (n = 6–7) during the 24 h recordings. Power density plot for A NREM sleep, B REM sleep, and C wakefulness during 24 h on all days. D Relative delta EEG power for NREM sleep per hour for all days. The shaded gray indicates the dark phase (ZT12-0) and the colored shading indicates the timing of SD (ZT2-6). Not all animals entered NREM sleep every hour; thus, the line-types indicate the mean across animals and the colored shading around the line indicates SEM. A repeated measures and paired mixed-effect model with the Geisser-Greenhouse correction with a Tukey’s multiple comparisons test was performed to compare relative EEG power per hour for NREM sleep. Baseline vs 1st day of SD – *p < 0.05 and baseline vs 7th day of SD ¤p < 0.05.
To understand the fragmentation of sleep, bout counts and durations of the vigilance states were analyzed. During SD (ZT2-6), the mean wake bout count decreased on the seventh day of SD (Fig. 4A, p < 0.05, q(6) = 6.312). There was no significant change on the first day of SD, but a tendency for reduction of mean wake bouts (Fig. 4A, p = 0.0579, q(5) = 4.172). The mean duration of wake bouts increased on both experimental days compared to baseline (Fig. 4B, p < 0.05, baseline vs. 1st day of SD – q(6) = 4.894, baseline vs. 7th day of SD – q(5) = 6.065). NREM and REM sleep bouts decreased in number on both experimental days (NREM: Fig. 4C, p < 0.05, baseline vs. 1st day of SD – q(6) = 5.022, p < 0.01, baseline vs. 7th day of SD – q(5) = 7.655) and REM: 4E, p < 0.01, baseline vs 1st day of SD – q(5) = 13.33, p < 0.001, baseline vs 7th day of SD – q(5) = 8.149) but had the same bout duration as at baseline (Fig. 3D, F). These results indicate that the four-h SD increased wake bout duration and decreased the number of NREM and REM bouts yet did not fragment sleep.
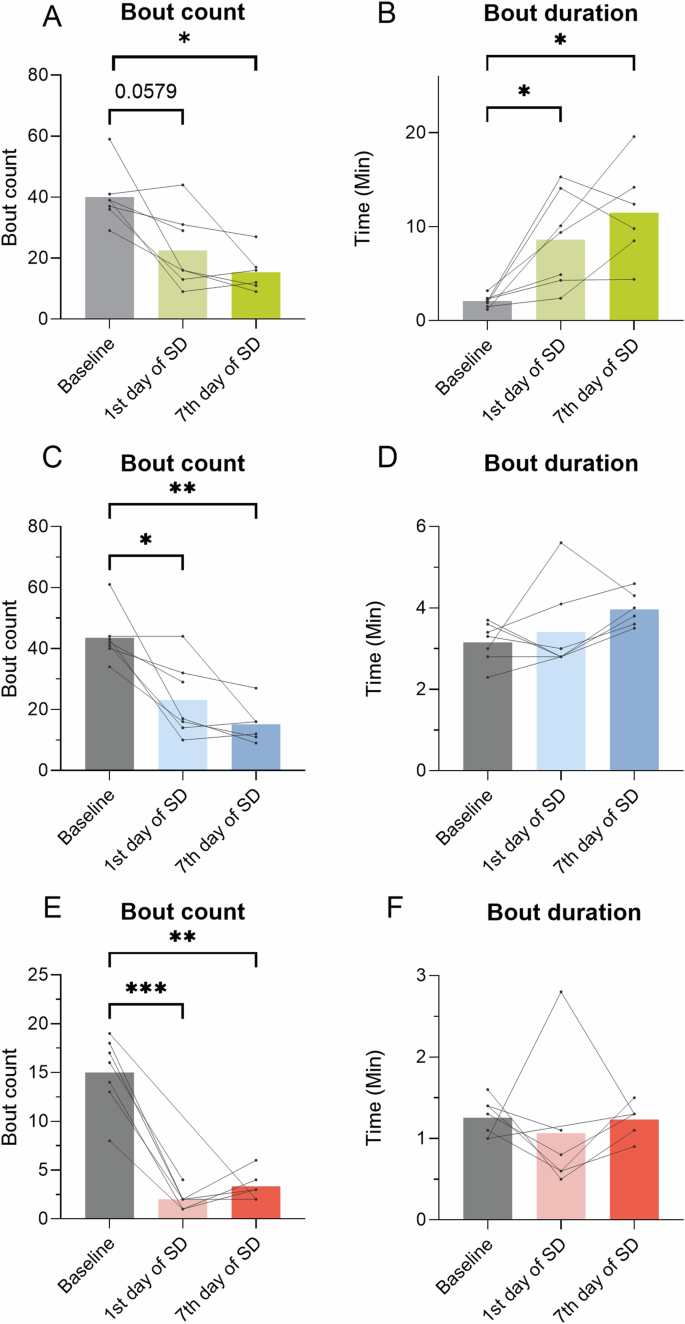
Bout count and duration of wake, NREM, and REM sleep were calculated from the mice (n = 6–7) during SD (ZT2-6) at all time points. A Wake bout count. B Wake bout duration. C NREM bout count. D NREM bout duration. E REM bout count. F REM bout duration. Data from the same mouse from timepoint to timepoint is connected by a line. Repeated measures and paired mixed-effect analysis, with the Geisser-Greenhouse correction and Tukey’s multiple comparisons tests, was used to analyze the data illustrated in the bar plots, *p < 0.05, **p < 0.01, ***p < 0.001.
During the 24 h recording, bout counts for the vigilance states were unchanged between all time points (Fig. 5A, D, G). The bout duration of wake increased on the first day of SD but not on the seventh day of SD (Fig. 5B, p < 0.05, q(6) = 5.765). There was no significant change in bout duration for NREM sleep (Fig. 5E). The duration of REM bouts increased on the seventh day of SD when compared to the first day of SD (Fig. 5H, p < 0.05, q(6) = 5.433) and showed a tendency of increase compared to baseline (Fig. 5H, p < 0.05, q(5) = 4.472). The distribution of bout counts was analyzed by using the percentage distribution of each bout count to accommodate for changes in group size. There were no changes observed in the distribution of the bout for any of the vigilance states (Fig. 5C, F, I). These results indicate that the mean REM sleep bouts became longer on the seventh day of SD.
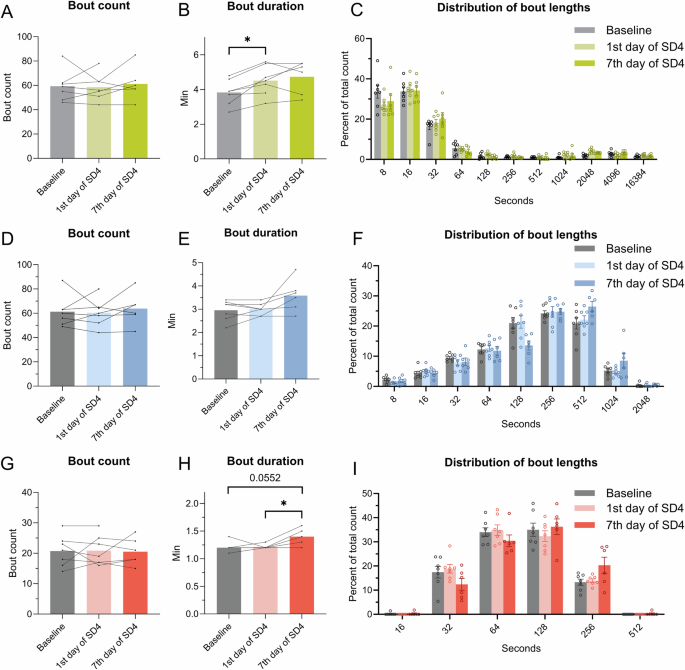
The bout counts and duration of wake, NREM, and REM sleep were calculated from the EEG data (n = 6–7) during 24 h on all days. A Wake bout count. B Wake bout duration. C Distribution of bout lengths of the wake bouts in the percentage of the total count. D NREM bout count. E NREM bout duration. F Distribution bout lengths of the NREM bouts in the percentage of the total count. G REM bout count. H REM bout duration. I Distribution of bout lengths of the REM bouts in the percentage of the total count. For (A, B, D, E, G, H) repeated measures and paired mixed-effect analysis, the Geisser-Greenhouse correction and Tukey’s multiple comparisons test were used to analyze the data, *p < 0.05.
No increased fecal corticosterone across days but an increased locomotor activity during object exposure
To test whether the mice were stressed during the SD, fecal samples were collected, and the concentration of corticosterone (as immunoreactive FCM) was determined. Fecal sampling was chosen due to its non-invasive nature. There was no significant change in the concentration of corticosterone between baseline, early SD, and late SD (Fig. 6A). This indicates that the mice were not substantially stressed by the daily exposure to novel objects. We also evaluated the RMS of the EMG signal to estimate locomotor activity during the recordings. The mice showed a significant increase of the mean RMS during SD (ZT2-6) on the first day of SD compared to the baseline (Fig. 6B. p < 0.001, q(6) = 11.89). During the 24 h, there was only a significant increase of activity at the first day of SD at ZT5 compared to baseline (Fig. 6C, p < 0.05, ZT5 – q(6) = 4.924) but the pattern of activity outside the object exposure did not change significantly on any of the days (Fig. 6B).
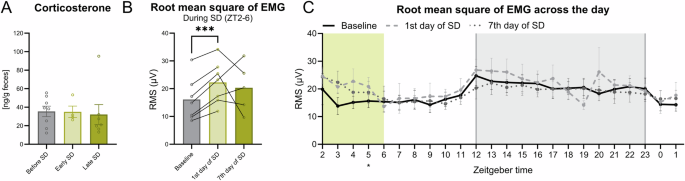
A Fecal boli from the mice were sampled over multiple days. Before, SD had a sample size of eight as the mice were single house, and as one died, only a n of seven at late SD. At early SD, they were double housed, thus having a sample size of four. The bar plot is illustrated with mean ± standard error of the mean (SEM). B The average root mean square (RMS) of the EMG signal between during SD from ZT2-ZT6. C The RMS of the EMG signal over the 24 h recording time on all days. The shaded gray indicates the dark phase (ZT12-0) and the colored shading indicates the timing of SD (ZT2-6). The line-types indicate the mean across animals and the colored shading around the line indicates SEM. A repeated measures paired mixed-effect analysis with the Geisser-Greenhouse correction and a Tukey’s multiple comparisons test were used was performed to compare the different days.
Discussion
The goal of this study was to develop a seven-day SD model using the intrinsic exploratory behavior of the mice, hence inducing voluntary wakefulness in a non-stressful way. First, objects were selected based on their wake-promoting abilities, and a sequence of introduction of objects was developed. Next, the protocol was validated by sleep quantification using EEG/EMG. Our SD protocol resulted in an increased duration of wakefulness during the introduction of objects (ZT2-6), showing an effective SD method both acutely on the first day and after seven days of SD. The delta power of NREM sleep increased during the SD, indicating that some high delta rebound sleep occurs during the SD time interval. On the first day of SD, the mice did not fully recover the lost sleep within the 20 h (ZT6-2) before the next SD period. On the seventh day, the mice did recover the lost sleep at other time points over the 24 h. We, therefore, demonstrate that novel objects can be used to sleep-deprive mice during ZT2-6 for seven days in a row, but this is not a method for a reduction in total sleep across 24 h beyond day one.
Due to the voluntary nature of our protocol, mice did sometimes sleep during object exposure. In these instances, the NREM and REM sleep bouts had the same duration as during baseline, but NREM showed higher delta power compared to baseline. Outside SD the mean REM sleep bout duration increased on day seven but not on day one. This suggests that the strategy for recovery sleep changes with time.
For EEG/EMG recordings mice carry an EEG/EMG electrode implant together with a preamplifier attached to the EEG/EMG recording system. The weight on their heads might have reduced the mice’s interest in interacting with objects. Hence the novel object might work even more efficiently on a non-EEG/EMG mouse although this would have to be validated in a future study.
Since this method is only sleep-depriving mice on the first day when considering all 24 h, we define our protocol as a paradigm of sleep disturbance rather than SD. It is important to consider all 24 h when performing a long-term or sub-chronic SD study, as sleep recovery may occur. Most studies only validate the SD paradigm during the SD period, the first 24 h of SD, or not at all, and do not take into consideration that the mice will habituate and catch up on sleep outside the SD time window1,2,4,24. If the goal is to study the consequences of sleep loss and not disturbance, certain protocols will not be the right ones to choose. The phenomena of sleep rebound outside observation times is also important to consider when interpreting findings from SD protocols in the literature.
The protocol we describe here does not induce elevated corticosterone levels in fecal samples. We chose to perform fecal sampling to not induce stress during sampling. Our finding suggests that the mice are not significantly stressed by our protocol, in contrast to what has been seen with a eight-days long gentle handling protocol1, 72 h and four-days long platforms over water setups18,19, and a three-week automated setup27.
Measuring corticosterone levels in feces is advantageous for several reasons. It reflects the corticosterone levels over a wider range of time as corticosterone levels in blood can change within minutes. Further, sampling feces limits stress induced by the blood sampling procedure35. Stress induced by repeated blood sampling could potentially affect both sleep and corticosterone levels which would bias the primary readouts in our study.
Moreover, we were mainly interested in validating if the novel object exposure induced long-term, and not acute, stress. Fecal corticosterone likely reflects the baseline level more accurate than plasma, which can be highly affected by events in the minutes up until sampling. Further, fecal39 and plasma40 corticosterone levels can fluctuate with circadian rhythm. By measuring corticosterone levels in feces excreted over several days and sampling at the same time of day, the variation introduced by such circadian fluctuation can be minimized.
An increased concentration of corticosterone in blood plasma, urine, or fecal samples is often used as a measure of stress in rodents35,41,42. Cortisol in humans, the equivalent to corticosterone in rodents, is also associated with increased stress and anxiety43,44. However, cortisol has a complex effect in relation to mood45. Studies have shown that an increase in cortisol is not only associated with negative emotions related to stress but also alertness, activeness, and excitement46,47. Similarly, rats show increased corticosterone when exposed to an enriched environment48. Thus, corticosterone measurements are difficult to interpret as just a measure of negative stress.
In general, separating sleep deprivation from stress effects is a challenge in rodent models5, and this is important to consider when interpreting findings from different SD protocols. Potentially more important than the corticosterone level is the translational value of the selected protocol. When considering the neuronal pathways involved in SD, a common feature is the induction of wakefulness, but the upstream pathways could vary and potentially lead to different consequences of the SD. Not only the stress pathway can lead to extended wakefulness, but also factors such as an uncomfortable environment49, fear50,51, and arousal52. The protocol presented here aims to model human activities where the brain is positively aroused without a stressful experience.
During our sleep disturbance experiment, we observed an increase in locomotor activity, possibly caused by the running disc. This could influence the outcome of the experiment. During wheel running, a reduction of the neuronal firing of cortical neurons has previously been observed, resulting in increased slow wave activity during wheel running53,54, possibly interfering with rebound sleep, where increased slow activity is also seen. We chose to include a running disc due to the high interaction time of the mouse with the wheel, which increases its ability to induce voluntary wakefulness. The running disc could be removed from the protocol to eliminate excessive activity, but all wake-inducing objects induce some locomotor activity, so it cannot be completely eliminated. If the running disc is excluded, other similarly highly wake-promoting objects would be needed. Objects with different odors could maybe be used, but this would need validation.
The protocol we describe here is particularly useful for studying the consequences of disrupted sleep during adolescence due to the naturally high level of exploratory behavior in this age group. It is also a simple and low-cost method that is easy to implement. For implementation, we recommend using the objects suggested here or validating new wake-promoting objects by characterizing interaction time and interaction bout lengths. We do not recommend using this sleep disturbance protocol for more than four hours per day as the sleep pressure will then exceed the urge to explore novelty.

Responses