mRMEBP: a unified framework for online detection of atrial fibrillation utilizing deep learning

Introduction
Stroke remains a major contributor to mortality, morbidity, and long-term disability, imposing a substantial economic burden on global healthcare systems1. Analysis spanning 1990 to 2015 reveals that ischaemic heart disease and stroke are the leading causes of disability-adjusted life-years (DALYs) worldwide, with stroke incidents reporting in lower observed DALYs than expected in 94 countries based on their Socio-demographic Index2. Atrial fibrillation (AF), a prevalent cardiac arrhythmia, stands as a primary cause of cardio-embolic stroke3. Despite its widespread recognition in clinical settings among adults4, AF is frequently diagnosed retrospectively, only after a cardio-embolic stroke event has occurred5,6. Notably, approximately 20% of stroke patients are subsequently diagnosed with AF7, and the early diagnosis of AF, coupled with anticoagulation therapy could prevent at least a quarter of these incidents7,8,9. In recent years, the clinical implications of AF have garnered increasing attention among healthcare professionals10,11,12, underscoring the need for reliable, real-time detection of AF to prevent potential thrombosis and cardio-embolic strokes.
Over the past decade, significant progress has been made in AF detection methods13,14,15,16,17,18,19,20,21,22,23,24,25,26,27,28,29,30,31,32,33,34,35,36. These methods are broadly categorized into 3 types based on their feature selection strategies: ① Heart rhythm analysis13,14,15,18,21,23,25,29,30,31,32,34, ② Waveform morphology assessment19,20,24,27,28,35,37, and ③ A combination of rhythm and morphology17,22,26,33,36. Methods belonging to ① typically focus on analyzing the chaotic dynamics of heartbeat intervals, particularly the R-R interval series (RRIs) in Electrocardiograms (ECGs). Features can be extracted from heart rate variability (HRV) analysis and characterized by irregularity. Methods that detect the absence of P-waves (PWA) or the replacement of F-waves in ECGs, indicative of rapid atrial activity (AA), fall under ②. However, the low amplitude of P-waves, combined with high-intensity noise contamination, poses challenges to the accuracy of detection13,38. Currently, there are limited reports on AF detection techniques that solely rely on AA for feature extraction and evaluate performance across multiple databases. In terms of detection methodology, these techniques can be generally grouped into 3 types: ❶ Information entropy-based methods13,15,17,18,33, ❷ Deep Learning (DL)-based models19,20,22,23,24,25,27,28,29,30,31,32,33,34,35,36,37 and ❸ Traditional methods14,21,26. Information theory has extensive applications across various scientific and engineering disciplines39. Among these, entropy-based analyses serve as promising nonlinear metrics, facilitating the quantification and exploration of chaotic dynamics within cardiac systems40. Several entropy measures—such as Shannon, approximate, sample, conditional, and multiscale entropies—have been developed to identify AF events41,42,43. However, despite a century of research, the complex mechanisms underlying AF remain poorly understood, and the turbulent and stochastic characteristics of AF have hindered the development of quantitative metrics for comprehensive dynamic analysis44. DL-based models that harness NN models have demonstrated considerable potential in detecting AF, but they still encounter substantial challenges45,46,47, such as addressing overfitting45 and the need for large, high-quality, anisotropic datasets for effective training46. These models often employ 1D or 2D convolution on ECG waveforms to extract features, posing substantial computational demands on limited hardware platforms or cloud infrastructures45. Ultimately, current diagnostic methods for AF require rigorous validation and customization to suit individual clinical scenarios across diverse databases, thereby ensuring accurate diagnosis and effective management of AF patients12,47. Additionally, traditional NN-based approaches for AF detection, including convolutional NNs (CNNs), recurrent NNs (RNNs), and other variants23,29,30,32,34, heavily rely on clinical expert diagnoses. However, these methods often struggle to capture the intricate and chaotic patterns inherent in AF episodes, primarily because conventional NN models depend on deep learning processes to generate features. These features are indirectly influenced by chaotic cardiac dynamics, reflecting the reliance of clinical decisions on the complex and unpredictable nature of cardiac activity.
In light of these issues, we hereby introduce a unified probabilistic inference approach to enhance our comprehension of cardiac system dynamics. This novel methodology derives 5 robust features directly from the chaotic cardiac dynamics using statistical inference and probabilistic modeling, aiming to capture the essence of AF more accurately. The integrated features encompass various informational dimensions such as heart rate, differential entropy, minimal redundancy of non-AF episodes, and maximal entropy of AF episodes. Subsequently, a feed-forward Back Propagation (BP) NN-based model, designated as mRMEBP (stands for the “minimal Redundancy, Maximal Entropy, and BP model”), is constructed. These 5 feature sequences are derived from RRIs and are denoted as follows: (hat{hr}) represents the normalized median HR sequence; σ signifies the Differential entropy or variance sequence derived from a novel sequence based on the ratio of consecutive heartbeats in RRIs; (s{h}_{alpha }^{{primeprime} }) corresponds to a coarser version of the normalized Shannon entropy (referred to as CNSE) sequence, wherein the redundancy of nAF information is minimized through the application of Gini difference, Symbolic dynamics and Shannon entropy13,48,49; (s{h}_{{rm{HR}}}^{{primeprime} 1}) denotes the primary feature sequence for the mRMEBP, comprising a CNSE sequence of RRIs with a bin interval of 5 beats per minute (bpm); and (s{h}_{{rm{HR}}}^{{primeprime} 2}) represents a CNSE sequence of RRIs with a bin interval of 3 bpm, which enhances the characterization of AF information15. The primary motivation for utilizing (hat{hr}) and σ lies in enriching the mRMEBP model with basic clinical insights, specifically focusing on the model’s bio-mimetic capability to distinguish heightened HR levels, encompassing values up to 170 bpm, alongside the absolute irregularity of RRIs (or rhythm) exhibited during AF episodes50,51,52,53. The features (s{h}_{alpha }^{{primeprime} }) and (s{h}_{{rm{HR}}}^{{primeprime} 2}) complement the (s{h}_{{rm{HR}}}^{{primeprime} 1}) feature in 2 contrasting ways: by minimizing the redundancy of nAF data and maximizing the information entropy of AF data, respectively. This dual strategy bolsters the model’s ability to generalize across diverse clinical settings.
To further strengthen the model’s generalization capabilities in practical diagnostic applications, the training dataset is assembled from 4 different publicly accessible ECG databases: the Long-Term AF Database (LTAFDB), MIT-BIH AF Database (AFDB), MIT-BIH Arrhythmia Database (MITDB), and MIT-BIH Normal Sinus Rhythm Database (NSRDB)54. Data samples are selected from these datasets according to a uniform random distribution (URD). To mitigate overfitting, an equally sized validation set is also created from the remaining data in these 4 databases. Subsequently, the mRMEBP undergoes sophisticated optimization using the training dataset, while the validation set serves to regulate the training epochs. The remaining portions of these databases are then utilized for extensive testing under diverse conditions. The manual annotations provided by medical experts associated with these databases are categorized into 6 types using a Fuzzy logic system. The mRMEBP facilitates the computationally efficient and fully automated screening of AF, while also enabling the online processing of individual heartbeats. The intricacies and implementation details of the framework will be detailed in the Method Section.
Results
Brief introduction of annotations in databases and classification
Given the intricate interplay of factors influencing medical diagnostics, such as variability in data quality, disparities in instrument hardware, patients’ heterogeneous physiological profiles, potential inaccuracies in physician annotations, and operational errors, it is essential for the mRMEBP to exhibit robustness against these challenges. To achieve this, a Fuzzy logic system is utilized to categorize clinical expert annotations from 4 databases into 6 distinct classes. Specifically, (1) nAF annotations are stratified into high-probability (nAFhigh), moderate-probability (nAFmiddle), and low-probability (nAFlow) levels; and (2) AF annotations are segmented into low-risk (AFlow), moderate-risk (AFmiddle), and high-risk (AFhigh) groups. Next, the mRMEBP is constructed based on a BP NN architecture with 5 input nodes, 6 output nodes, a hidden layer with 31 neurons, and a Softmax layer. For the i-th input beat, characterized by features ({hat{hr}}_{i}), σi, (s{h}_{alpha ,i}^{{primeprime} }), (s{h}_{{rm{HR}},i}^{{primeprime} 1}), and (s{h}_{{rm{HR}},i}^{{primeprime} 2}), the mRMEBP produces a vector of 6 probabilities corresponding to the aforementioned 6 label categories: ({p}_{i}{| }_{{{rm{nAF}}}_{{rm{high}}}}), ({p}_{i}{| }_{{{rm{nAF}}}_{{rm{middle}}}}), ({p}_{i}{| }_{{{rm{nAF}}}_{{rm{low}}}}), ({p}_{i}{| }_{{{rm{AF}}}_{{rm{low}}}}), ({p}_{i}{| }_{{{rm{AF}}}_{{rm{middle}}}}), and ({p}_{i}{| }_{{{rm{AF}}}_{{rm{high}}}}). This probability distribution provides clinicians with a comprehensive reference for making informed diagnostic decisions.
An AF beat is classified when the following condition is met:
Otherwise, it is categorized as a nAF beat. The adoption of a multi-class (6-category) classification NN architecture has demonstrated superior detection accuracy based upon our practical test work. Further elaboration on the characteristics of these 4 databases and the specifications of the mRMEBP framework will be provided in the Method Section.
Performance metrics
In evaluating the performance of the mRMEBP, we conceptualize it as a dichotomizer, as depicted in Eq. (1). For a given dataset, the effectiveness of binary classification methods can be gauged in terms of sensitivity (Se), specificity (Sp), positive predictive value (PPV), and overall accuracy (ACC), as defined in the following equations:
where, TP (true positive) denotes the count of beats originating from AF that are accurately identified as AF, TN (true negative) represents the count of beats from nAF sources that are correctly classified as nAF, FP (false positive) signifies the number of beats originating from nAF sources that are incorrectly identified as AF, and FN (false negative) is the count of AF beats that are misclassified as nAF. The Se measures the proportion of true AF beats that are correctly identified as AF, while the Sp quantifies the fraction of true nAF beats that are accurately classified as nAF. The PPV reflects the proportion of algorithm results that are truly positive. Assuming equal importance in accurate detection of both categories, the ACC serves as a critical indicator of the method’s performance on the specific dataset.
Evaluation outcomes of the LTAFDB
The LTAFDB comprises 8,996,056 heartbeats, with 5,326,080 labeled as AF. Heat maps in Fig. 1a, b illustrate the reference annotations for nAF (green) and AF (red), revealing significant overlap and a pronounced heavy-tailed distribution (HTD). Specifically, there are 70,617 and 24,417 heartbeats labeled as nAFlow and AFlow, respectively (see Fig. 1e). This overlap, particularly in the top-right corner of Fig. 1a and the bottom-left of Fig. 1b, indicates numerous misannotations within the LTAFDB.

a Heat map analysis of nAF annotations in the LTAFDB (using (s{h}_{alpha }^{{primeprime} }) vs. (s{h}_{{rm{HR}}}^{{primeprime} 2}), subsequent details omitted). b Heat map analysis of AF annotations in the LTAFDB. c Heat map visualization of beats detected as nAF in the LTAFDB. d Heat map visualization of beats identified as AF in the LTAFDB. e Confusion matrix representing classification results for the LTAFDB. f The overall performance results for the LTAFDB. g Heat map analysis of nAF annotations in the AFDB. h Heat map analysis of AF annotations in the AFDB. i Heat map visualization of beats detected as nAF in the AFDB. j Heat map visualization of beats identified as AF in the AFDB. k Confusion matrix representing classification results for the AFDB. l The overall performance results for the AFDB. The color bars indicate the counts, and the counts are presented in the form of a logarithm base 2. See text for abbreviations.
Figure 1c and d present the identification results from mRMEBP. While the overlapping area decreases, HTD phenomena are no longer evident. The yellow contour lines represent detected AF beats, roughly serving as the classification decision boundary, highlighting mRMEBP’s strength as a bio-mimetic, non-linear classifier with multi-parameter inputs. The confusion matrix in Fig. 1e shows that 99.94% of high-confidence nAFhigh and 99.59% of AFhigh beats are accurately detected. However, detection accuracy drops to 87.62% for nAFmiddle and 52.83% for AFmiddle. Low-confidence beats exhibit the highest misclassification rates, with 82.66% of nAFlow beats misidentified as AFhigh and 99.96% of AFlow beats mislabeled as nAFhigh. These issues stem from outliers and the challenges in distinguishing low-confidence beats.
The performance of mRMEBP on this database is suboptimal, as demonstrated in Fig. 1f, with inherent misannotations in the LTAFDB contributing significantly to the testing results.
Evaluation outcomes of the AFDB
The AFDB, lacking AF annotations in the NSRDB, demonstrates superior quality among the databases, containing 1,221,574 heartbeats with 519,750 AF annotations. Figure 1g and h show minimal overlap between nAF (green) and AF (red) annotations, with only 1604 and 1413 beats labeled as nAFlow and AFlow, respectively (see Fig. 1k). This indicates the AFDB’s excellent quality for AF identification. Figure 1i and j illustrate mRMEBP’s identification results, showing reduced overlap and a weakened HTD effect. The confusion matrix in Fig. 1k reveals that 99.84% of nAFhigh and 99.59% of AFhigh beats are accurately detected, with 87.40% and 78.55% for nAFmiddle and AFmiddle, respectively. However, 90.71% of nAFlow beats are misclassified as AFhigh, and 92.29% of AFlow beats are misclassified as nAFhigh.
The comprehensive performance metrics for mRMEBP on the AFDB are: Se of 98.07%, Sp of 98.75%, PPV of 98.31%, and ACC of 98.46% (see Fig. 1l).
Assessment results of MITDB
The MITDB poses a challenge for accurate AF detection due to diverse complex arrhythmias, containing 109,542 beats with 11,491 annotated as AF. Figure 2a and b show significant overlap between nAF (green) and AF (red) annotations, with a severe HTD and long-tailed distribution (LTD) in the AF region, including 3999 nAFlow beats (see Fig. 2k). This overlap suggests limitations in mRMEBP’s robustness compared to its performance on the LTAFDB and AFDB.
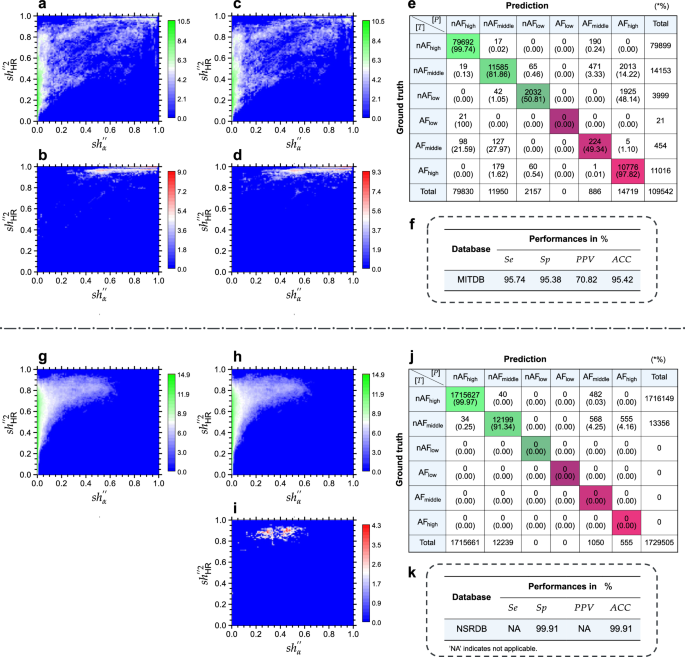
a Heat map analysis of nAF annotations in the MITDB. b Heat map analysis of AF annotations in the MITDB. c Heat map visualization of beats detected as nAF in the MITDB. d Heat map visualization of beats identified as AF in the MITDB. e Confusion matrix representing classification results for the MITDB. f The overall performance results for the MITDB. g Heat map analysis of nAF annotations in the NSRDB. h Heat map visualization of beats detected as nAF in the NSRDB. i Heat map visualization of beats identified as AF in the NSRDB. j Confusion matrix representing classification results for the NSRDB. k The overall performance results for the NSRDB. The color bars indicate the counts, and the counts are presented in the form of a logarithm base 2. See text for abbreviations.
Figure 2c and d display mRMEBP’s identification results, where slight reductions in overlap are observed, but HTD and LTD issues persist. The confusion matrix in Fig. 2e indicates that 99.74% of nAFhigh and 97.82% of AFhigh beats are accurately detected. However, 1.62% of AFhigh beats are misclassified as nAFmiddle, likely due to overlap with other arrhythmias. Detection accuracy for moderate-confidence beats drops to 81.86% for nAFmiddle and 49.34% for AFmiddle. Low-confidence beats show the highest misclassification rates, with 48.14% of nAFlow beats misidentified as AFhigh, and a 100% mislabeling rate for AFlow beats as nAFhigh.
For the MITDB, the achieved Se is 95.74%, indicating that 4.26% of true AF beats are misidentified as nAF. The Sp is 95.38%, revealing that 4.64% of beats from other arrhythmias are misclassified as AF, leading to a relatively high number of false alarms. Consequently, the PPV is 70.82% and ACC is 95.42% (see Fig. 2f).
Assessment results of NSRDB
The NSRDB contains 1,729,505 nAF beats without AF annotations, making it a valuable resource for assessing the Sp of diagnostic algorithms. Figure 2g shows the heat map for nAF beats (green). Figure 2h and i present mRMEBP’s identification results, indicating that only a minimal number of nAF beats are misclassified as AF. The confusion matrix in Fig. 2j highlights a remarkable accuracy of 99.97% for high-confidence nAFhigh beats. However, detection accuracy for moderate-confidence nAFmiddle beats declines to 91.34%, with 4.25% and 4.16% misclassified as AFmiddle and AFhigh, respectively.
The exceptional Sp of 99.91% on the NSRDB underscores mRMEBP’s proficiency in accurately distinguishing true negative heartbeats, resulting in a high predictive accuracy, as shown in Fig. 2k. This further validates the algorithm’s robustness and reliability.
Combining different databases for testing
To ensure the integrity of our evaluation process, strict data partitioning protocols are followed. The datasets designated for model training and validation within the 4 databases are segregated from those allocated for testing, with no overlap permitted. Each dataset undergoes independent assessment to measure its performance. Figure 3a concisely outlines the key findings, with results for the remaining datasets denoted by asterisks (*).
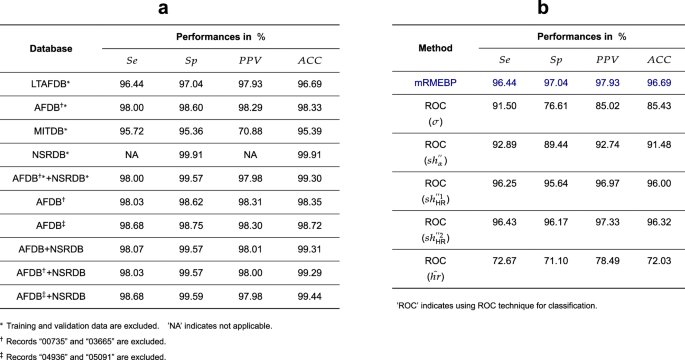
a Evaluation of mRMEBP outcomes across 4 databases under various scenarios. b The detection of AF incorporates the utilization of individual features through ROC curve analysis during validation with the LTAFDB. See text for abbreviations.
Expanding on these points, for the LTAFDB and LTAFDB* datasets, the mRMEBP performance is virtually identical, as evident in Figs. 1f and 3a. This trend is mirrored in the NSRDB and NSRDB* datasets. When considering the AFDB†* and AFDB† datasets (where † indicates the exclusion of records “00735” and “03665” from the AFDB), the marginal differences in the test statistics of the mRMEBP are negligible, as demonstrated in Fig. 3a. The same pattern emerges with the MITDB and MITDB* datasets. Upon examining the AFDB‡ dataset (where ‡ indicates the exclusion of records “04936” and “05091” due to significant misannotations), the performance metrics of mRMEBP include a Se of 98.68%, Sp of 98.75%, PPV of 98.30%, and ACC of 98.72%, as detailed in Fig. 1l.
Furthermore, the robustness of mRMEBP is evaluated under various database combination scenarios. For instance, the combined AFDB+NSRDB dataset yields Se of 98.07%, Sp of 99.57%, PPV of 98.01%, and ACC of 99.31%. Similarly, for the AFDB‡+NSRDB dataset, the corresponding metrics are: Se of 98.68%, Sp of 99.59%, PPV of 97.98%, and ACC of 99.44%. The differences in mRMEBP’s outcomes for the AFDB†*+NSRDB* and AFDB†+NSRDB datasets are also negligible, as depicted in Fig. 3a.
In essence, the proportion of data allocated for training and validation across the 4 databases is kept to a minimum. The full data from these databases are ultimately used for testing, which has a minor impact on the overall performance of mRMEBP. As such, we initially decided to utilize the all data from all 4 databases for the assessment of mRMEBP.
Discussion
The Receiver Operating Characteristic (ROC) curve is an essential tool in the medical field for determining the optimal discriminatory threshold in clinical diagnostic tests. The features (hat{hr}), σ, (s{h}_{alpha }^{{primeprime} }), (s{h}_{{rm{HR}}}^{{primeprime} 1}), (s{h}_{{rm{HR}}}^{{primeprime} 2}) identified in the present study can be individually employed for AF detection using ROC curves, consistent with our previous research13,15. Utilizing the LTAFDB as a benchmark, we derive optimal thresholds on the ROC curves for each feature. Figure 3b illustrates the optimal performances achieved with these 5 features. As observed, the approach based on (s{h}_{{rm{HR}}}^{{primeprime} 2}) achieves the highest performance, closely followed by the (s{h}_{{rm{HR}}}^{{primeprime} 1}) method. The (s{h}_{alpha }^{{primeprime} }) method demonstrates moderate performance, while the σ and (hat{hr}) methods result in suboptimal outcomes, due to interference from other arrhythmias that can also cause elevated HR and increased variability. Notably, the mRMEBP, leveraging the advanced learning capabilities of the DL-based model, surpasses the optimal classification performance achieved on the ROC curve for all 5 feature parameters.
The primary objective of real-time AF detection techniques is to thoroughly scrutinize ECG beats on a per-beat basis, ensuring that each heartbeat in a designated database is precisely identified and factored into the computation of Se, Sp, PPV, and ACC. In contrast, for some offline-type methods18,19,20,22,23,24,25,26,27,28,31,32,33,35,36, detection resolution typically hinges on specific signal segments spanning several seconds or encompassing multiple beats of nAF/AF. This results in a slight divergence in the performance metrics used to assess these 2 kind methods. Moreover, for some offline detection techniques, the test process may not utilize all the heartbeats contained within the specified databases55. Within the confines of this study, our focus will be solely on introducing several noteworthy offline approaches and the primary online detection methods that have emerged over the past decade. Due to the inherent disparities in evaluation criteria between offline and online detection techniques, the test results outlined in Table 1 for state-of-the-art detection methods should be interpreted as a comparative overview, albeit with limitations. The selection principles for these methods are grounded in the utilization of identical databases, consistent records, and corresponding expert annotations for evaluation. Table 1 presents a summary of the recently published evaluation results for these methods across various databases, highlighting that the majority of these approaches employed RRIs as a feature resource in their analyses.
Luo et al.34 introduced a method for AF screening, which is based on Sobolev test statistics and an end-to-end learnable model (LM). This proposed model underwent rigorous cross-dataset validation, encompassing both training and testing phases. The achieved ACC were 95.00%, 97.30% and 95.40% for the LTAFDB, AFDB and MITDB, respectively, and 99.60% for NSRDB in terms of Se. Kumar et al.32 developed an offline approach incorporating 2 CNN layers. They reported ACC of 97.04% and 87.98% for the AFDB and MITDB, respectively, and Sp of 94.44% for the NSRDB. Similar to the current study, Jahan et al.30 evaluated their adaptive boosting (AdaBoost)-based approach across 4 databases. A distinguishing characteristic of their method was the utilization of Shannon entropy derived from HRV analysis of RRIs. They reported Se values of 86.45%, 87.58%, 85.67%, and Sp values of 81.57%, 89.27%, 81.25% for the LTAFDB, AFDB, and MITDB, respectively; the Sp for the NSRDB was 93.21%. Liu et al.29 presented a technique that incorporated a multi-scale grouped convolutional NN (MGNN) coupled with self-attention for automated feature extraction. This approach yielded ACC of 97.07% and 92.23% for the AFDB and MITDB datasets, respectively; the Sp for the NSRDB was 96.86%. Andersen et al.23 introduced a novel offline method that employed a nonlinear median filter in conjunction with a hybrid of CNN and RNN. Their results demonstrated ACC of 97.80% and 87.40% for the AFDB and MITDB, respectively; the Sp for the NSRDB was 95.01%. Sološenko et al.21 presented a method wherein the robustness against false alarms was enhanced through the implementation of signal quality assessment (SQA), and a decision logic framework was utilized for classification purposes. The reported ACC were 97.80% and 92.60% for the AFDB and MITDB, respectively, while the Sp for the NSRDB was 99.20%. Ródenas et al.17 employed entropy-based features derived from both rhythm (RRIs) and morphology (AA) in their developed technique. A linear discriminant analysis (LDA)-based classifier was utilized for decision-making, achieving ACC of 96.96% and 91.98% for the AFDB and MITDB, respectively. In our previous study15, the feature (s{h}_{{rm{HR}}}^{{primeprime} 1}) was adopted, utilizing the ROC curve-based threshold for decision-making. The LTAFDB was used for training purposes, while the remaining databases were employed for comprehensive testing under diverse conditions. The pertinent results are documented in the bottom segment of Table 1.
Methods
Information theory
Differential entropy
The Differential entropy (DE), an extension of entropy for continuous random variables, measures the uncertainty inherent in the probability density function (PDF) of a continuous random variable. For the 1-dimensional continuous random variable (({boldsymbol{mathcal{X}}})), its DE, denoted as ({boldsymbol{mathcal{H}}}({boldsymbol{mathcal{X}}})), is defined as follows56:
where p(x) represents the PDF of the random variable ({boldsymbol{mathcal{X}}}). We proceed to analyze 2 types of distributions associated with ({boldsymbol{mathcal{X}}}).
(1) Assuming that ({boldsymbol{mathcal{X}}}) conforms to a normal (Gaussian) random distribution (GRD), denoted as ({[{boldsymbol{mathcal{X}}};P]}_{{rm{Gauss}}}), its PDF is expressed as:
where, μ is the mean of ({boldsymbol{mathcal{X}}}),
σ2 represents the variance of ({boldsymbol{mathcal{X}}}),
By substituting the Equations (4), (5) and (6) into the Eq. (3), we get the following result:
Eq. (7) reveals that the DE of ({[{boldsymbol{mathcal{X}}};P]}_{{rm{Gauss}}}) is exclusively determined by the variance σ2, independent of the mean μ.
(2) If the ({boldsymbol{mathcal{X}}}) follows a URD, denoted as ({[{boldsymbol{mathcal{X}}};P]}_{{rm{URD}}}), the PDF is given by:
By inserting the Eq. (8) into Eq. (3), we obtain:
It is evident from Eq. (9) that the DE of ({[{boldsymbol{mathcal{X}}};P]}_{{rm{URD}}}) is solely dependent on the range width t − f (or t, when f = 0).
Shannon entropy
Shannon entropy (SE) is a statistical measure that quantifies the information content within a discrete time series. To represent the probability space of a dynamic system, we introduce the notation A = (A∣PA), where A represents the set of characteristic elements and PA denotes the corresponding probability distribution. Let N represent the cardinality of A, indicating the total number of elements. Specifically, (A=left{{a}_{1},ldots ,,{a}_{k}right}) includes the distinct elements, while ({P}_{A}={{{p}_{A}}_{1},ldots ,,{{p}_{A}}_{k}}) denotes the corresponding probabilities, with k being the count of unique elements in A (1 ⩽ k ⩽ N). Each element ai corresponds to a probability ({{p}_{A}}_{i}={N}_{i}/N), with Ni representing the frequency of occurrence of ai in A ((0 ,< ,{{p}_{A}}_{i},leqslant, 1), (mathop{sum }nolimits_{i = 1}^{k}{p}_{{A}_{i}}=1)). The normalized form of SE is defined as follows57,
To further emphasize the impact of the total number of distinct elements (i.e., k) on ({boldsymbol{mathcal{H}}}^{prime}({bf{A}})), a coarser version of the entropy metric is defined as follows13,
The ({boldsymbol{mathcal{H}}}^{{primeprime}}({bf{A}})) aims to accentuate the contribution of the element diversity to the overall informational content captured by the entropy metric.
Gini difference
The Gini Index represents a pivotal measure for evaluating data purity within a probability space. As mentioned previously, for the dynamic system A = (A∣PA), the Gini Index can be formulated as,
A lower value of Gini(A) signifies a higher level of purity within the A set, and vice versa. Considering a second dynamic system B = (B∣PB) that coexists within the same probability space as A. The Gini difference between the 2 systems is defined as:
This Gini difference metric quantitatively captures the degree of divergence in purity between sets A and B. Specifically, in the context of binary classification tasks, maximizing ({{rm{Gini}}}^{{prime} }({bf{A}};{bf{B}})) aids in the detection of key information that differentiates between the 2 systems (i.e., maximum margin), enhancing the discriminative capability of binary classifiers.
Symbolic dynamics
Symbolic dynamics (SDS) functions as a reductionist analytical tool in the exploration of chaotic systems, exemplified by the nonlinear dynamics of the cardiac system. Consider a measure space (Θ, sy, d), where Θ denotes the state space, sy represents a symbol sequence derived from the transformation of Θ via an algebraic table of the dimensionality κ, and d signifies the scaling factor for transformation. The SDS framework for (Θ, sy, d) encompasses 3 primary steps13,15,49,58:
-
1.
Symbolization and mapping: A straightforward linear map from Θ to sy is implemented:
$$s{y}_{i}=left{begin{array}{ll}kappa -1&{rm{if}},{Theta }_{i},geqslant ,Theta {| }_{{rm{MAX}}}\ leftlfloor {Theta }_{i}/drightrfloor & {rm{otherwise}}end{array}right.$$(14)Here, i indexes the sample, ⌊⋅⌋ is the floor operator, (Theta {| }_{{rm{MAX}}}) stands for the predetermined upper cut-off threshold with (dtimes (kappa -1)=lfloor Theta {| }_{{rm{MAX}}}rfloor), and κ = 64 in this study.
-
2.
Generation of word sequences: To capture the relationships among consecutive symbols, such as the rhythm of RRIs, a word sequence wv is constructed from m consecutive sy symbols:
$$w{v}_{i}=mathop{sum }limits_{j=0}^{m-1}s{y}_{i-j}times {kappa }^{j}$$(15)The significance of wv lies in enabling probability density analysis (PDA) of Θ within a constrained space, with m = 3 applied herein.
-
3.
Statistical pattern recognition: DL strategies and other probabilistic techniques can then be employed to extract valuable insights about the dynamics of Θ. This analysis involves histogram frequencies, DE, SE, Gini difference, and other features derived from the sequence wv.
Features generation methodology
In the realm of HRV analysis, conventionally derived features have demonstrated a propensity for being susceptible to outliers. To overcome these limitations, we herein introduce 5 robust features that are grounded in the probability density distribution associated with the RRIs, ensuring outlier-insensitivity. For the purposes of this study, the upper cut-off threshold for heart rate sequences (HRS), denoted as hr, is set at (hr{| }_{{rm{MAX}}}=315) bpm.
DE (or variance) of the derived ratio sequence α from RRIs (σ)
In cardiology, the successive beat ratio of RRIs (denoted as rr), which is represented by rri/rri−1, holds clinical importance for identifying cardiac arrhythmias when it surpasses specific thresholds such as rri/rri−1 ⩽ 0.9 (or ⩾ 1.1). For this purpose, we introduce a novel ratio sequence, denoted as α, defined as follows:
The mean value of the α sequence approximates 1. As a representative case, utilizing the LTAFDB, the histograms of α pertaining to nAF (3,669,976 beats) and AF (5,326,080 beats) are illustrated in Fig. 4a. Notably, both histograms exhibit a proximity to the GRD as defined in Eq. (4), confirming the chaotic nature of the cardiac system: chaotic behavior is relatively mild in the case of NSR but becomes significantly more pronounced during AF. Consequently, we can utilize the Eq. (7) to calculate the DE of α. In terms of computational resources, the σ defined in Eq. (6) serves as a surrogate for the term ({2}^{-1}log (2pi {sigma }^{2})+{2}^{-1}) in Eq. (7). The discrete form of Eq. (6) is expressed as follows:
For real-time monitoring, N1 represents the width of the sliding window (N1 = 130 in this study), with an introduced delay of 65 beats in Equations (16) and (17). Figure 4c depicts histograms of the discrete form of σ for the nAF and AF beats. It is observed that σ can be used, albeit with some overlap in incorrectly detected areas, as an approximate indicator for distinguishing between nAF and AF beats. These incorrect detections are denoted as pσ(Error∣nAF) and pσ(Error∣AF).
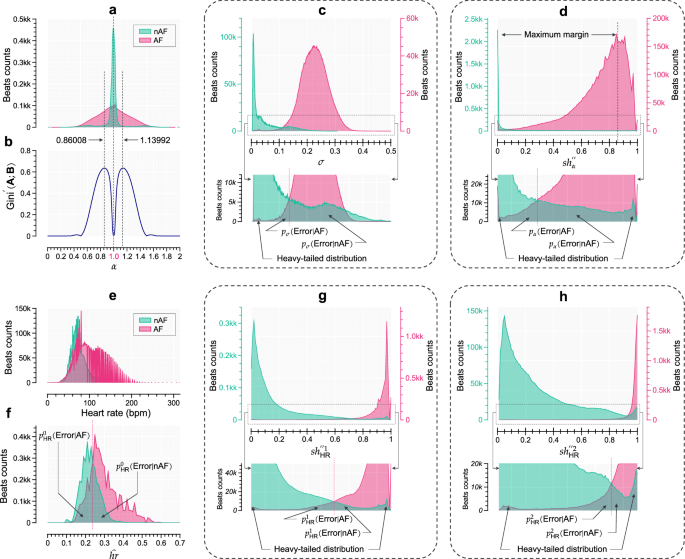
a Histograms depicting α values for nAF and AF beats. b Computation of the Gini difference curve based on various ratio sequence divisions of α. c The variance (σ) histograms for nAF and AF beats, with a localized enlarged subplot at the bottom (LESPB). d The CNSE (s{h}_{alpha }^{{primeprime} }) histograms for nAF and AF beats, accompanied by a LESPB. e Histograms illustrating HR sequence for nAF and AF beats. f Histograms showing estimated heart rates ((hat{hr})) for nAF and AF beats. g The CNSE (s{h}_{{rm{HR}}}^{{primeprime} 1}) histograms for nAF and AF beats, along with a LESPB. h The CNSE (s{h}_{{rm{HR}}}^{{primeprime} 2}) histograms for nAF and AF beats, along with a LESPB. See text for abbreviations.
The CNSE of the α sequence ((s{h}_{alpha }^{{primeprime} }))
In this section, we detail the construction of CNSE (s{h}_{alpha }^{{primeprime} }) for the α sequence, with the objective of minimizing superfluous information within the nAF rhythm while concomitantly preserving AF information. Specifically, within the Symbolic dynamics framework, we seek to represent nAF information using a singular symbol. As depicted in Fig. 4a, the histograms are primarily concentrated within the range of [0.35, 1.65]. Therefore, we localize the feature within this range, establishing a lower bound lα = 0.35. Furthermore, we introduce a parameter threshold ϑ (ϑ < 1.0) and calculate the scaling factor d as d = (ϑ − lα)/31. The Eq. (14) is then adjusted to form,
By adopting this novel parameterized symbolic mapping approach, we aim to capture a substantial portion of the nAF information via the symbol ‘31’. To ascertain the optimal value for ϑ, a numerical evaluation is performed across the range of (0, 1) with incremental steps of 0.00001. Utilizing Equations (15) and (13), we calculate the Gini difference between nAF and AF beats within the probability space [0, 1], yielding the Gini difference curve depicted in Fig. 4b. The peak at ϑ = 0.86008 indicates the optimal threshold, closely approximating 0.9 as previously mentioned. Utilizing this identified optimal threshold, we apply the Equations (18), (15), and (11) to derive the CNSE (s{h}_{alpha }^{{primeprime} }) for the α sequence. As evident in the corresponding histograms presented in Fig. 4d, there is a notable concentration of nAF information within a confined range, while AF information remains distinct. This compression and preservation of nAF/AF information facilitate efficient discrimination between nAF and AF beats, attributable to the maximized margin. The error probabilities associated with this discrimination are denoted by pα(Error∣nAF) and pα(Error∣AF).
Normalized median HRS ((hat{hr}))
A hallmark of AF is the elevated HR50,51,52,53. Therefore, it is essential for the DL-based model to initially utilize basic clinical insights to identify AF instances with high HR levels. The histograms in Fig. 4e reveal the distribution of HR values associated with nAF and AF beats, corroborating the increased HR in AF compared to nAF beats. We assume the histogram of AF within the range [40, 200] bpm follows a URD as defined in Eq. (8), the corresponding DE ({boldsymbol{mathcal{H}}}_{{rm{URD}}}({boldsymbol{mathcal{X}}})) is solely determined by the range of HR values, as derived from Eq. (9). This finding is consistent with clinical practice, where controlling HR level is a primary therapeutic approach in managing AF50,51,52,53. However, the direct utilization of HR or the mean of HR sequences, both susceptible to outliers, which makes them lack robustness for this application. To address this, we introduce a normalized median HRS defined as,
If ({hat{hr}}_{i}, > ,1), we set ({hat{hr}}_{i}=1) to ensure normalization. The median filter, denoted by median{ ⋅ }, is utilized for its resistance to outliers. In the context of online screening, N2 represents the width of the sliding window (with N2 = 131 in this study), introducing a delay of 65 beats in Eq. (19). Figure 4f illustrates histograms of (hat{hr}) for nAF and AF beats. The errors resulting from this feature are denoted as ({p}_{{rm{HR}}}^{0},({rm{Error| nAF}})) and ({p}_{{rm{HR}}}^{0},({rm{Error| AF}})), respectively.
CNSE of HRS with a bin interval of 5 bpm ((s{h}_{{mathbf{HR}}}^{{primeprime} 1}))
To refine the mRMEBP understanding of the inherent irregularities within HRS, particularly concerning consecutive heartbeat rhythms, we introduce a symbol transformation mapping function for HRS. This function employs a bin interval of 5 bpm (i.e., the scaling factor d = 5), as established in our previous work15. The mapping function is defined as follows:
For computing the Eq. (11) (denoted as (s{h}_{{rm{HR}}}^{{primeprime} 1})) using Equations (20) and (15), a window size of 128 beats (N3 = 128) is adopted. The cumulative delay for these equations is synchronized with the preceding 3 features, spanning a total of 65 beats. The feature (s{h}_{{rm{HR}}}^{{primeprime} 1}) serves as a primary characteristic, designed to provide a balanced representation of both nAF and AF information. The corresponding histograms are presented in Fig. 4g. The misdetection probabilities associated with this feature are denoted as ({p}_{{rm{HR}}}^{1}({rm{Error| nAF}})) and ({p}_{{rm{HR}}}^{1}({rm{Error| AF}})).
CNSE of HRS with a narrow bin interval of 3 bpm ((s{h}_{{mathbf{HR}}}^{{primeprime} 2}))
To enhance the representation of the consistency of AF beats, we introduce the novel feature (s{h}_{{rm{HR}}}^{{primeprime} 2}). This feature is specifically tailored to capture the irregularity of AF with higher resolution by employing a narrower bin interval of 3 bpm compared to the previously used 5 bpm. As observed in the histogram (Fig. 4e), the majority of HR values for AF beats fall within the range of 30 to 220 bpm. The mapping function for (s{h}_{{rm{HR}}}^{{primeprime} 2}) is thus defined as follows:
Beats within a window N3 (N3 = 128) contribute to the calculation of Eq. (11) (i.e., (s{h}_{{rm{HR}}}^{{primeprime} 2})) using the Equations (21) and (15). As depicted in Fig. 4h, the corresponding histograms highlight a concentrated range for AF, indicating the effectiveness of the narrower bin interval. Detection errors within the overlap region of Fig. 4h are denoted as ({p}_{{rm{HR}}}^{2},({rm{Error| nAF}})) and ({p}_{{rm{HR}}}^{2},({rm{Error| AF}})).
The (s{h}_{alpha }^{{primeprime} }) feature exhibits a preference for minimal redundancy, particularly in episodes of nAF accompanied by NSR, as exemplified in Fig. 4d. This implies that the mitigation of NSR-related information could potentially augment the system’s robustness against false alarms in detection. In contrast, the (s{h}_{{rm{HR}}}^{{primeprime} 2}) feature manifests a tendency towards maximal entropy, typically observed during AF episodes associated with severe arrhythmia, as illustrated in Fig. 4h. The complementary nature of (s{h}_{alpha }^{{primeprime} }) and (s{h}_{{rm{HR}}}^{{primeprime} 2}) becomes evident within the mRMEBP framework, emphasizing their combined efficacy in distinguishing between various cardiac rhythm states.
As observed, to improve model adaptability, we normalize all features associated with each heartbeat within the range of [0, 1]. A thorough analysis of Fig. 4c–h reveals that each feature individually exhibits promising potential in identifying AF. Nevertheless, a crucial observation highlights that these features are also prone to a significant number of false detections in the overlapping histogram regions of nAF and AF. To surmount this challenge, the mRMEBP framework leverages extensive training to capitalize on the strengths and offset the deficiencies of these 5 features. This tactic is designed to significantly enhance the precision of AF detection, resulting in a more reliable and accurate diagnostic modality.
Dataset sources and label classification
To evaluate the mRMEBP framework, 4 clinical ECG databases, namely LTAFDB, AFDB, MITDB, and NSRDB, are utilized for extensive training, validation, and testing across various scenarios. The manual annotations provided by experts affiliated with these databases are systematically classified into 6 categories using a Fuzzy logic system.
Dataset sources
Figure 5e provides a concise summary of the basic information of 4 databases. Specifically, the LTAFDB comprises a comprehensive collection of 84 long-term ECG recordings obtained from individuals diagnosed with either paroxysmal or sustained AF. As demonstrated in Figs. 1a, b, 4a–h, and 5a, the distributions represented by the maps and histograms of nAF and AF beats exhibit significant overlap, along with LTD and HTD phenomena. This is further exacerbated by the presence of numerous misannotations, outliers, and other intricate cases within the data. Therefore, relying solely on the LTAFDB for training purposes, due to its inferior data quality, may introduce biases into the model’s classification results. The AFDB consists of 25 long-term ECG recordings from patients with AF. The original ECG waveform data for 2 of these recordings, namely “00735” and “03665”, are unavailable. Additionally, 2 other recordings, “04936” and “05091”, contain a limited number of inaccurate annotations. From Figs. 1g, h, 5b, as well as figures pertaining to other databases, it can be deduced that the AFDB possesses the superior quality among the 3 databases with AF annotations, despite a slight indication of HTD primarily resulting from a small number of inaccurate annotations present in recordings “04936” and “05091”, as evidenced in the top-right corner of Fig. 1g and the sub-figures within Fig. 5b. It is therefore prudent to recognize that the exclusive reliance on this database for training a DL-based model may potentially compromise the model’s generalization ability. The MITDB compiles a collection of 48 half-hour, 2-lead ECG recordings from 47 subjects, encompassing a rich array of arrhythmia information that includes AF, Atrial Flutter (AFL), Supraventricular Tachycardia, and various other arrhythmia types. The resulting maps and histograms of nAF and AF beats demonstrate significant overlapping regions and exhibit the HTD and LTD phenomena, as shown in Figs. 2a, b, and 5c. Consequently, similar to the LTAFDB, the MITDB, when utilized solely for training DL-based models, may pose potential limitations in practical applications. The NSRDB comprises 18 long-term recordings of subjects, each spanning approximately 24 h. Notably, these recordings do not exhibit significant arrhythmias and lack annotations for AF. As observed in Figs. 2g and 5d, there is no discernible phenomenon characterizing LTD or HTD. This suggests that the NSRDB is of high quality for studying nAF, such as NSR, but it cannot serve as an independent resource for training the model to identify AF.
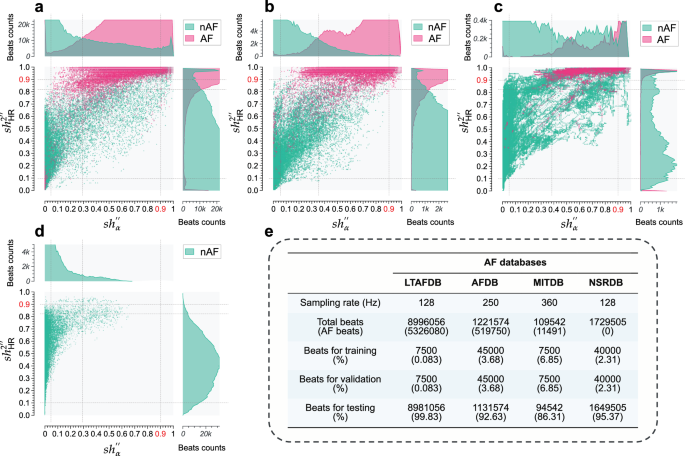
a Feature distribution maps of AF and nAF beats from the LTAFDB, with accompanying histogram sub-figures. b Feature distribution maps of AF and nAF beats from the AFDB, with accompanying histogram sub-figures. c Feature distribution maps of AF and nAF beats from the MITDB, with accompanying histogram sub-figures. d Feature distribution maps of nAF beats from the NSRDB, with accompanying histogram sub-figures. e Overall information on training, validation, and testing for the 4 databases. The distribution maps are created using 100,000 uniformly randomly sampled data points from each database. See text for abbreviations.
Label classification
As aforementioned, each database possesses inherent limitations when utilized solely for training the DL-based model. A strategic solution involves extracting a diverse training set from multiple databases, prioritizing the use of AFDB and NSRDB as primary sources, supplemented by data from LTAFDB and MITDB (as detailed in Fig. 5e).
In the context of Fuzzy logic, given a universe of discourse U, a Fuzzy subset F can be represented by an ordered pair set, consisting of the feature x and its respective membership function μF(x), denoted as:
For the features (s{h}_{alpha }^{{primeprime} }) and (s{h}_{{rm{HR}}}^{{primeprime} 1}) incorporated into a Fuzzy system, their domains of discourse are defined as ({U}_{s{h}_{alpha }^{{primeprime} }}={U}_{s{h}_{{rm{HR}}}^{{primeprime} 1}}=[0,1]). The proposed Fuzzy decision-making framework comprises 3 sequential steps for label classification, as illustrated in Fig. 6, which are detailed as follows:
-
1.
Establishment of Fuzzy membership functions for nAF and AF. The type-I membership function template for nAF is:
$$begin{array}{l}{mu }_{{rm{nAF}}}(x)=left{begin{array}{ll}frac{1}{1+{[a(x-c)]}^{b}},quad {rm{if}},x, > ,c\ 1,qquadqquad,,,{rm{if}},x,leqslant ,cend{array}right.\ a,b ,> ,0end{array}$$(23)This function is illustrated in the lower sub-figure of Fig. 6b. Similarly, the type-II membership function template for AF is formulated as:
$${mu }_{{rm{AF}}}(x)=left{begin{array}{ll}1,qquadqquadquad{rm{if}},x,geqslant ,c\ frac{1}{1,+,{[a(x-c)]}^{b}},quad,,{rm{if}},x ,< ,cend{array}right.$$(24)The function defined in Eq. (24) is depicted in the upper sub-figure of Fig. 6b. The constants a = 100 and b = 2 are employed in the present study.
-
2.
Definition of Fuzzy decision-making membership functions. For i-th beat characterized as either nAF or AF, 2 Fuzzy decision-making membership functions are defined as the algebraic product:
$$left{begin{array}{l}{gamma }_{{rm{nAF}},i}={left[{mu }_{{rm{nAF}}}(s{h}_{alpha ,i}^{{primeprime} })times {mu }_{{rm{nAF}}}(s{h}_{{rm{HR}},i}^{{primeprime} 1})right]}^{1/2}quad \ {gamma }_{{rm{AF}},i}={left[{mu }_{{rm{AF}}}(s{h}_{alpha ,i}^{{primeprime} })times {mu }_{{rm{AF}}}(s{h}_{{rm{HR}},i}^{{primeprime} 1})right]}^{1/2}quad end{array}right.$$(25)These functions are visualized in Fig. 6c.
-
3.
Label classification. By applying the parameter configurations outlined in Fig. 6f, and using Eq. (25), annotations from 4 databases are classified into 6 categories: (a) nAF annotations are labeled as high-probability (nAFhigh), moderate-probability (nAFmiddle), and low-probability (nAFlow); and (b) AF annotations are grouped into low-risk (AFlow), moderate-risk (AFmiddle), and high-risk (AFhigh) categories. Notably, the parameter settings for the proposed Fuzzy decision-making framework are indicated with dashed and solid lines in Figs. 5a–d and 6a.
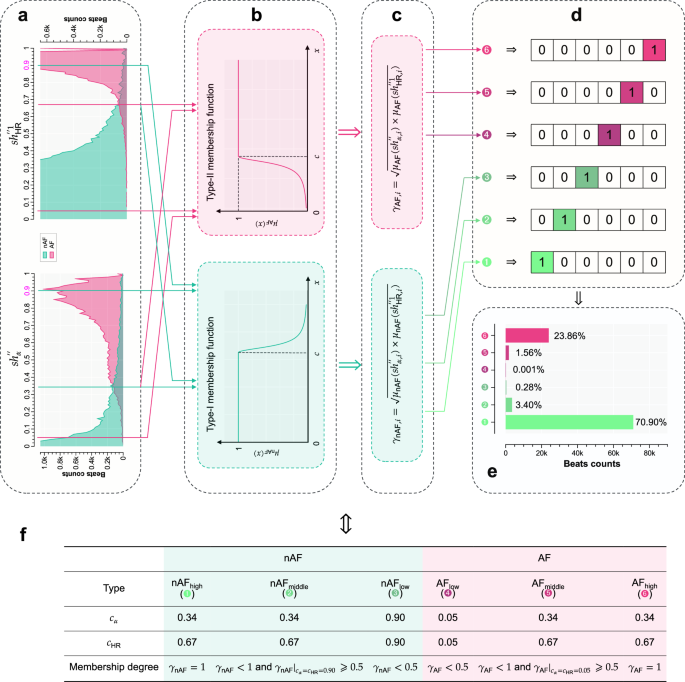
a Histograms depicting nAF and AF characteristics using features (s{h}_{alpha }^{{primeprime} }) and (s{h}_{{rm{HR}}}^{{primeprime} 1}) for the training set. b Membership function curves for quantifying nAF and AF. c 2 Fuzzy decision-making membership functions for classifying nAF and AF. d One-hot encoded representations of 6 categorical labels. e Classification distribution of the training set. f Parameter settings for the proposed Fuzzy decision-making framework. See text for abbreviations.
This methodology enables the mRMEBP method to provide a more comprehensive and insightful classification outcome, which is expressed through scatter probability distributions, thereby enhancing the reliability and interpretability of the results derived from the DL-based model.
Construction of the mRMEBP framework, and model training, validation and testing
Construction of the mRMEBP framework
The foundation of the mRMEBP is a feed-forward NN model that incorporates a BP algorithm (BPNN) for training. We conducted a rigorous grid search to identify the optimal parameters for our NN model, based on extensive practical testing. The comprehensive list of tested parameters for this model includes:
-
1.
Input features: We explored various input feature combinations, including 2, 3, 4, and 5 features, while also considering diverse permutations and combinations;
-
2.
Hidden layers: We evaluated configurations with both a single and double hidden layer to assess their impact on performance;
-
3.
Neurons per hidden Layer: For each hidden layer, we tested an array of neuron counts: 11, 21, 31, 51, 81, 101, and 121, aiming to find the optimal balance between complexity and performance;
-
4.
Activation functions: We experimented with a wide range of activation functions to enhance the network’s expressive power, including Sigmoid, ReLU, Leaky ReLU, TANH, ELU, GELU, and SELU functions;
-
5.
Classification tasks: We addressed both binary (2-category) and multi-class (6-category) classification tasks to demonstrate the versatility of our approach;
A momentum-based gradient descent algorithm is utilized to update the NN structure weights. Ultimately, the optimal NN architecture emerged, featuring 5 input nodes (({hat{hr}}_{i}), σi, (s{h}_{alpha ,i}^{{primeprime} }), (s{h}_{{rm{HR}},i}^{{primeprime} 1}), and (s{h}_{{rm{HR}},i}^{{primeprime} 2})), 6 output nodes (for the 6-category classification), a single hidden layer comprising 31 neurons, leveraging the Sigmoid activation function in the hidden layer, and a Softmax layer for the final classification. This configuration yielded the best overall performance. The final architecture of the BPNN, as shown in Fig. 7, highlights these design choices. Figure 8 illustrates the Sigmoid function and demonstrates its efficient implementation in our model.
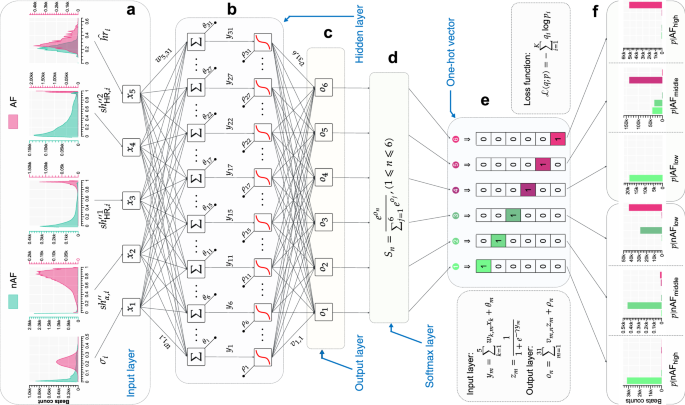
a The input layer with 5 features. b The hidden layer comprising 31 neurons and utilizing the sigmoid activation function. c The output from the hidden layer. d The Softmax layer for classification. e One-hot encoded representations of 6 categorical labels. f The distribution of class predictions for the input data set. See text for abbreviations.
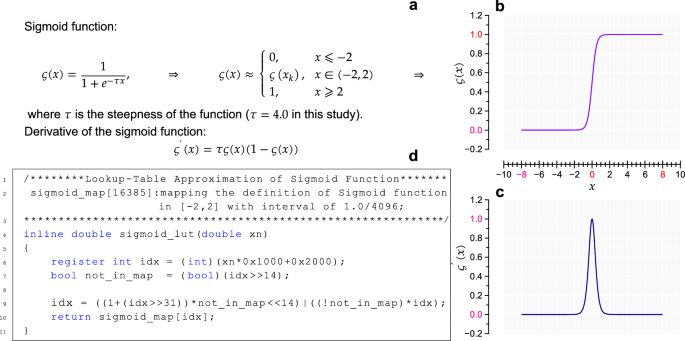
a The definition of Sigmoid function and its piecewise representation. b The characteristic curve of the Sigmoid function. c The characteristic curve of the derivative of the Sigmoid function. d Fast implementation method of the Sigmoid function, demonstrated in the context of C programming language.
Model training, validation, and evaluation
The aforementioned 4 databases are extensively utilized for evaluating AF detection methods. Therefore, we curate separate datasets specifically for training, validation, and testing purposes from these databases. We employ a uniform random sampling method to select the training and validation sets from the 4 databases. Notably, we impose an additional constraint on the training set by excluding annotations labeled as AFlow and nAFlow from the AFDB† due to their high propensity for inaccurate labels and outliers. This exclusion reduces the risk of contaminating the mRMEBP model and potential overfitting. Figure 6e depicts the classification outcomes achieved for the training set, while the remaining databases, encompassing diverse scenarios, are utilized for evaluation purposes.
The architecture for model training and validation is illustrated in Fig. 9. A thread pool of Nthread = 81 threads is established to concurrently train and validate the models, with all parameters initialized uniformly within the range of [0, 1]. Each thread operates in 2 stages: an outer loop with a maximum of ({N}_{{rm{epoch}}}^{rm{out}}=) 10,000 epochs and an inner loop with a maximum of ({N}_{{rm{epoch}}}^{rm{in}}=2000) epochs. The outer loop includes 4 steps: (a) resetting the training set through uniform random sampling, (b) validating the current model parameters, (c) updating the global model parameters based on validation accuracy, and (d) updating the current model parameters. The inner loop involves training the model with the reset training set and updating local model parameters based on the loss function ({mathcal{L}}). The “Reach the stopping criterion I” can be defined by either the total number of epochs (e.g., 2,000,000) or the count of training epochs after achieving maximum validation accuracy. The “Reach the stopping criterion II” can be set as a threshold for the cross-entropy loss function ({mathcal{L}}). Figure 9d shows the training process over 1,000,000 epochs, with the global maximum validation accuracy attained at epoch = 3889 and a training set loss of 3218.17. Figure 9e presents the training and validation results at this optimal point.
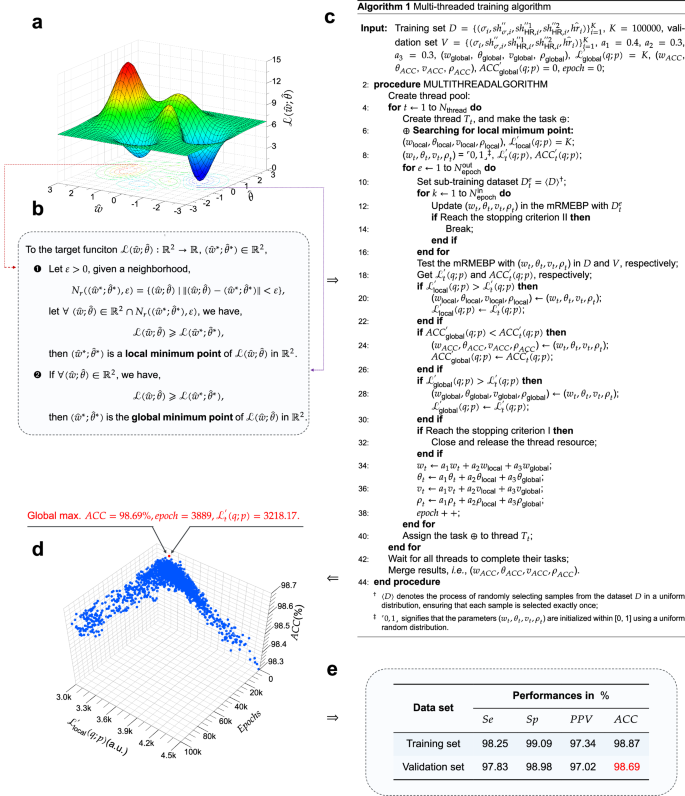
a Illustration of the cross-entropy loss function ({mathcal{L}}). b Definition of local and global minimum points. c Parallelized algorithm for model diverse optimization. d Distribution of training outcome data. e Overview of statistical validation results.
To evaluate the performance of the mRMEBP framework, the remaining dataset, which comprises LTAFDB, AFDB, MITDB, and NSRDB, is utilized for rigorous testing and comprehensive evaluation. This dataset encompasses a diverse array of scenarios, including combinations of various databases, providing a reliable platform for assessing the robustness and generalization abilities of the DL-based model in addressing practical clinical situations. The detailed findings of this evaluation are presented in the Results Section.
Summary of methodology
To our knowledge, this pilot study represents a novel integration of Information theory, specifically Differential entropy, Shannon entropy, Gini difference, and Symbolic dynamics, with a Fuzzy logic system to directly extract features for a NN model. This innovative approach significantly enhances our understanding of the probability distributions of statistically independent arrhythmic events, particularly in the context of AF. Additionally, we introduce a noteworthy method for concurrently training the AF classification model using diverse data sources, evaluated across 4 public ECG databases. Our model outperforms mainstream methods reported over the past decade in the literature, achieving superior results across all 4 evaluation metrics for each database. Indeed, in this study, the RRI information is exclusively utilized for feature extraction implying that the morphology of ECG waveforms remains unexplored. This choice stems from one of our primary goals: to develop a robust AF detection framework that is applicable in both clinical and non-clinical settings. In non-clinical settings, such as home healthcare, the tools for acquiring pulse rate information (corresponding to RRI) typically include portable devices such as smartphones (leveraging the built-in camera)59, smartwatches60,61, smart fitness bands, and armbands62. These devices capture Photoplethysmography waveforms rather than ECG waveforms. The innovative multi-resource training approach significantly improves the model’s adaptability and resilience to data quality and variability issues. Notably, the proposed mRMEBP framework revolutionizes AF detection through beat-to-beat automated screening, pivotal for real-time monitoring and timely intervention. This framework operates with low complexity, eschewing traditional 1D or 2D convolution operations, and efficiently computes all 5 features using recursive algorithms13,15,58. Additionally, LUT techniques are employed to expedite Sigmoid and logarithmic function calculations (see Fig. 8)63,64, rendering it a GPU-independent solution. Its compatibility with low-hardware wearable devices, facilitates accessible, on-demand AF detection based solely on the cardiac interbeat interval dynamics. This portability and accessibility are essential for promoting widespread adoption and enabling early diagnosis, considering that a significant proportion of AF patients remain undiagnosed, and a substantial number of stroke cases linked to AF lack prior diagnosis6.
Looking ahead, we foresee that the mRMEBP framework will propel the evolution of AF detectors to unprecedented precision and unparalleled robustness. Its capacity to continuously learn and adapt from a diverse spectrum of data sources holds the potential for significant enhancements in diagnostic accuracy and reliability. Furthermore, with the burgeoning availability of wearable devices, the integration of the mRMEBP framework with these platforms is anticipated to revolutionize AF management, enabling earlier interventions and markedly improving patient outcomes.

Responses