A wearable device for continuous monitoring of circulating cells at single-cell resolution

Introduction
Screening, diagnosis, and treatment for several medical conditions can be revolutionized by creating a solution for continuous, real-time monitoring of cells circulating in blood vessels. For instance, cellular therapies, such as chimeric antigen receptor (CAR) T cell therapy1, CAR macrophage therapy2, and CAR-NK cell therapy3, represent groundbreaking treatments initially developed for cancer and now also applicable to other diseases, including human immunodeficiency virus (HIV) and COVID-194. Since their respective population in circulation correlates with the prognosis of patients5,6, their continuous monitoring would allow for timely intervention to address any side effects, such as cytokine release syndrome (CRS) or low therapeutic efficacy, thereby ensuring that critical treatment windows are not missed. Similarly, circulating tumor cells (CTCs), which mainly express epithelial cell adhesion molecule (EpCAM) on its surface7, can be monitored to evaluate cancer recurrence and chemotherapeutic efficacy8. Uninterrupted monitoring of CTCs will enable a prompt response to both cancer recurrence and treatment failure in patients. Furthermore, the persistence of diminished HLA-DR expression in circulating monocytes during the first seven days of admission is linked to the subsequent occurrence of infections in intensive care unit (ICU) patients9. Continuous monitoring of circulating monocytes will allow clinicians to assess infection risks and intervene preemptively. Beyond tracking treatment response or status of patients, continuous monitoring of circulating cells can also enable disease screening and early diagnosis. For example, monitoring circulating plasma cells’ population can aid patients with smoldering multiple myeloma (SMM), who do not show any symptoms, in assessing the likelihood of progression to active disease within two years10. Also, the level of circulating neutrophils with CD64 expression serves as a sensitive marker for diagnosing sepsis and systemic infection11. Continuous, real-time monitoring of these neutrophils will enable earlier diagnosis and timely treatment of associated risks.
Circulating cells are traditionally studied by analyzing patient blood samples, often requiring enrichment to increase the fraction of target cells, particularly when they are rare. Common enrichment methods include immunoaffinity techniques, such as magnetic-activated cell sorting (MACS), and physical property-based approaches like size and density separation12. Detection is performed using either label-based or label-free methods. Label-based techniques, such as immunophenotyping and fluorescence in situ hybridization (FISH), identify target cells by their specific protein or nucleic acid markers12,13. Label-free approaches, including reverse transcription-quantitative polymerase chain reaction (RT-qPCR), dielectrophoresis (DEP), and surface-enhanced Raman spectroscopy (SERS), offer alternative strategies for detecting circulating cells13,14. However, all such methods involving blood-drawing have several drawbacks. They provide only discontinuous monitoring15, which can result in missing critical treatment windows. There is also a risk of cell degradation; for instance, CAR T-cells in drawn blood can degrade within a day after sampling16. Furthermore, these methods can over- or under-estimate the cell concentration due to the analysis of only a small volume of blood15. To address these limitations, researchers have developed the in vivo flow cytometry (IVFC) method. IVFC detects responses of circulating cells to laser illumination — such as fluorescence, absorption, scattering, photoacoustic, and photothermal effects — in targeted blood vessels17. However, the translation of IVFC for human use faces several challenges due to their transmissive configuration, and large sizes. The transmissive configuration, while usable in small animals such as mice15, is unsuitable for humans because most of the signal is absorbed or scattered by thicker tissue. The large size of these devices hinders their use for continuous monitoring in humans. To address the issues with the transmissive configuration, a reflective configuration of IVFC, called “Diffuse in-vivo Flow Cytometry” (DiFC)18,19, has been developed for monitoring circulating tumor cells. Additionally, a bench-top-sized photoacoustic IVFC device called Cytophone was invented to monitor various diseases such as melanoma and malaria by utilizing the difference in absorption coefficients between normal and abnormal cells20,21. However, both devices remain too bulky to be wearable and hence, unsuitable for continuous monitoring. Currently, as far as we know, there are no devices compact enough to be wearable that can detect circulating cells in humans. Hence, the continuous and real-time monitoring of circulating cells in blood vessels remains an unmet challenge till date.
In addition to circulating cells, extracellular vesicles (EVs) and cell-free DNA (cfDNA) have emerged as promising biomarkers for monitoring various diseases. EVs are nanoscale, heterogeneous membrane vesicles (10–2000 nm) secreted by cells, carrying DNA, RNA, and proteins derived from host cells or extracellular spaces22. Abundant in biofluids like blood and urine, EVs present a less invasive alternative to traditional biopsies for early diagnosis and prognosis23. However, their small size necessitates advanced and labor-intensive technologies, such as ultracentrifugation, which requires costly equipment and complex processing22,23. Distinguishing EVs from non-vesicular components, such as aggregated proteins or similarly sized lipoproteins, also remains a challenge22,23. cfDNA consists of short double-stranded DNA fragments released by dying cells, offering another avenue for detecting disease-associated mutations22,24. Since all dying cells release cfDNA into the bloodstream, it provides a more comprehensive view of disease heterogeneity than tissue biopsies, especially for diseases with high variability like cancer25. Its short half-life (5–150 minutes) allows for real-time patient monitoring24. However, cfDNA analysis faces challenges, including high interpatient variability and background secretion by healthy cells26. These factors reduce the specificity and sensitivity of cfDNA-based diagnostic or prognostic methods. Additionally, unavoidable delays in sample transport, aliquoting, and storage can chemically damage cfDNA, further complicating its use24. Like circulating cells, the detection of EVs and cfDNA requires blood collection, and therefore it can only provide discontinuous monitoring. Moreover, their significantly smaller size compared to cells complicates the development of devices for continuous, non-invasive, or minimally invasive monitoring. Consequently, this study focuses exclusively on developing a device for monitoring circulating cells.
Here, we introduce CircTrek, the first truly wearable device for continuous, real-time monitoring of circulating fluorescently labeled cells with single-cell resolution (Fig. 1). By harnessing the wide range of in vitro and in vivo cell labeling techniques approved for humans15,27,28, CircTrek can readily be adopted for medical diagnostics and therapeutics. The unprecedented sensitivity in a wearable form factor has been achieved through custom design and optimization of all system components, spanning electrical circuits, optomechanical components, signal modulation, and post-processing. All the required subcircuits, including the laser driver and serial filters, were optimized to fit onto a small printed circuit board (PCB) measuring 42 mm × 35 mm. Electrical and optomechanical components were carefully selected or custom-designed to improve sensitivity and throughput while maintaining the wearable form factor, resulting in a device size of just 44 mm × 39 mm × 15.5 mm, comparable to a commercial smartwatch. CircTrek also uses focused and pulsed laser excitations to enhance the fluorescent signal and distinguish it from low-frequency biological noise, such as heartbeats. Using Cyanine5.5 NHS ester as a representative fluorescent label for cells, we have demonstrated CircTrek’s ability to detect individual circulating fluorescent cells with an average SNR of 11.9, using an experimental setup that closely emulates the pulsating blood flow in the blood vessels under human skin. The details of the device design and experiments are provided below, followed by a discussion on CircTrek’s safety assessment and effectiveness for real-world applications.

The inset shows a magnified view of the blood vessel in the dermis layer, where fluorescent cells of interest (glowing yellow cells) are circulating. These cells are detected by CircTrek. This figure is created in BioRender. Jang, K. (2025) https://BioRender.com/p33v426.
Device design
CircTrek functions as a wearable fluorescent cell detector, necessitating a light source powerful enough to stimulate the fluorescently labeled cells beneath the skin and a photodetector capable of capturing faint fluorescent signals emanating from a single cell beneath the skin’s surface. To observe circulating cells in blood vessels using CircTrek, we need to first selectively label the target cells. For applications requiring monitoring of cells injected into the patients, such as monitoring CAR T cells therapy, these cells can be labeled in vitro with fluorescent dyes or genetically modified to express fluorescent proteins prior to injection. On the other hand, for applications involving the monitoring of patient’s intrinsic cells, antibody-based fluorescent dyes can be used for in vivo staining15. Several antibody-based fluorescent dyes, including cetuximab-IRDye800CW, panitumumab-IRDye800CW, and FITC-adalimumab, have already undergone clinical translation, with more dyes currently in development27. Additionally, in vivo gene delivery method29 can be employed for selective labeling of cells of interest. CircTrek is compatible with these diverse cell labeling methodologies, whether genetic or non-genetic.
For the demonstration of our technology, we have stained the cells with a fluorescent dye. In this work, the Cyanine5.5 (Cy5.5) NHS ester dye was selected to label cells due to its excitation and emission spectra aligning with the skin tissue’s optical window (650 nm–950 nm)30. The Cy5.5 dye exhibits peak excitation and emission wavelengths at 684 nm and 710 nm, respectively. To achieve maximum excitation of the dye, a 670 nm laser diode (HL6756MG, Thorlabs) was chosen as the device’s light source. Blood vessels in the dermis layer are situated 100 to 400 micrometers beneath the skin’s surface31. Taking a conservative approach, we have designed our experimental setup to locate the fluorescent cells beneath a tissue phantom with a thickness of 400 ({rm{mu }}{rm{m}}). To increase the excitation light intensity, the laser beam is focused using suitable optics. The optical system includes a small aspheric lens (Stock #83-627, Edmund Optics) and a plano-convex lens (Stock #65-263, Edmund Optics) for collimating and focusing the laser diode light, respectively, which helps maintain the device’s compact size (Fig. 2h).
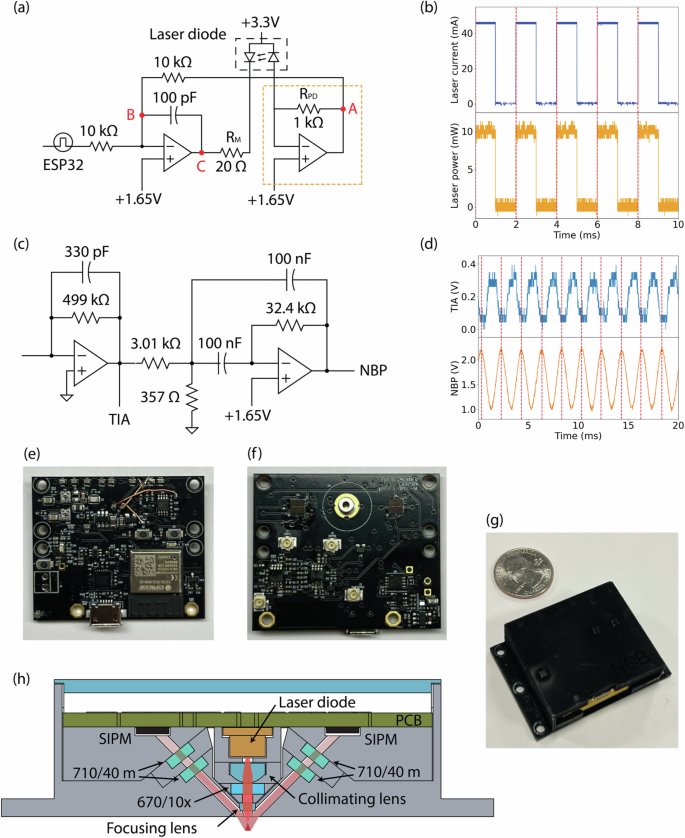
a Laser diode driver circuit. b The measured laser diode’s current and the emitted laser power from CircTrek. The laser pulses at a frequency of 500 Hz with a pulse width of 1 ms. The laser power is measured by an external photodetector (FDS010, Thorlabs). The dashed lines mark the rising edge of the laser diode current. c SiPM signal post-processing circuit, including a transimpedance amplifier (TIA) with a 1 kHz low-pass filter and a narrowband pass filter (NBP) with a center frequency of 500 Hz, a bandwidth of 100 Hz, and a gain of 5. d Fluorescent signal from a stationary cell measured after passing through TIA and NBP. Dashed lines indicate the crests in the NBP signal. Photographs of the PCB’s (e) front, (f) back sides and (g) the fully assembled device. h Schematic diagram showing the optical components of the device.
Ensuring the stability of laser power in CircTrek is crucial for avoiding false positive signals arising merely from the fluctuation of excitation power. While commercial drivers are typically used to precisely manage the current input to the laser diode, they are too large for integration with wearable devices. Thus, we have developed a compact laser diode driver circuit for CircTrek that controls the current bias to its laser, with the capability to turn the laser on and off via a microcontroller (Fig. 2a). The ESP32 microcontroller was selected for its small size which is suitable for wearable devices, and the onboard Wi-Fi module which also serves in communicating CircTrek recordings to remote devices. The laser power is stabilized using a feedback circuit, wherein a reverse-biased photodiode monitors the laser output power to create the feedback signal. A circuit, resembling a trans-impedance amplifier (orange box in Fig. 2a), converts the feedback current into a voltage signal. An increase in laser power leads to a more negative voltage at point A, causing a decrease of voltage at point B, which in turn, increases the voltage at point C. This reduces the voltage across RM, thereby decreasing the current through RM (equivalent to the laser current), maintaining constant power. Conversely, a reduction in the monitoring current triggers the opposite effect, ensuring the stability of the laser power (Supplementary Fig. 6).
A train of laser pulses at an optimal frequency was used for excitation instead of continuous illumination to receive a modulated response, so that signal processing methods could be employed to improve the signal-to-noise ratio (SNR). An operating frequency too low would make it challenging to differentiate cell-signals from biological noises inherent in the low-frequency spectrum. For example, light scattering oscillations caused by blood pulsation32,33 or slight position change of the device can potentially lead to false positive signals at a low operating frequency. Conversely, too high an operating frequency would distort laser pulse-shape due to laser diodes’ finite rise and fall times and introduce errors in the measured signal based on the sampling time. By monitoring the laser emission (using the high-speed photodetector FDS010, Thorlabs), we have measured the laser’s rise and fall times to be 23.72 ({rm{mu }}{rm{s}}) and 15.28 ({rm{mu }}{rm{s}}), respectively. Hence, we have utilized a pulse train operating at a frequency of 500 Hz with a pulse width of 1 ms for excitation, which allows us to avoid low frequency biological noises as well as maintain an undistorted square-wave excitation (Fig. 2b).
The detection of fluorescent signals from a single cell poses a significant challenge due to the inherent weakness of these signals, which further diminish upon passing through skin tissue. To adequately capture these faint signals, CircTrek’s photodetector must exhibit high sensitivity. For this purpose, a silicon photomultiplier (SiPM) was selected for its single-photon sensitivity and compact size, suitable for integration into a wearable device. A SiPM is a parallel array of avalanche diodes, necessitating a driving voltage exceeding the Zener breakdown voltage. For the specific SiPM model used in CircTrek (AFBR-S4N33C013-DS103, Broadcom), a driving voltage of -30 V was generated using a SiPM bias circuit (Supplementary Fig. 7). Despite the SiPM’s high sensitivity, the output signal requires noise filtering and signal amplification before feeding to the microcontroller’s ADC. The post-processing circuit (Fig. 2c) first converts the SiPM’s output current into a voltage signal using a transimpedance amplifier (TIA) block. A low-pass filter with a 1 kHz cutoff frequency is integrated within the TIA circuit to eliminate high-frequency noise. It must be noted that after low-pass filtering, the output signal loses its square-wave nature and appears more sinusoidal (Fig. 2d). Additionally, a multi-feedback narrow bandpass filter (NBP) with a center frequency of 500 Hz, a bandwidth of 100 Hz, and a gain of 5 is incorporated to further amplify and refine the signal. Figure 2d showcases how the NBP-enhanced signals are not only more pronounced but also exhibit reduced noise compared to the post-TIA signal. To mitigate the risk of false positive signals due to random noise from the SiPM, CircTrek incorporates two SiPM detectors. This dual-detector setup enables us to dismiss potential false positives effectively: if one detector registers a signal not detected by the other, it can be considered noise and thus ignored. Additionally, using two detectors allows for the averaging of their signals, which reduces the noise level by a factor of (sqrt{2}). Beyond the signal detection and processing circuits, CircTrek comprises additional circuits for battery management, ESP32 operation, and voltage regulation (Supplementary Fig. 7). The device’s PCB utilizes both sides (Fig. 2e, f) to minimize the overall circuit footprint, resulting in dimensions of 42 mm (times) 35 mm and affirming its suitability for wearable applications.
To counter the effects of background light, such as ambient room light or sunlight, which scatters within the skin tissue and potentially backscatters towards CircTrek’s SiPM, causing saturation or additional noise due to the SiPM’s high sensitivity, several optical strategies were employed as detailed in Fig. 2h. Firstly, two emission bandpass filters (ET 710/40 m, Chroma) with a center wavelength of 710 nm and a bandwidth of 40 nm were utilized. Using a single emission filter typically suffices to block most light outside of the band; however, an extremely small portion of light could still potentially saturate the SiPM. By employing two filters per detector, we could reduce the likelihood of such saturation. These filters, designed to reflect wavelengths outside their target range, could lose effectiveness if positioned perpendicularly to the light path due to multiple reflections. To prevent this, the filters were tilted about 6 degrees from the normal direction of the light path. The small tilt effectively counters multiple-reflections while also maintaining the close-to-normal incidence needed for the filters to be effective. The aspect ratio of the barrel was designed to be large by choosing an aperture size of 1 mm, which makes the incidence angle close to normal. Noting that the laser diode’s emission includes wavelengths other than the desired 670 nm, and that backscattered laser light could also saturate the SiPM, a laser clearing filter (ZET670/10x, Chroma) with a center wavelength of 670 nm and a bandwidth of 10 nm was integrated into the light path between the collimating lens and focusing lens. To address the challenge of background light penetration, CircTrek’s components were manufactured using a Stratasys J55 printer, which is a high-precision 3D printer. Despite the precision assembly, potential for light infiltration persisted, which could saturate the SiPM detector. A solution was found in applying Musou Black paint (Koyo Orient Japan Co., Ltd.) to CircTrek’s parts using an airbrush, which significantly enhanced the device’s resistance to unwanted light penetration. The fully assembled device, displayed in Fig. 2g, is powered by a 3.7 V, 350 mAh lithium polymer battery (1908-LP561836JU + PCM + 2WIRES50MM-ND, DigiKey), selected for its rechargeability and compact size. The final dimensions, 44 mm × 39 mm × 15.5 mm, make the device only slightly thicker than a conventional smartwatch, hence maintaining its wearability.
Detection of static cells with CircTrek
We first present a characterization of CircTrek in detecting individual static cells in an experimental setup that mimics the cells in blood vessels buried under the human skin. The focused laser used for exciting fluorescently labeled cells follows a Gaussian beam profile, which means that cells closer to the center of the laser spot receive higher power and produce higher fluorescent signal, compared to cells further away from the center of the laser spot. Thus, it becomes important to characterize the signal from individual cells as a function of their distance from the center of the laser, and in turn, determine the signal levels that can be registered as positive occurrences with a high confidence.
The experimental setup is schematically illustrated in Fig. 3a. As a test case, we have used monocytes stained with Cy5.5, which were loaded into a microslide with a channel height of 200 μm (80166, iBidi). The microslide was covered with a tissue phantom, designed to replicate the scattering and absorption characteristics of human skin tissue. The tissue phantom was constructed from natural ABS (MatterHackers) which exhibits absorption (({mu }_{a})) and reduced scattering coefficients (({mu }_{s}{prime})) similar to that of human skin18,34, by 3D-printing to dimensions of 30 mm (times) 17.5 mm (times) 0.4 mm, with measured variations in thickness between 400 μm and 420 μm. The microslide, with the affixed tissue phantom, was mounted on a slide holder, and CircTrek was positioned above the tissue phantom. The bottom of the slide holder allowed direct observation of the stained cells and CircTrek’s laser spot through a confocal microscope to accurately estimate the distance of the detected cell from the center of the laser spot. It must be noted that the confocal microscope is used here for validation purposes only and not required for the actual operation of CircTrek.
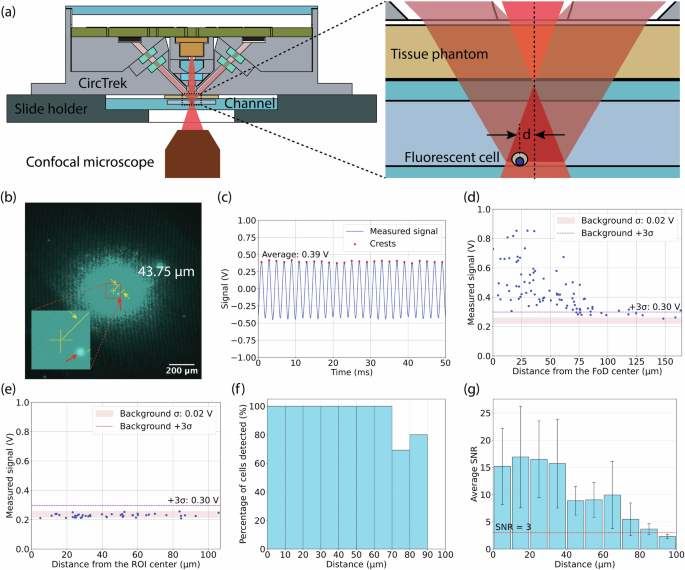
(a) Schematic of the experimental setup for detecting single fluorescent cells using CircTrek in static and flowing condition. (b) A fluorescent cell captured by Cy5.5 channel of a confocal microscope during signal measurement with CircTrek. The image was overlayed with the laser spot image captured separately. CircTrek’s field of detection (FoD) center is marked with a yellow cross, and a cell within the FoD is indicated by a red arrow. The distance from the center to the cell is 43.75 μm. The inset figure shows a zoomed-in view of the center of the FoD and the cell. (c) Measured signal by CircTrek when a cell is 43.75 μm from the FoD center. The blue line shows the average voltage signal from two different SiPM detectors, red dots highlight the peaks of the blue curve. Voltage signal measurement for cells stained with (d) Cy5.5-NHS ester and (e) FAM-maleimide, showing dependency on distance from the FoD center. The red band indicates the background signal range, defined as the mean (μ) ± standard deviation (σ). A purple dashed line marks the detection threshold, set at 3σ above the mean background noise. (f) The percentage of Cy5.5-labeled cells displaying a signal above the detection threshold is shown as a function of the distance from the center of the FoD. Each bar represents the percentage of detectable cells within a 10 μm distance range (0–10 μm, 10–20 μm, etc.) (g) Average SNR of Cy5.5-labeled cells as a function of distance from the FoD center, with each bar representing the average SNR of cells within a 10 μm range. Error bars indicate the standard deviation of SNR, and the red dashed line marks the detection threshold (SNR = 3).
The microscope was aligned with the center of the laser spot and the laser illuminated region as observed in the microscope image was ~ 140 μm in radius for a 10 ms exposure time, as shown in Fig. 3b. For each measurement, a region of the microslide was located using the confocal microscope such that only a single cell was present in the central 140 μm radius area, to ensure that CircTrek’s output corresponded to a single cell only. Then, CircTrek’s signal was recorded for a period of 200 ms (100 pulses). Measurements on any cell were limited to a maximum of two instances to prevent photobleaching. Photobleaching, however, is not a concern in real-world applications, as cells are briefly illuminated while passing under the device, with minimal likelihood of the same cell being illuminated more than twice. A DC offset correction of -1.65 V was applied to all the measured sinusoidal signals and the average of signal peaks was extracted as shown in Fig. 3c. The background signal was estimated by recording the CircTrek signal for ten different regions of the microslide where no cells were present in the central 140 μm radius area. The mean and standard deviation of the background signal were 0.24 V and 0.02 V, respectively. The detection threshold is set at the voltage exceeding the mean background signal by three times the background standard deviation (0.3 V).
Figure 3d shows the distribution of signal recorded for individual cells against their distance from the center of the laser spot. The average signal-to-noise ratio (SNR) of cells exceeding the detection threshold is 11.9, which is high enough to clearly detect a single cell under the tissue phantom. It should be noted that SNR values vary with distance from the laser spot’s center due to the dependence of signal levels on proximity (Fig. 3g). Additionally, Fig. 3g highlights substantial variation in SNR at similar distances, attributed to differences in cell size and staining intensity. The cells produce a distinctively detectable signal, exceeding the detection threshold of 0.3 V, up to ~70 μm from the laser spot’s center (Fig. 3f, g). This study defined the field of detection (FoD) as the region where cells can be detected with over 95% accuracy. Consequently, CircTrek’s FoD is a circular area with a radius of 70 μm. To confirm that the detected signal originates from fluorescence and not simply from scattering of light from the cells, a control experiment was performed where the monocytes were stained with FAM maleimide instead of Cy5.5. This scheme ensured that the monocytes’ fluorescent signal from FAM maleimide’s was rejected by CircTrek’s optical filters and only scattered signal may be detected, while also making it possible to locate the cells using the confocal microscope’s FAM channel. It was found that the signal detected for these monocytes was indistinguishable from the background signal level (Fig. 3e), corroborating that the signal detected by CircTrek comes from fluorescence and not scattering.
Detection of flowing cells with CircTrek
To evaluate CircTrek’s efficacy in detecting flowing cells within blood vessels, the experimental setup discussed in Fig. 3a was modified by connecting the microslide to a perfusion pump (60319131616, Bioptechs) to simulate the circulation of cells. A pulse-like motion was incorporated in circulating the cells, which allowed close replication of cell dynamics in the vasculatures. The average cell flow speeds were set at 2.5 mm/s, 3.75 mm/s, and 5 mm/s, aligning with the range of blood flow rate in human blood vessels18,35. During the experiment, the pump was kept on continuously to prevent the sedimentation of stained cells, which could alter the signal detected by CircTrek.
Each measurement involved simultaneously recording the CircTrek signal and capturing a video of the flowing cells using a confocal microscope for 25 seconds. The video recorded using the confocal microscope is used to verify that the signal detected by CircTrek corresponds to a cell flowing through its FoD. The confocal microscope is used here only for validation and is not needed for actual operation of CircTrek. Given that both the recordings were performed simultaneously, the intense laser light from CircTrek could overshadow the fluorescence of Cy5.5-stained cells in the confocal microscope, rendering the cells unobservable under the Cy5.5 channel. To circumvent this issue, the cells were co-stained with Cy5.5 NHS ester and FAM maleimide dyes. Again, co-staining is not required for real-world applications, as it is only necessary for observing cells under the confocal microscope. As a result of dual staining, the cells could be viewed in the confocal microscope’s FAM channel, with minimal crosstalk signal picked up from CircTrek’s laser. When detecting flowing cells, it is also important to note that the series of electrical filters used in the device for signal processing introduce a delay in detecting signal changes. Consequently, the signal from flowing fluorescent cells depends on the time each cell spends within the FoD of CircTrek. Thus, the detected signal is dependent on the speed of the flowing cell and its exact trajectory. Cells flowing slower (faster) would spend a longer (shorter) time in CircTrek’s FoD and produce a stronger (weaker) detected signal. Similarly, assuming a linear cell flow path, the duration a cell spends within the circular FoD decreases if the cell’s path is further away from the center, thereby reducing the signal level. These effects necessitate reevaluation of the FoD for experiments involving flowing cells, so that the videos from the confocal microscope can be accurately compared against signals recorded by CircTrek. To guarantee that signals from flowing cells retain at least 95% of the signal strength of static cells, a FoD was recalculated (Supplementary Fig. 8) as a circle with a reduced radius of 41.9 μm.
Figure 4a displays three consecutive snapshots (1i, 2i, 3i) captured by the confocal microscope and the corresponding recording window from CircTrek (1ii, 2ii, 3ii). A distinct spike in CircTrek’s signal is evident when the cell is seen passing its FoD in the microscope’s snapshot. Due to the movement of cells during the confocal microscope’s exposure time, they appear elongated in the captured images. However, not all cells are in motion in this setup; cells near the top or bottom slides are captured by the slides and become stationary due to their slow flow speed. These stationary cells retain a circular appearance, reflecting the absence of motion. The precise location of each cell was determined by considering the center point, which is highlighted with a yellow arrow in the images. A representative measurement (~25 second long) of CircTrek is presented in Fig. 4c. Valid peaks were identified and tallied from the recordings by extracting signal crests and selecting peaks that were significantly different from the background (({rm{SNR}}ge 10)). The corresponding video recordings were also examined, and the number of cells seen passing through CircTrek’s FoD were counted. The comparison shown in Fig. 4d between manual video counts and CircTrek’s cell counts shows a good agreement, proving CircTrek’s ability to reliably detect single fluorescent circulating cells. We do, in general observe that CircTrek’s cell counts are slightly higher. This discrepancy arises primarily because the FoD used in examining the video recordings (41.9 μm) is a lower limit of the actual FoD (Supplementary Fig. 8). Due to variations in cell speed and signal intensity, some cells moving slower than the speed used for calculating the new FoD can exhibit significant signals even when seen to be passing outside the FoD in the videos. Furthermore, differences in signal strength among cells mean that those with particularly high signals can be detected beyond the designated FoD (Supplementary Fig. 9). The variation in staining intensity between dyes also plays a role. Cells barely visible due to low FAM signal strength might still be highly detectable by CircTrek due to stronger Cy5.5 staining. Control tests conducted with cells stained only with FAM maleimide, shown in Fig. 4b and represented by black dots in Fig. 4d, confirmed that signals detected by CircTrek originate from Cy5.5 fluorescence and not merely from the scattering of light by flowing cells.
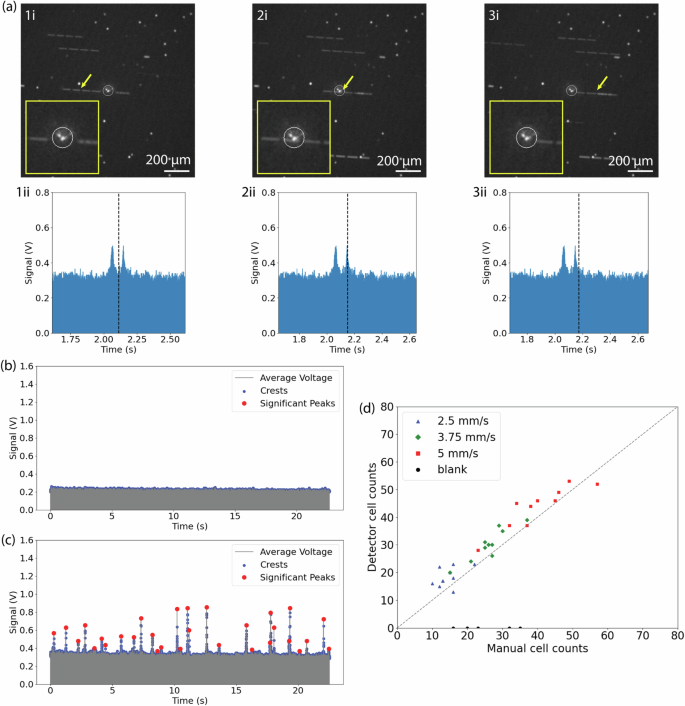
a Three consecutive snapshots of a flowing cell captured by the FAM channel of a confocal microscope (top: 1i, 2i, 3i) alongside corresponding signals detected by CircTrek (bottom: 1ii, 2ii, 3ii). The timing of each snapshot (1i, 2i, 3i) is marked with a dashed line on the bottom corresponding graphs (1ii, 2ii, 3ii), with the position of the cell causing the signal peak indicated by a yellow arrow in the top figures. The white circle in each snapshot is the field of detection (FoD) of CircTrek. Magnified views of the FoD regions are shown as insets in the snapshots (1i, 2i, 3i). Long white segmented lines and white dots in the snapshots represent flowing and stationary cells, respectively. The white spot in the center of the FoD is due to the excitation laser spot from CircTrek. b CircTrek-measured signals of cells stained solely with FAM-maleimide. c CircTrek-measured signals for cells stained with both Cy5.5-NHS ester and FAM-maleimide. In (b) and (c), gray points indicate the average voltage signal from two SiPM detectors, blue dots highlight the oscillating signal crests, and red points identify peaks attributed to fluorescent cells. d A comparison of manual cell counts from captured videos against corresponding CircTrek counts, over a period of ~25 s. Cells stained with Cy5.5-NHS ester and FAM-maleimide, moving at average speeds of 2.5 mm/s, 3.75 mm/s, and 5 mm/s, are depicted as blue triangles, green diamonds, and red squares, respectively. Cells stained only with FAM-maleimide at 5 mm/s are shown as black circles. A dashed guideline represents a hypothetical line where the manual and CircTrek counts are equal.
Discussion
Having presented CircTrek’s efficacy in detecting flowing fluorescent cells with single-cell precision, we now discuss our assessment of the device’s safety and reliability for human use. CircTrek utilizes focused light instead of collimated light to compensate for the light dissipation due to scattering and absorption in skin tissue. While focused light significantly enhances intensity at the focal point and thereby the fluorescent signal emitted by the dye, it also poses potential tissue damage risks, necessitating safety considerations. However, current laser safety standards, such as ANSI Z136.136 and IEC60825-137, primarily address collimated light, making them inapplicable to our scenario. Therefore, we have systematically evaluated CircTrek’s safety, as detailed in Supplementary Note 1. Laser injuries can be induced through three primary mechanisms: photothermal, photochemical, and photomechanical38. In this study, we focus on the photothermal effects, as the photochemical and photomechanical mechanisms are irrelevant under our experimental conditions; photochemical effects occur with wavelengths below 400 nm and photomechanical effects arise when the laser pulse width is shorter than 1 μs38. The photothermal safety of the CircTrek device has been evaluated in this work, using experimentally validated Monte Carlo and heat transfer simulations. The focused laser beam’s profile was determined using a confocal microscope, with the data analyzed via the laserbeamsize39 Python library. Key measured parameters included the beam spot size at the focal plane (43.178 μm), beam divergence (241.31 mrad), Rayleigh distance (179 μm), and the beam quality (({{rm{M}}}^{2})) factor (12.2) (Supplementary Fig. 1). These measurements were then adjusted for skin tissue applications considering the refractive index of skin (n = 1.440) (Supplementary Fig. 2). Adjusted parameters were then used in the Monte Carlo simulations41 to calculate the fluence of focused light in skin (Supplementary Fig. 3). The fluence data served as input for a finite difference method (FDM)-based heat transfer simulation42, which predicted the temperature rise due to laser exposure (Supplementary Fig. 4). The simulations indicated that a laser power of 5.5 mW, the power level used in CircTrek (Supplementary Fig. 6), would lead to a maximum temperature increase of 1.51°C near the skin surface region. Considering the skin temperature of 37 °C, the temperature will still be well below the critical threshold of 44°C43 necessary to induce thermal damage in tissue. The validity of both the Monte Carlo and heat transfer simulations was experimentally confirmed by measuring temperature changes in porcine skin tissue illuminated by collimated laser light (Supplementary Fig. 5). This comprehensive analysis confirms the photothermal safety of the CircTrek device under the tested conditions. Further safety assessment details are available in Supplementary Note 1.
In addition to safety concerns, focused light also reduces the field of detection (FoD). For CircTrek, the FoD for flowing cells was determined to be a circle with a radius of 41.9 μm. Due to the small FoD, it is necessary to verify whether CircTrek can always include at least one blood vessel within its FoD. Assuming the blood vessel network in the dermis layer is a random set of lines with a line density, ({mu }_{l}), defined as the average length of lines per unit area, and that the thickness of the lines, (t), is uniform, we model the vessel network using a Poisson line process (PLP). PLP is a random collection of lines in a 2D plane and can be one-to-one matched to a Poisson point process (PPP) in two-dimensional space44. Setting the origin as the center of the FoD of CircTrek, the problem simplifies to determining the probability that a disc with radius (r) intersects at least one line generated by a PLP with line density ({mu }_{l}). Initially, ignoring line thickness ((t=0)), the probability is given by44:
However, since the line thickness of the blood vessel network ((t)) is nonzero, the net effect of this thickness is an increase in the disc’s radius by (t)/2. Therefore, the probability becomes:
According to Wang-Evers et al., the length of blood vessels per unit area and the thickness of blood vessels are 12.3 mm/mm² and 22.3 μm, respectively, as measured by histology methods45. Substituting these parameters into Eq. (2), the probability of the disc containing at least one blood vessel is 72.9%, which is promising. Future work can involve increasing the FoD through the simple solution of raising the laser power. Since the temperature increase due to the laser remains well below the safety limit, adjusting the power can enlarge the FoD while keeping the device safe to use. If the diameter of the FoD doubles, the probability increases to 90.3%, and if the FoD exceeds a circle with a radius of 180 μm, the probability surpasses 99%.
The detection frequency of target circulating cells is also an important factor for CircTrek. Assuming the vascular network can be modeled as a line network created by a Poisson line process (PLP), the average number of blood vessels ((mu)) in the FoD of CircTrek is as follows46:
Assuming an average blood speed ((v)) of 1 mm/s35, the observed volume ((V)) by CircTrek is given by:
where (T) is the measurement time. The observed volume per unit time is then:
Assuming (N) infused target cells are homogeneously distributed in the blood with a total volume of ({V}_{B}), the detection frequency ((f)) of circulating target cells can be calculated as follows:
Here, we calculate the detection frequency of CAR T cells as an example. According to Fischer et al., a median number of 430 × 10⁶ CAR T cells are infused in patients, and the number of CAR T cells initially expands in the patient’s body, followed by contraction and persistence stages47. The initial expansion of CAR T cells is correlated with cytokine release syndrome (CRS), and the persistence of CAR T cells is highly correlated with long-term disease-free survival47. Assuming 430 × 10⁶ CAR T cells are infused and homogeneously distributed in the total blood volume of 5 L, the detection frequency of CAR T cells is 0.044 cells/s, meaning approximately one CAR T cell is detected every 23 seconds. The detection frequency of other cell types can be similarly calculated and is proportional to the cell population in the blood. Monitoring detection frequency allows real-time tracking of in vivo cell dynamics, providing critical insights into treatment prognosis. For example, a higher detection frequency of CAR T cells during the persistence phase indicates a larger CAR T cell population, which is associated with better outcomes in B-cell lymphoma patients.
CircTrek can be readily adapted for various clinical applications, by tailoring the design to handle desired excitation and emission wavelengths for target fluorescent proteins. For monitoring the in vivo dynamics of CAR T cells, genes encoding near-infrared fluorescent proteins (e.g., iRFP71348 and miRFP72049) can be incorporated during the lentiviral transduction of CAR genes. Since the excitation and emission wavelengths of these fluorescent proteins differ from those used in this study, appropriate excitation/emission filters, laser clearing filters, and laser diodes must be selected. For instance, when using iRFP713 as a fluorescent marker, an excitation filter centered at 690 nm, a 690 nm laser diode, and a 690 nm laser clearing filter are required. The same emission filters used in this study can be utilized, as the emission peak of iRFP713 is 713 nm. The described methods are not limited to CAR T cells but can also be used to monitor other engineered cells, such as CAR macrophages and CAR-NK cells, injected into humans. To detect circulating cells inside the body—such as circulating tumor cells (CTCs) for metastasis detection and neutrophils for sepsis monitoring—two approaches can be utilized: in vivo gene delivery or in vivo staining with clinically approved fluorescent dyes. First, viruses can be engineered to deliver genes encoding near-infrared fluorescent proteins to target cells based on unique surface markers. For example, EpCAM-targeting viruses can selectively deliver fluorescent protein genes to CTCs, as EpCAM is a common surface marker for CTCs50. Detailed methods for designing such viruses are described in the works of Hamilton et al. and Yu et al. 29,51. Although the injection of engineered viruses is not yet FDA-approved, this approach could facilitate the labeling of specific cell types in vivo with fluorescent proteins. Second, antibodies conjugated to clinically approved fluorescent dyes, such as IRDye800CW, can be used to selectively target cells of interest. IRDye800CW, a near-infrared fluorescent dye, is often conjugated with antibodies, some of which are already FDA-approved27. While new FDA approval would be required for conjugating new antibodies to these dyes, the approval likelihood is high when using dyes already established in clinical settings. Both in vivo gene delivery and in vivo staining offer promising strategies for selectively labeling cells of interest. However, challenges remain, including ensuring safety and obtaining FDA approval, as well as optimizing the dosage and number of injections to minimize false signals and ensure specificity. Addressing these challenges in future studies will be critical for advancing these techniques.
While we have evaluated the translational potential of CircTrek with regard to safety, blood vessel coverage, and detection frequency, several challenges related to the device must be addressed to facilitate its successful application in humans. First, while we demonstrated single-cell sensitivity, the device’s performance in the presence of autofluorescence remains untested. Autofluorescence from fixed cells, such as tissue, could increase the background signal level but is not expected to compromise the SNR. However, autofluorescence from moving cells, such as erythrocytes or lymphocytes, could produce false signals if its intensity matches that of fluorescently labeled cells. To address this, future in vivo studies using mice are necessary to evaluate CircTrek’s ability to distinguish labeled cells from autofluorescent cells. Second, CircTrek relies on fluorescent labeling to detect target cells. As discussed earlier, in vitro labeling, genetic modification, antibody-based fluorescent dyes for in vivo use, or in vivo gene delivery methods are potential labeling strategies. However, this additional staining step introduces regulatory hurdles for human applications, potentially delaying its clinical adoption. An alternative approach could involve label-free detection methods that identify intrinsic cell characteristics, such as scattering or Raman spectroscopic fingerprints17. Yet, these methods are limited in scope, as only a small subset of cell types exhibit unique intrinsic properties. Therefore, despite requiring an additional labeling step, CircTrek remains an attractive option for detecting cells lacking distinctive intrinsic features.
We have successfully developed and demonstrated CircTrek, a wearable fluorescent cell detector capable of continuously monitoring circulating cells. The size of the entire device is only 44 mm (times) 39 mm (times) 15.5 mm, making it comparable in size to a commercial smartwatch. To our knowledge, this is the smallest device designed for monitoring cell circulating in the body and represents the first truly wearable device for circulating fluorescent cells detection. CircTrek can successfully detect both single stationary and flowing cells under the tissue phantom mimicking conditions required for real-time monitoring in humans. Although we stained cells with Cyanine5.5 NHS ester as an example, any in vivo or in vitro staining methods approved for human use can be employed. The comparison between the cell counts from CircTrek and manual counting provides strong evidence that CircTrek can be reliably used in monitoring circulating cells in humans. Discussions on safety, blood vessel coverage, and the detection frequency of circulating cells further validate CircTrek’s potential for human use, although challenges such as autofluorescence remain to be addressed for future clinical translation. While CircTrek necessitates additional fluorescent labeling steps, it offers flexibility in targeting diverse cell types using approved staining methods, making it a valuable complement to label-free detection techniques, which are limited to specific cell types. Overall, CircTrek is an unprecedented tool for continuous real-time monitoring of circulating cells that can open up new avenues in medical screening, diagnosis, and prognosis tracking.
Methods
Cell culture
Monocytes (Wehi 265.1, ATCC) were used throughout the study. Cells were cultured in Dulbecco’s Modified Eagle’s Medium (DMEM, ATCC) supplemented with 10% fetal bovine serum (FBS, Sigma-Aldrich) and 1% penicillin-streptomycin (P/S, Sigma-Aldrich). Cultures were maintained by passaging every 2-3 days using the following procedure: cells in media were collected from T75 flasks (Fisherbrand™ Surface Treated Sterile Tissue Culture Flasks with Vented Cap, Fisher Scientific), transferred to 15 mL centrifuge tubes, and centrifuged at 300 x g for 3 minutes. The supernatant was removed, and the cell pellet was resuspended in 5 mL of fresh media. Cell viability and counts were measured routinely, and 2–3 million live cells were resuspended in 15-16 mL of fresh media in T75 flasks.
CircTrek programming
For all experiments, CircTrek was programmed to make laser pulse train with the frequency of 500 Hz and the pulse width of 1 millisecond.
Static cell detection
Cell staining
Cells were stained using Cyanine5.5 NHS ester (Cy5.5, Lumiprobe) for static cell detection. Initially, Cy5.5 powder was dissolved in sterile dimethyl sulfoxide (DMSO, ATCC) to prepare a 50 mM stock solution. This solution was stored at -20°C and thawed prior to use. For staining, 5 µL of the 50 mM Cy5.5 stock was added to 1 mL of cell media (DMEM with 10% of FBS and 1% of P/S) containing two million cells in 24 well plates. This mixture was pipet-mixed 20 times and then incubated at 37°C for 1 hour. Following incubation, the cell-media mixture was diluted with 4 mL of pre-warmed (37°C) phosphate buffered saline (PBS, ThermoFisher) and centrifuged at 300 xg for 3 minutes. The supernatant was discarded, and the cell pellet was resuspended in 5 mL of PBS. This washing step was repeated three times. After the final wash, the supernatant was removed, and the cells were resuspended in 1 mL of FluoroBrite™ DMEM (FBDMEM, ThermoFisher). Cell concentration and viability were assessed, and cells with viability above 90% were used in further experiments. For effective static cell detection, the stained cell suspension was diluted to a final concentration of ({10}^{4}) cells/mL to facilitate single-cell analysis and prevent overcrowding.
For the control experiments, cells were stained using FAM maleimide (FAM, Lumiprobe). FAM powder was dissolved in sterile dimethyl sulfoxide (DMSO) to create a 50 mM stock solution. This solution was then stored at −20°C. Staining was performed by adding 10 µL of the 50 mM FAM stock solution to 1 mL of PBS containing two million cells, which were placed in a 24-well plate. The cell-solution mixture was pipet-mixed 20 times and then incubated at 37°C for 2 hours. The subsequent procedures followed were identical to those used for Cy5.5 staining.
Detection
150 µL of cell solution at a concentration of ({10}^{4}) cells/mL was injected into the microslide (µ-Slide I Luer, 80166, iBidi). Both the inlet and outlet of the channel were sealed with parafilm. The microslide was then inverted and left undisturbed for at least 15 minutes to allow cells to sediment towards the upper side of the channel. A 0.4 mm thick natural ABS tissue phantom (MatterHackers) was affixed over the cover glass side of the microslide using tape. A custom-designed holder was designed to secure the microslide and to mount CircTrek. The final assembly is shown in Fig. 3a. This assembly was then fixed onto the stage of a confocal microscope (Nikon Eclipse Ts2 FL Inverted Diascopic Epi-Fluorescence Microscope) using tape. CircTrek was connected to an oscilloscope (PicoScope 2406B, Pico Technology) for signal measurement and was continuously charged during the process. Imaging was conducted using the Cyanine5.5 (Cy5.5) channel of the confocal microscope with a 4x objective lens. Also, the exposure time of 10 ms was used. The optimal axial position for detection was determined by locating the plane where the cells exhibited maximum brightness. Once the axial position was established, the CircTrek was turned on, and its laser spot was aligned with the center of the microscope’s field of view. Additionally, the boundary of the visible laser spot was marked in the microscope’s software (NIS-Elements AR, Nikon Instruments Inc) to limit the number of cells observed by CircTrek to one or zero (laser illuminated region). Then, the CircTrek was turned off and the microslide was manually shifted to align only a single cell within this boundary. The distance from the cell to the center was measured using the microscope’s software functions. Fluorescent cell signal measurements were taken by turning on the CircTrek, which recorded the cell’s signal for approximately 200 ms. During this measurement, the confocal microscope was turned off. To minimize the risk of signal degradation from photobleaching, no cell was measured more than twice. Background signals were assessed using the same methodology but by focusing on areas within the laser spot boundary that were devoid of cells. The background signals were measured from ten different regions. For the control experiment with FAM maleimide staining, exactly the same procedure was repeated. However, the FAM channel instead of the Cy5.5 channel was used, and the background signals were measured from five different regions.
Signal processing and analysis
CircTrek operates by emitting laser pulses at a frequency of 500 Hz with a pulse width of 1 ms. The signals detected by the silicon photomultipliers (SiPMs) are inherently oscillatory due to this pulsing action. To analyze these signals, we first identified the crests of the oscillations using the ‘find_peaks‘ function from the SciPy library. The parameters for peak detection were set as follows: prominence at 0.1, minimum peak distance at 100 data points, and minimum peak height at half of the maximum signal observed in the dataset. For each measurement, the crests from the signals recorded by the two SiPMs were averaged to determine the average fluorescent signal from the cells. To quantify the background signals, the same peak detection and averaging process was applied. The mean and standard deviation of these background signal averages were then computed.
Flowing cell detection
Cell staining
Cells were stained using Cyanine5.5 NHS ester (Cy5.5) and FAM maleimide (FAM). Initially, 5 µL of 50 mM Cy5.5 stock solution was added to 1 mL of cell medium containing approximately two million cells in 24-well plates. The mixture was pipet-mixed 20 times and subsequently incubated at 37°C for one hour. After incubation, the mixture was diluted with 4 mL of pre-warmed PBS and centrifuged at 300 x g for three minutes. The supernatant was discarded, and the cell pellet was resuspended in 5 mL of PBS. This washing step was performed three times to remove all unbound dye completely. Following the final wash, the cells were resuspended in 1 mL of PBS in 24-well plates and 10 µL of the 50 mM FAM stock solution was added. The cell-dye mixture was pipet-mixed 20 times and then incubated at 37°C for two hours. The cells underwent the same washing procedure three times and were finally resuspended in 1 mL of FBDMEM. Then, the cell viability was assessed, and cells with viability exceeding 85% were used for subsequent experiments. The final cell suspension was diluted to a concentration of ({10}^{4}) cells/mL for detection of single flowing cells. Control experiments utilized cells stained with FAM maleimide alone, following the procedures outlined in the Static cell detection section.
Detection
A volume of 15–20 mL of cell solution at a concentration of ({10}^{4}) cells/mL was prepared in a 50 mL centrifuge tube. The solution was gently mixed with a pipette to ensure uniform cell distribution. The microslide’s inlet and outlet were connected to Tygon tubing (Tygon® ND-100-65 Medical/Surgical Tubing, VWR) using adapters (HSR52 Straight Reducer Fitting Natural Polypropylene 5/32 HB X 1/16 HB, Fresh Water Systems). The inlet tubing was then connected to a micro-perfusion pump (Micro-Perfusion Pump (Low-Flow), Bioptechs), which was connected to the cell solution via Tygon tubing. The outlet tubing was directly connected to the cell solution to establish a continuous circulation loop that included the microslide, the perfusion pump, and the 50 mL centrifuge tube containing cells. Silicone tubing with an inner diameter of 0.062” (Single Tube Pump Set (4/pk) Silicon 062” ID, Bioptechs) was used to interface the perfusion pump with the Tygon tubing. The perfusion pump was calibrated following the manufacturer’s instructions, and average flow rates of 2.5 mm/s, 3.75 mm/s, and 5 mm/s were established based on this calibration. The setup involving the CircTrek, microslide, and custom holder was assembled as previously described in the Static cell detection section (Fig. 3a). Imaging was carried out on a confocal microscope utilizing the FAM channel with a 4x objective lens. An exposure time of 10 ms was utilized for all measurements. To avoid cell attachment to the microslide channels prior to imaging, the perfusion pump was initially operated at maximum speed. The optimal axial imaging position was identified by locating the plane where flowing cells exhibited peak brightness. After locating the optimal plane, the CircTrek was turned on to center the laser spot within the field of view of the microscope. Then, the CircTrek was then turned off and the flow speed was set to 5 mm/s. The videos of the flowing cells were captured by the confocal microscope for 30 seconds. CircTrek’s signal is recorded by the oscilloscope and the recording was initiated right after the start of image capture. Approximately 1–2 seconds after beginning the recordings, the CircTrek was turned on and maintained for about 25 seconds before being turned off. Following the deactivation of the CircTrek, recording on both the oscilloscope and the confocal microscope was stopped. This process was repeated ten times for consistency and accuracy and was similarly executed for the other specified flow rates of 3.75 mm/s and 2.5 mm/s.
Data processing
Signal from CircTrek were captured by the oscilloscope and subsequently converted into CSV files. Given the baseline signal shift from 0 V to 1.65 V upon device activation, we refined the data to include only the period when the device was on. The quantification of cells detected by CircTrek starts with averaging signals from two silicon photomultiplier (SiPM) detectors. Crest points were then identified by leveraging the ‘find_peaks‘ function within the SciPy library, applying criteria of a 0.1 prominence, a minimum distance of 100 data points between peaks, and a minimum peak height of 0.2 V. For identifying and counting peaks due to cells passing CircTrek’s FoD, we re-employed ‘find_peaks‘ on these crests, selecting peaks whose height exceeded tenfold the standard deviation observed in blank measurements. The blank measurement was performed by measuring signals of flowing FBDMEM solution without cells. Peak heights were determined by offsetting the signal peaks against background signals. The background signals were established through a 0.5 s median filtering process. For video analyses, a series of frames captured by the confocal microscope were processed to isolate those acquired during active CircTrek periods. This isolation was based on brightness changes at the center region of the images, caused by excitation laser illumination in the FAM channel. In each processed frame, the FoD with a radius of 41.9 μm was delineated to assist manual cell counts. The number of cells passing through the FoD in each video was counted manually for comparison with CircTrek’s cell count.


Responses