Fully automated sample to result SIMPLE RPA microfluidic chip towards in ovo sexing application

Introduction
The killing of day-old male chicks is a widespread practice in the laying hen poultry industry. Approximately 372 million male chicks in the EU are culled upon hatching, as they neither lay eggs nor yield quality meat1. Several governments have banned male chick culling (e.g., Germany, France, and Italy)2,3, endorsing increasing consumer awareness of animal welfare issues and preventing the disadvantages for the industry (i.e., investing in a byproduct and image degradation)4. Among several solutions offered to date for solving this problem1,5, sex detection before hatching (i.e., in ovo sexing) and subsequent male embryo disposal is the preferred one by both the consumers and industry. With in ovo sexing, the incubation is stopped prior to the onset of pain perception (day 13 of incubation), while the industry avoids investing in males (i.e., male eggs can be removed from the incubator and do not require to be grown)6,7. However, in ovo sexing techniques must meet several requirements for industrialization, including: 1) compatibility with all colors of eggs, 2) high throughput ( > 20,000 eggs/hour, complying with the market’s high product demand), 3) high accuracy ( > 98%), 4) high sensitivity to be applied early in incubation, imperatively before day 13 of incubation, 5) maintaining a high hatchability rate and 6) being low cost (around 2-3 €/day-old-chick)5.
Both researchers and industry have made significant efforts to develop in ovo sexing methods that can meet these imposed requirements5. Current techniques include optical and non-optical methods5. Optical techniques employ visible near-infrared spectroscopy to distinguish the embryo’s feather colors, however, one day after the embryo’s pain perception onset (day 13 of incubation)8. Another available optical technique is magnetic resonance imaging to detect the embryo’s gonads on day 12 of incubation9, with low accuracy ( < 98%) and high cost ( > 4 €/day-old-chick). Non-optical methods currently include extracting allantoic fluid (AF) from the egg at day 9 of incubation to detect (1) a female-specific hormone (estrone sulfate) with an enzyme-linked immunosorbent assay (ELISA) that offers 98% accuracy but has a high cost ( > 4-5 €/day-old-chick)10, or (2) a male-specific metabolite11 with mass spectrometry that has only 95% accuracy12.
Recently, DNA analysis proved to be the most accurate method, as shown in our recent report using quantitative PCR (qPCR) to target the HINTW female-specific gene13. Following this approach, it is possible to detect the embryos’ sex with 100% accuracy from days 6 to 9 of incubation using a small amount of AF ( < 5 µL), while having minimal impact on embryo development (seen only when sampling AF on day 6 of incubation)13. However, despite this exceptional accuracy, qPCR is a lengthy (90 min) and expensive technique ( > 3 €/test) that involves temperature cycling, making it unsuitable for non-laboratory settings like an incubator, hence introducing interruption in the eggs’ incubation. In this context, isothermal DNA amplification techniques, such as recombinase polymerase amplification (RPA), can offer advantages for developing a desired test14. Compared to other isothermal methods such as loop-mediated isothermal amplification (LAMP) or rolling circle amplification (RCA), RPA requires only two primers, and does not require an initial denaturation temperature. Meanwhile, it can be performed at low incubation temperatures (37–42 °C) and is rapid (5–20 min)14. For instance, previous work showed that RPA can amplify Mycobacterium tuberculosis in urine samples at 37 °C, close to the temperature of the egg incubation (37.7 °C), offering high sensitivity (1 copy per sample) in less than 20 min15. Moreover, RPA can be combined with colorimetric detection methods like commercial lateral flow strips (LFSs) – which are not mainstream with PCR – thus avoiding the need for additional devices to carry out fluorescence read-out and instead generating results in an easy, practical, and rapid manner16.
Because of all these advantages, RPA has been incorporated into hand-held microfluidic platforms aiming to deliver almost “one-pot” reactions. In Liu et al. 2021, a poly(methyl methacrylate) (PMMA) device containing an LFS was built to detect SARS-CoV-2 RNA sequences with a limit of detection (LOD) of 1 copy per µL16. Other researchers developed a paper origami device to detect Salmonella enterica in food samples17 in which the RPA amplification was performed in stages controlled by the user’s consecutive folding, resulting in a limit of detection (LOD) of 6, 9 and 58 CFU/mL for lettuce, chicken breast and milk, respectively17. Despite the proven potential to perform on-chip RPA with high sensitivity, the existing devices require user intervention (e.g., inserting the correct amount of sample in the inlet, manipulating or folding the device), which makes these systems user-dependent and more prone to errors. Examples of sample-in-result-out types of microfluidic platforms that require less user manipulation have been reported, including centrifugal microfluidics18 or pump-driven devices19 that allow for complex liquid manipulations (e.g., sample mixing, RNA or DNA extraction). However, they rely on external devices (centrifuge or pumps), making them unsuitable for the point-of-care (POC). Hence, laying hen farms are still looking for new technologies that can provide fast, highly accurate but low-cost in ovo sexing tests with minimal to no disturbance of egg incubation.
In this work, we present a microfluidic-based tool, named SIMPLE-RPA chip, to perform fully autonomous RPA for detecting the synthetic female-specific HINTW gene within an incubator at 37.7 °C. To achieve this, we first establish an off-chip RPA bioassay for detecting synthetic DNA. Furthermore, we develop a SIMPLE-RPA chip, starting from our in-house developed SIMPLE (self-powered imbibing microfluidic pump by liquid encapsulation) technology. The SIMPLE is an obvious choice for the in ovo sexing application because it is a self-powered, cost-effective ( < 1€/chip) microfluidic technology that can perform complex liquid manipulations autonomously upon a single finger press activation step, while remaining small in size20,21,22 (which is crucial for the limited space in egg incubators). Finally, we implement for the first time an RPA bioassay on the SIMPLE-RPA chip with an integrated LFS for qualitative colorimetric identification of the synthetic female-specific HINTW gene on the spot without the need for external read-out devices. Due to its low cost, complete automation and user-friendliness, the presented SIMPLE-RPA chip shows great prospect for final integration with AF sampling directly from eggs in the incubator and consequently in ovo sexing on genomic DNA, as well as for applications in other fields, such as medicine, veterinary sciences and agriculture.
Results
Off-chip optimization of the RPA bioassay
Details of the experiments are shown in the Methods Section. The RPA bioassay was first optimized off-chip using 4 distinct primer concentrations (0.5, 2.5, 5 and 10 µM), while keeping the incubation time at 20 min (according to the manufacturer’s protocols23). The selection of primer concentrations was based on a previous publication by Lobato et al. 14 with suggested primer concentrations between 0.8 and 5 μM14. The primer sequences for this work were taken from our recent paper13, where they have been validated for high sensitivity and specificity towards HINTW synthetic DNA and genomic DNA (gDNA) sampled from AF at days 6 to 9 of incubation. Using the most efficient primer concentration from this first optimization step, we also tested 4 different incubation times (5, 10, 15, and 20 min). to evaluate when the amplification plateau was reached and thus to avoid incubating the samples for too long, risking primer dimer formation and non-specific amplification (as advised by the manufacturer’s manual23). The incubation temperature of 37.7 °C was selected to match the incubation temperature of an egg incubator. Synthetic DNA in IDTE buffer, matching the targeted sequence from the HINTW gene, was used at 0.01 ng/μL, which corresponded to the lowest detected concentration achieved with qPCR detection of gDNA extracted from AF in our previous work13. Non-template control (NTC) samples were added for each variation of primer concentration or incubation time, whereas all conditions were tested in triplicates. The results were visualized with LFSs (Fig. 1 and 2) and electrophoresis using a TapeStation device (Supplementary Fig. 1).

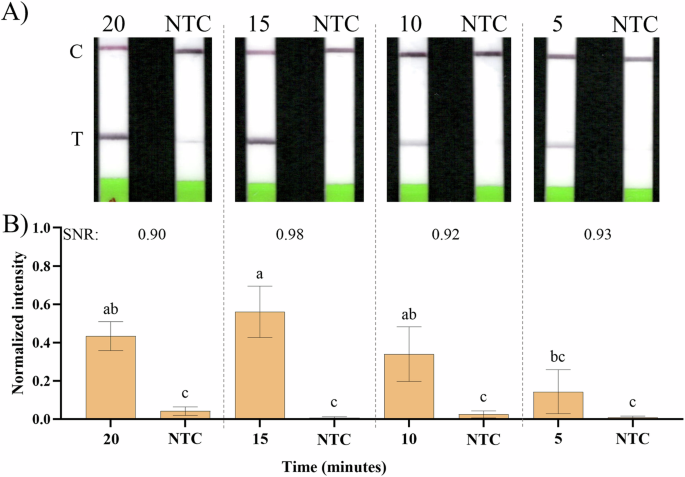
A Example of the obtained LFSs; primer concentrations of 10, 5, 2.5 and 0.5 µM, and their respective NTC controls. B Signal intensities were analyzed with ImageJ for all the different conditions and their respective NTCs, normalized between 0 and 1 and their calculated SNR, following the method explained in the Materials and methods, considering the 8-color bit image pixel maximum intensity of 255. Error bars represent one standard deviation (n ≥ 3). Statistical differences of the means analysed with one-way ANOVA, followed by Tukey’s multiple comparisons test (α = 0.05). Bars marked by different letters indicate significant differences by Tukey’s multiple comparisons test. NTC – Non-template control.
Figure 1A shows examples of the obtained LFSs for different tested primer concentrations and Fig. 1B shows the normalized intensity of the respective LFS test bands, analyzed using ImageJ. From all the tested concentrations, 0.5 μM was the only one that did not show a statistically significant difference compared to its NTC, which was also confirmed visually by the absence of a test line. Although the other three tested primer concentrations all gave statistically significant differences compared to the NTC (Tukey’s test for multiple comparisons, α = 0.05), the best signal-to-noise ratio (SNR) was obtained when using 2.5 µM (0.92), leading to the selection of this concentration as the most suitable to continue with. It is important to note that the visible NTC test lines when using 10 and 5 µM of primers (Fig. 1A) possibly resulted from primer dimers and non-specific amplification.
Starting from a selected primer concentration of 2.5 μM, we then tested different incubation times, with examples of the obtained LFSs in Fig. 2A and the normalized intensity of the respective LFS test bands, analyzed using ImageJ in Fig. 2B. For all tested incubation times, the NTCs showed minimal to no amplification. When compared to the positive samples, statistically significant differences (Tukey’s test for multiple comparisons, α = 0.05) were observed for all incubation times, except for 5 min (Fig. 2B). Although the remaining incubation times (10, 15 and 20 min) did not reveal significant statistical differences among themselves, they revealed slightly different SNR values. Therefore, we selected 15 min as a condition with the best SNR of 0.98 for the remaining benchtop and on-chip experiments, since it enables a rapid bioassay, without hindering the sensitivity. The results presented in Fig. 1 and 2 are further confirmed with obtained electrophoresis results in Supplementary Fig. 1 with examples of the used LFS in Supplementary Fig. 2.
A Example of the obtained LFSs; incubation times of 20, 15, 10 and 5 min and their respective NTC controls. B Signal intensities were analyzed with ImageJ for all the different conditions and their respective NTCs following the method explained in the Materials and methods, normalized between 0 and 1 and their SNR calculated, considering the 8-color bit image pixel maximum intensity of 255. Error bars represent one standard deviation (n ≥ 3). Statistical differences of the means analysed with one-way ANOVA, followed by Tukey’s multiple comparisons test (α = 0.05). Bars marked by different letters indicate significant differences by Tukey’s multiple comparisons test. NTC – Non-template control.
Determining the sensitivity of the off-chip RPA bioassay
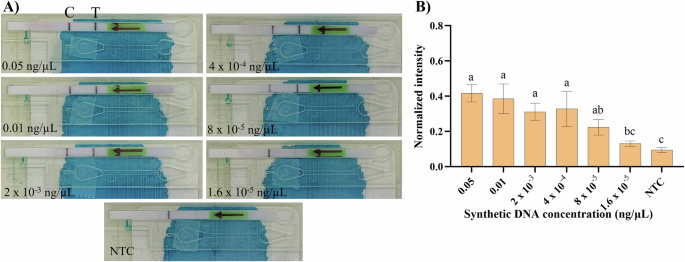
The optimized RPA bioassay for HINTW synthetic DNA detection (with 2.5 µM of forward and reverse primers and 15 min of incubation) was subsequently tested with a serial dilution of the synthetic DNA in buffer (1:5 dilution ratio between 0.05 and 1.6 × 10⁻⁵ ng/µL) and incubation at 37.7 °C using a PCR thermocycler (Fig. 3A) or an egg incubator (Fig. 3B) as the heat source (Supplementary Fig. 3 shows examples of the LFSs obtained from this experiment). For both heating conditions, amplification was achieved for all concentrations of the synthetic DNA between 0.05 and 4 x 10⁻⁴ ng/μL with no statistical differences (Fig. 3A, B; Tukey’s test for multiple comparisons, α = 0.05). Furthermore, 8 × 10⁻⁵ (Fig. 3A) and 1.6 × 10⁻⁵ (Fig. 3B) ng/μL were the two lowest concentrations that resulted in a significantly higher intensity compared to the NTC signal.
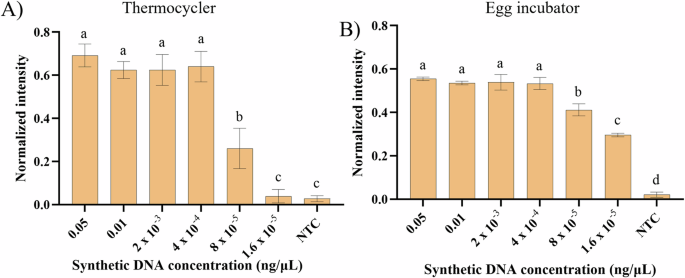
RPA amplification was achieved using A the thermocycler or B the egg incubator as the heating source at 37.7 °C. Error bars represent one standard deviation (n ≥ 3). Statistical differences of the means analysed for each distinct heating sources with one-way ANOVA, followed by Tukey’s multiple comparisons test (α = 0.05). Bars marked by different letters indicate significant differences by Tukey’s multiple comparisons test. NTC – Non-template control.
Development of the SIMPLE-RPA chip
To implement the RPA bioassay for the first time onto the SIMPLE microfluidic chip (Fig. 4), we designed a completely novel SIMPLE-RPA chip as shown in Fig. 4 (more information on the SIMPLE chip fabrication is given in the Methods Section), in which the different liquid operations are demonstrated using colored liquids (depicted in Supplementary Fig. 4 with supporting Supplementary Video 1). To tackle the needs of the laying hen poultry industry, the chip was designed with a (1) reduced size (i.e., 13 × 7 cm) and footprint complying with the limited space inside the egg incubators, (2) fully autonomous sample-to-result operation initiated with a single finger press (Figure 5–1), and hence a possibility for direct implementation within the egg incubator with low chick development disturbances, (3) low sample volume requirements (2 µL), being compatible with a limited volume of the AF sample available at the early stages of chick development, (4) low-cost SIMPLE materials ( < 1 €/chip, which includes the costs of goods for chip fabrication), compatible with scalable production methods (i.e., roll-to-roll manufacturing), to meet the high-volume testing requirements in this industrial sector, and (5) colorimetric read-out that facilitates sex detection and sorting, enabling high-throughput in ovo sexing. The cartridge is activated by a finger press, hereby, bringing the working liquid in contact with the porous filter, leading to its absorption through capillary action (Fig. 5–1).
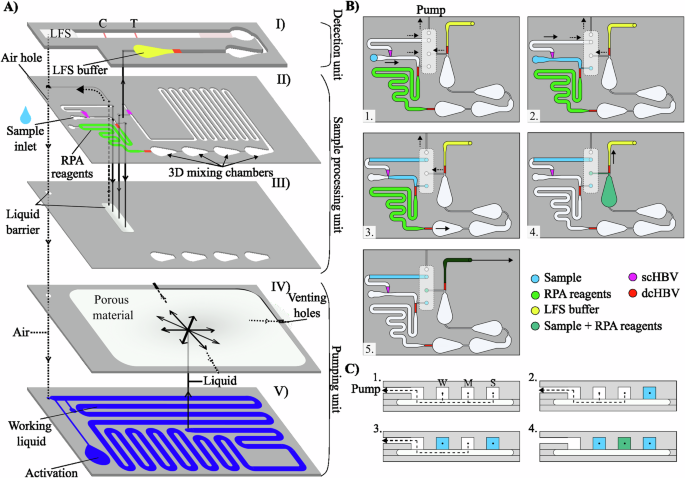
A The platform is built using layer-by-layer stacking. Distinct units were built to enable the whole bioassay, from sample metering to results’ visualizations. The detection unit (I) mixes the LFS buffer and the amplified DNA target and draws it over the LFS. The sample processing unit (II and III) contains all the microfluidic structures, channels and sc and dcHBVs (purple and red, respectively) for the various liquid manipulations (metering 1 µL of sample, merging and mixing the sample with 9 µL of RPA master mix, mixing the liquids in 3D mixing chambers and performing incubation for DNA amplification). Under the microfluidic channel structure is a layer comprising the liquid barriers (III), allowing for complex liquid manipulations. The pumping unit comprised the porous material (IV) and the working liquid (V, blue color), which is used to create a negative pressure due to capillary wicking (after finger press activation). This drives the liquids inside the connected microfluidic channels. Dashed arrows represent the direction of the airflow. Normal arrows represent the direction of the fluid flow. B, C The liquid barriers are used as switches: (1) the user inserts the sample in the inlet, whereas the RPA and LFS reagents are already prefilled in their intended positions. The system is in the initial state and the pump produces the same pressure in the three channels: W (waste), M (sample and RPA reagents mix) and S (sample). Once the platform is activated with a finger press, the (2) sample is pulled towards the RPA reagents and is stopped between a scHBV (purple) and a dcHBV (red). The metered sample blocks the liquid barrier S. (3) 1 µL is measured and the remaining goes over the scHBV to the waste channel. After blocking a second liquid barrier W, the measured sample is (4) mixed with the RPA reagents inside the 4 3D mixing chamber. Following the incubation, the RPA product merges with the LFS buffer after blocking the last liquid barrier M, and (5) flows towards the LFS. LFS – Lateral flow strip; RPA – Recombinase polymerase amplification; HBV – Hydrophobic burst valve; sc – single coated; dc – double coated. Figure was designed using Inkscape vectorial software (Version 1.3.2, Software Freedom Conservancy, USA).
Once the SIMPLE-RPA chip is activated, 1 µL of the sample is first accurately metered (Fig. 5–2). In particular, the coordinated burst action of single coated (sc) and double coated (dc) hydrophobic burst valves (HBVs; purple and red squares in Fig. 4, respectively) is used to first meter an exact sample volume in the sample channel, after which the sample excess is discarded to the waste channel. Once the sample excess reaches the liquid barrier at the end of the waste channel (V1 in Fig. 5–2), the precisely metered sample volume first blocks the liquid barrier adjacent to that channel (V2) and bursts through de dcHBV (Fig. 5–3), merging with the prefilled RPA reagents. The merged liquids proceed towards the first 3D mixing chamber (for more information on the measuring and merging systems, we refer to our previous work20). Next, the reagents and sample go through a series of 3D chambers (Figs. 5–4 and 5–5), allowing for efficient mixing due to the expansion effect24. In the first 3D chamber, the 9 µL of RPA reagents and 1 µL of sample are merged with the 0.5 µL magnesium acetate (MgOAc; 280 mM), thereby initiating the RPA reaction. Next, we optimized the time the liquids reside in the channels to match the necessary 15 min of incubation. To achieve this, one option was to increase the number of 3D mixing chambers or length of the meandering channels, which, however, increased the amount of sample loss, retained by the hydrophilic polyethylene terephthalate (PET) surface (data not shown), thus hindering the RPA reaction. Hence, to avoid altering the already optimized chip design, we introduced here a completely novel way of controlling the on-chip incubation time when using the SIMPLE microfluidic chip. By increasing the working liquid’s viscosity with the addition of Mowiol 8-88 (polyvinylalcohol; PVA), flow rates could be altered, which was very practical since the SIMPLE-RPA chip design could be kept constant throughout the experiments. The Lucas-Washburn equation25 shows the inverse proportionality between the wetted distance of a porous media over time and the liquid viscosity (Supplementary Note 1). After testing increasing concentrations of PVA in the working liquid (Supplementary Fig. 5 shows different timings considering different amounts of PVA), we observed that 4% (w/v) of PVA enabled an incubation time of approximately 15 min to match the requirements of the optimized RPA (the obtained timing can be seen in Supplementary Video 1).
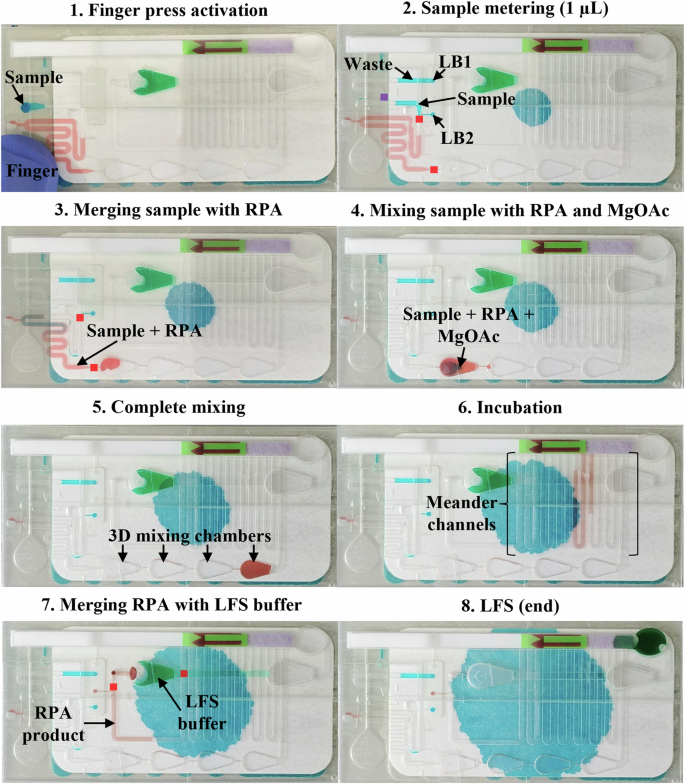
Before the start, RPA reagents (red liquid), LFS buffer (green liquid) and working liquid (blue liquid behind the SIMPLE pump) are loaded inside the chip, and the inlet holes are sealed with PSA. Then, 1) 2 µL of the sample is added to the inlet hole, and the SIMPLE-RPA chip is activated with a finger press, pushing the working liquid towards the SIMPLE pump, creating a negative pressure inside the microfluidic channels, driving the liquids. Using the liquid barriers (LB) together with the scHBVs (purple) and dcHBVs (red), it is possible to 2) measure 1 µL of the sample. Due to an increase of the pressure inside the microfluidic channels, the measured 1 µL sample is pulled over the dcHBV and 3) merged with the 9 µL RPA reagents, 4) and flowing inside the first 3D mixing chamber where the solution is combined with 0.5 µL MgOAc (RPA reaction initiator) pre-loaded in that chamber. 5 The three solutions are efficiently mixed over the four subsequent 3D mixing chambers. 6) Simultaneously, the mixed RPA reagents, sample and MgOAc are incubated. After incubation of the mixture (approximately 15 min with 4% w/v PVA in the working liquid), the amplified material is 7) merged with 40 µL LFS buffer, mixed and 8) drawn over the LFS RPA – Recombinase polymerase amplification; MgOAc – Magnesium acetate; LFS – Lateral flow strip; HBV – Hydrophobic burst valve. Images of the SIMPE-RPA platform were captured using a smartphone camera and compiled into a single figure using Microsoft PowerPoint.
Following the incubation in the 3D mixing chambers and meandering channels, the amplified DNA reached and stopped at a scHBV (which prevented the loaded LFS buffer from flowing in the microfluidic channels during prefilling). At the same time, the amplified DNA blocked the liquid barrier adjacent to the channel (Fig. 4B and Fig. 5-7). Once the last liquid barrier was blocked, the amplified DNA bridged the scHBV to merge with the 40 µL of LFS buffer (Fig. 5–7), after which it was drawn over the dummy LFS inserted within the SIMPLE-RPA chip (Fig. 5-8). Once the LFS buffer mixed with the RPA product was absorbed into the LFS sample pad, the SIMPLE pump did not exert any more pulling force on the liquid (as airflow can pass by above the liquid).
On-chip RPA integration for synthetic HINTW DNA detection
To test the SIMPLE-RPA chip performance, the previously optimized off-chip bioassay was implemented on the chip. The RPA master mix was prepared off-chip, from which 9 µL was loaded into each chip (matching the off-chip reaction volume), while 40 µL of the LFS buffer was directly inserted in the first 3D mixing chamber from the detection unit and MgOAc (0.5 µL, 280 mM) was inserted in the first 3D mixing chamber from the sample processing unit (Fig. 4). Once the reagents were loaded and the SIMPLE-RPA chip was properly sealed, the same serial dilution (as off-chip) of the HINTW synthetic DNA target in IDTE buffer was tested with the on-chip RPA in triplicate. NTC was also included by replacing the HINTW synthetic DNA with 2 µL DI water. Because our data showed that using an egg incubator as a heating source resulted in equal if not better results compared to the PCR thermocycler (Fig. 3), the chips were left inside the egg incubator until the formation of the control line and the absence of liquid in the chip. Band readout was done by the naked eye (Fig. 6A) and subsequently, the chips were removed from the incubator to complement visual read-out with the tabletop scanner for intensity of test band quantification (Fig. 6B), as described earlier.
A Real images of the SIMPLE-RPA chip after finishing the bioassay for different tested target concentrations, including the NTC. B ImageJ mean histogram analysis of the test colorimetric band from the LFSs as depicted in A. Error bars represent one standard deviation (n ≥ 3). Statistical differences of the means analysed with one-way ANOVA, followed by Tukey’s multiple comparisons test (α = 0.05). Bars marked by different letters indicate significant differences by Tukey’s multiple comparisons test. NTC – Non-template control. Images of the SIMPE-RPA platform were captured using a smartphone camera and compiled into a single figure using Microsoft PowerPoint.
Figure 6A shows images of the SIMPLE-RPA chips after the finished bioassay, revealing a relevant test band for concentrations ranging from 0.05 to 8 × 10⁻⁵ ng/µL with no statistically significant differences among each other (Fig. 6B; Tukey’s test for multiple comparisons, α = 0.05; Fig. 6B). However, a concentration of 1.6 × 10⁻⁵ ng/µL presented a dimmer band similar to the NTC, further supported by the lack of statistically significant difference between them, shown in Fig. 6B. Hence, 8 × 10⁻⁵ ng/µL was considered the LOD of the SIMPLE-RPA chip.
Discussion
Currently, in ovo sexing is the preferred solution from consumers and industry to solve male chick culling. However, for in ovo sexing technologies to be applied in the industry, strict requirements must be followed (such as compatibility with all colors of eggs, high throughput, high accuracy, high sensitivity, maintaining a high hatchability rate and low cost5), which are currently unmet. To meet these requirements, we developed a microfluidic chip integrated with an RPA bioassay, namely the SIMPLE-RPA chip that offers great prospect to be used for in ovo sexing. This innovative chip autonomously amplified the female-specific HINTW synthetic DNA within the egg incubator, possibly avoiding impact on the embryos’ development and hatchability due to a reduced incubation disturbance. Although this complete sample-in-result-out workflow was achieved by using HINTW synthetic DNA in IDTE buffer, by further optimizing the RPA bioassay for detection of HINTW gene directly in the AF sample, this technology can be used for male embryo detection in laying hen hatcheries. As it was proven in our recent work13, HINTW in the gDNA extracted from AF of embryos incubated between days 6 and 9 allowed distinguishing the sexes with 100% accuracy.
The RPA bioassay was first optimized off-chip using a PCR thermocycler at 37.7 °C (same temperature as in an egg incubator) for primer concentration (0.5, 2.5, 5 and 10 µM) and incubation time (10, 15 and 20 min). The primer sequences for this work (Table 1) were validated in our recent paper13 for high sensitivity and specificity towards HINTW synthetic DNA and gDNA in AF. Moreover, following manufacturer advice, the incubation time was optimized to confirm the amplification plateau, while avoiding primer dimer formation and non-specific amplification23. Primer concentration optimization showed that 2.5 µM gave the most optimal SNR (0.92; Fig. 1) even though the other two tested primer concentrations also gave statistically significant differences compared to the NTC (Tukey’s test for multiple comparisons, α = 0.05). However, because of clearly visible NTC test lines when using 10 and 5 µM of primers (Fig. 1A), which possibly resulted from primer dimers and non-specific amplification, these primer concentrations were not selected for further experiments. By using 2.5 µM primer concentration, from all tested incubation times, 15 min provided the best SNR (0.98; Fig. 2B) and was used for the remaining benchtop and on-chip experiments.
Using 2.5 µM primer concentration and 15 min incubation time optimized with off-chip RPA bioassay, we next studied the assay’s sensitivity by implementing a serial dilution of the synthetic target (1:5 dilution ratio between 0.05 and 1.6 x 10⁻⁵ ng/µL in buffer; Fig. 3). In this study, we tested egg incubator as a heat source and benchmarked it with the thermocycler. Although we observed the differences in the LOD values when using the PCR thermocycler (8 × 10⁻⁵ ng/µL; Fig. 3A) or the egg incubator (1.6 × 10⁻⁵ ng/µL; Fig. 3B), the fact that the latter gave a lower LOD was perceived as positive when taking into account the final application of the SIMPLE-RPA chip. Moreover, our previous work demonstrated that the acquired LOD of 1.6 x 10⁻⁵ ng/μL is sufficient for detecting the HINTW gene in real extracted gDNA13. While possible causes for the observed differences in the LOD values might be either different efficiency in heat transfer or differences in controlling incubation time (automatic time control in the thermocycler vs. a hand-held timer for the egg incubator), some preventing measures were already taken during the experiments, such as using ice for fast cooling after RPA incubation inside the egg incubator as well as fast handling of samples. Moreover, possible contamination from existing sequences in the used equipment were prevented by proper cleaning practices and handling of samples/equipment.
Before integrating the optimized RPA bioassay in the SIMPLE chip, the latter was developed and optimized (Fig. 4). First, the SIMPLE chip was designed matching the off-chip RPA bioassay incubation time (15 min; Fig. 2). In this context, we first increased the number of 3D mixing chambers or length of the meandering channels, which, however, enlarged sample loss (retained by the hydrophilic PET surface, data not shown), thus hindering the RPA reaction. Hence, to avoid altering the already optimized chip design, we introduced here a completely novel way of controlling the on-chip incubation time when using the SIMPLE microfluidic chip. By increasing the working liquid’s viscosity with the addition of PVA, flow rates could be altered following the Lucas-Washburn equation26, which shows the inverse proportionality between the wetted distance of a porous media over time and the liquid viscosity (Supplementary Note 1). This method proved very practical since the SIMPLE-RPA chip design could be kept constant throughout the experiments. Finally, the four 3D chambers and the presented length of meandering channels, used for the incubation of the mixture, were adequate to reach 15 min of incubation with the SIMPLE-RPA chip and to have a fully mixed solution with a homogenous color at the fourth 3D mixing chamber, as shown in Figs. 5–6 (for more information on the measuring and merging systems, we refer to our previous work20).
The off-chip optimized bioassay (Fig. 3) was subsequently integrated with the developed SIMPLE chip (Fig. 4). The SIMPLE-RPA was activated and incubated for 30 min inside the egg incubator at 37.7 °C (Fig. 6) since our data showed that using an egg incubator as a heating source resulted in equal if not better results compared to the PCR thermocycler (Fig. 3). The SIMPLE-RPA inside the egg incubator resulted in a 8 × 10⁻⁵ ng/µL LOD (Fig. 6B), which was the same for the off-chip RPA when using PCR thermocycler (Fig. 3A) but slightly higher compared to the egg incubator as a heating source (Fig. 3B). In this context, it is relevant to note that PET transparency allowed for non-obstructed visualization of the band by a human user or a camera.
The presented SIMPLE-RPA chip allowed for fully autonomous on-chip implementation of the RPA assay without user dependency, hence drastically reducing user error risk, in less than 30 min and with a decreased risk of contamination from the environment and cross-contamination due to the closed system. In this context, proper sealing of all the microfluidic structures was one of the biggest challenges. Because of the manual fabrication, slight differences (e.g., differences in metered samples) were sometimes observed, which, however, did not drastically influence the results (e.g., bioassay time or intensity of the bands) and can be further prevented by automating the chip fabrication process. Importantly, the SIMPLE-RPA chip also allowed MgOAc simple storage and addition only after the sample was introduced (in the first 3D mixing chamber of the chip). This enabled accurate control over the start of the RPA reaction, avoiding false positives or unwanted amplification, contrary to what has been observed in RPA implementation in other platforms17, where this step required extra handling, thereby increasing the complexity of the devices. Further, the SIMPLE-RPA chip allowed for simultaneous incubation and mixing of sample, RPA master mix and MgOAc, which has been proven to increase the sensitivity in previous reports14,27.
The presented SIMPLE-RPA chip has a small footprint, is built with low-cost materials, and can be produced in large numbers in an automated fashion. Moreover, the choice of RPA as an amplification method offers high sensitivity and specificity for target detection, while also allowing for an integrated colorimetric read-out with an LFS, thus enabling easy results interpretation by the naked eye, which is more practical than fluorescence-based alternatives. RPA also provides the possibility of lyophilization17 for improved shelf life. As such, this kind of technology can be easily integrated into the hatcheries, as seen in Respeggt, GmbH28 or In Ovo, B.V.12, where automated lines for sampling and testing AF samples were implemented. However, for a fully integrated solution, further advancements are expected, such as sample extraction and processing, as well as touchless activation outside the incubators, allowing for an even greater degree of autonomy, thus bringing huge advantages to the field of in ovo sexing and autonomous POC devices29. In addition, important improvements are expected in providing LFSs and RPA assay components by commercial suppliers at more competitive prices or through in-house production.
Although the presented SIMPLE-RPA chip has been developed for in ovo sexing application, by simply changing the primers in the RPA reaction, other sequences or pathogens can be easily detected, such as sexually transmitted (e.g., HIV or HPV), respiratory diseases (e.g., SARS-Cov 2 or Influenza), or even food pathogens (e.g., E. Coli or S. Enterica). Moreover, this platform shows high potential to be applied in the various POC settings by untrained users with distinct heat sources ranging from egg incubators, like in this work, to even hot plates or heating pads.
Methods
Primers and synthetic DNA
Starting from the primers used in our previous work for developing the qPCR13, the primers in this work (Table 1), were produced by IDT (Leuven, Belgium), delivered in IDTE buffer (pH = 7) and were used without further processing, while all the dilutions were done using distilled water. The primers were modified to meet the RPA primer design requirements ( ≈ 30 base pairs, TwistDx), albeit maintaining the same target gene. Primers were selected using the NCBI BLAST engine to detect HINTW (GenBank accession number: NC_052571), a specific gene in the W chromosome of laying hen chickens (Gallus Gallus). IDT Oligoanalyzer 3.1 (IDT) was further used to verify the primers’ annealing temperature, stability, and self-complementary. The forward primer was labeled at the 5’ end with biotin, while the reverse primer was labeled with fluorescein (FAM) at the 5’ end for the detection with RPA liquid basic kit and HybriDetect – Universal Lateral Flow Assay Kit strips purchased from TwistDx Limited (Maidenhead, UK). The synthetic DNA was purchased as double stranded DNA (geneBlock) in IDTE buffer (pH = 7).
Off-chip optimization of the RPA bioassay
The RPA bioassay was first optimized off-chip by testing different primer concentrations and amplification times (see further for more details). The RPA bioassay was performed based on the manual instructions provided by TwistDx23. TwistAmpTM liquid master mix was prepared by mixing 25 μL of 2x Reaction buffer, 2.25 μL dNTPs (40 mM), 5 μL 10x Basic E-mix, 2.4 μL of forward and reverse primer in different concentrations (0.5, 2.5, 5 and 10 μM), 7 μL of deionized (DI)-water and 2.5 μL of 20x Core Reaction Mix. This tube was briefly centrifuged and vortexed to achieve complete mixing of the reagents before dividing the solution into different PCR tubes with 9 μL of the prepared master mix. Before closing the tubes, 1 μL of the sample (0.01 ng/µL synthetic DNA) or DI water for NTC and 0.5 µL of MgOAc (280 mM) were added to the tube lids. Once the tubes were closed, they were inverted 4 times and spun down for 5 s using a tabletop centrifuge at 6000 rotations per minute (rpm), i.e., at 2000 g. The tubes were then incubated in a Biometra TProfessional basic thermocycler (Analytik Jena GmbH, Jena, Germany) for a specific time (5, 10, 15 or 20 min) at 37.7 °C (mimicking egg incubation temperature). After the incubation time, the thermocycler temperature was decreased to 4 °C to stop the reaction.
Next, the RPA amplification product from the PCR tubes (10 μL) was mixed with 40 μL of LFS buffer in an Eppendorf tube. The LFSs (HybriDetect – Universal Lateral Flow Assay Kit, Supplementary Fig. 6) with two lines for colorimetric detection (i.e., test and control) were immersed into this solution, and the colorimetric results were visualized 10 min later. The test line included a biotin-specific antibody, whereas the control line comprised antibodies specific to the reporter probe (i.e., against FAM-specific antibodies immobilized on gold nanoparticles; AuNPs). The RPA amplified product was drawn over the LFS, where reporter probes were lyophilized in the sample pad, thus binding the FAM label. The working method of the used LFS is further explained in Supplementary Fig. 6.
Images of the LFSs were captured using a fi-65F Fujitsu (Tokyo, Japan) flat desk scanner at 10 min after running the test. Band intensities were evaluated using ImageJ software, where the color image was transformed into a black-and-white 8-bit channel image. A rectangular area was drawn around the test line, and the average histogram intensity (AvgTestHist in Eq. 1) was calculated and normalized (NormInt) by subtracting it from 255 (the maximum intensity value for a pixel in an 8-bit image) and then dividing by 255 (Eq. 1). The SNR was calculated according to Eq. 2 using the mean intensity for each condition, where NormIntNoise and NormIntSample are the average test line intensity value of the NTC and positive tests, respectively.
Starting from the same post-amplified RPA samples evaluated with the LFSs, we simultaneously performed electrophoresis analysis with an Agilent 4150 TapeStation system (Agilent Technologies, Inc, USA). All the post-amplified RPA samples handling was performed in ice to avoid the reaction to continue. 1 µL of post-amplified RPA sample or 1 µL of ladder were mixed in PCR tubes with 10 µL of sample buffer. The PCR tubes were vortexed for 1 min, spun at 6000 rpm (2000 g) for 1 min and placed in the TapeStation 4200 device. Data analysis was conducted using the TapeStation 4200 Analysis Software.
Determining the sensitivity of the off-chip RPA bioassay
Once primer concentration and incubation time of the RPA were optimized, HINTW synthetic DNA samples were diluted in 1:5 series, resulting in concentrations from 0.05 and 1.6 × 10⁻⁵ ng/μL. The RPA on the dilution series was tested with two different heat sources: 1) the thermocycler like in the previous section and 2) the Rcom Max 50 DO incubator (Autolex Co., South Korea) used for the eggs’ incubation, which provided information about the amplification efficiency in the commercial egg incubator. After incubation at 37.7 °C the reaction was stopped by decreasing the thermocycler temperature to 4 °C whereas the tubes from the egg incubator were transferred swiftly to ice for further manipulation. To avoid possible contamination sources in thermocycler and egg incubator testing, the equipment was washed with ethanol between tests, complemented with the use of sterilized material (i.e., gloves, PCR tubes, pipettes, pipette tips). The amplification product (10 μL) was mixed with 40 μL of LFS buffer in an Eppendorf tube. Subsequently, the LFSs were immersed into the tubes, and the colorimetric results were visualized 10 min later. Band intensity analysis was performed as described above.
Fabrication of the SIMPLE-RPA chip
The SIMPLE-RPA chip was fabricated using our previously established low-cost and rapid prototyping method21,25. More specifically, the microfluidic network (Supplementary Fig. 4) was designed using Inkscape vectorial software (Version 1.3.2, Software Freedom Conservancy, USA) and fabricated using a manual layer-by-layer lamination method. Moreover, double-sided pressure sensitive adhesive (PSA) tape (200 MP 7956MP) and transfer tape (467MP) with thicknesses of 153 and 50 μm, respectively, were acquired from 3 M (Minnesota, USA). 125 μm thick PET was purchased from Pütz GmbH (Taunusstein, Germany), 1 mm thick PMMA layers from Pyrasied (Leeuwarden, The Netherlands), Versapor™ acrylic copolymer 3000 membrane for the liquid barriers from Cytiva (DC, USA), and Whatman Grade 3 paper from Sigma-Aldrich (Overijse, Belgium). These materials were cut using an 80-watt Speedy300 Trotec laser cutter (Trotec Lasers, Austria). Figure 4 shows different layers (A) together with SIMPLE-RPA chip workflow (B and C). The SIMPLE-RPA chip was divided into three vertically stacked units: the pumping unit, the sample processing unit, and the detection unit, which were linked with air connection holes and liquid connection holes, shown with the dashed and full arrows, respectively (Fig. 4A).
The pumping unit comprised 2 layers, each made of 2 stacked PSA layers sandwiched between 2 PET layers. The top layer of this unit (IV in Fig. 4A) contained the porous material (Whatman Grade 3), inserted into its chamber during assembly and secured with transfer tape. The bottom layer (V in Fig. 4A) comprised the microfluidic channels containing the working liquid, its prefilling hole and the activation site.
The sample processing unit comprised 2 layers of single PSA sandwiched between 2 PET layers. The top layer (II in Fig. 4A) comprised the microfluidic channels for sample processing, RPA and LFS reagents prefilling holes, liquid connection to the detection unit and air connection to the pumping unit. Two types of hydrophobic valves were created: HBVs and liquid barriers. HBVs were made in the sample processing unit top layer (II in Fig. 4A) following a mask-based strategy, based on a previous report20. In short, both top and bottom or only bottom PET films were locally coated with 2 µL of hydrophobic solution Fluoropel 800 purchased at Cytonix (Maryland, USA) to create dc or scHBVs, respectively. After, the PET films were allowed to dry for 1 h at room temperature and masks were removed. The bottom layer of the sample processing unit (III in Fig. 4A) holds the hydrophobic porous Versapor membranes (i.e., liquid membranes), allowing air passage but preventing liquid flow due to their high burst-pressure properties ( > 0.7 bar) and working as switches for the liquid manipulations, as explained in detail in Fig. 4B, C. Moreover, only the 3D mixing chambers span two layers (i.e., going through the first and second layers of the sample processing unit; Fig. 4A). In these structures, the inlet and outlet of the chambers were located in different layers, i.e., inlet from the top layer and outlet from the bottom layer or vice versa. More information on these structures can be found in a previous report20. The sample mixed with the RPA reagents proceeds through the mixing chambers and a series of meandering channels allowing for incubation and amplification of amplicons in the sample.
The detection unit was designed to hold the LFS (i.e., a HybriDetect – Universal Lateral Flow Assay) by sandwiching a PSA layer between a 1 mm PMMA and PET layer. The PMMA layer contained a connection hole to the sample processing unit, while the pumping unit was connected through the LFS space.
After the assembly of the microfluidic chip, 0.5 µL of MgOAc (280 mM) was loaded into the first mixing chamber and sealed with PSA. Next, the working liquid and reagents were prefilled through their respective prefilling holes, bringing the working liquid close to, but not in contact with, the porous material, as previously described30. The working liquid comprised a blue microfluidic dye obtained from Darwin Microfluidics (Paris, France) diluted in distilled water (1:20) mixed with 4% (w/v) PVA obtained from Sigma-Aldrich (Overijse, Belgium). The chips were used immediately after prefilling. When not prefilled, they were stored overnight at 4 °C in a closed bag with desiccant.
On-chip RPA integration for synthetic HINTW DNA detection
The SIMPLE-RPA chip performance was assessed using the off-chip optimized RPA conditions. The RPA master mix was prepared as explained in the section on off-chip optimization of the RPA bioassay, and 9 µL was subsequently introduced into the SIMPLE-RPA chip through its prefilling hole (Fig. 4A). MgOAc (0.5 µL; 280 mM) was pipetted into the first 3D chamber and LFS buffer (40 µL) was loaded into the chip. All the reagents were inserted into the microfluidic channels using a micropipette. All the prefilling holes were sealed using a PSA membrane. A video showing the prefilling of all the liquids is shown in Supplementary Video 2. The Rcom Max 50 DO incubator (Autolex Co) was set at 37.7 °C and 55% humidity for incubation. The SIMPLE-RPA chip was placed inside the incubator and allowed to reach the set temperature. The synthetic HINTW DNA samples were prepared with a 1:5 dilution series between 0.05 and 1.6 × 10⁻⁵ ng/μL. For testing the SIMPLE-RPA chip, 2 µL of HINTW synthetic DNA sample in IDTE buffer or 2 µL of DI-water for NTC was added to the inlet with a micropipette and the SIMPLE-RPA chip was activated with a single finger press. The testing was done in triplicate. The autonomous SIMPLE-RPA chip operation happened inside the incubator without any disturbance or user intervention followed by its removal from the incubator only when all amplified RPA product with LFS buffer were absorbed by the LFS. The LFS was scanned using the fi-65F Fujitsu flat desk scanner and its band intensities were analyzed as previously described.
Data analysis
GraphPad Prism version 9 (GraphPad Software, San Diego, CA, USA) was used for all statistical analyses and data visualization. One-way ANOVA (α = 0.05) was performed, followed by Tukey’s multiple comparison tests.

Responses