High-throughput light-induced immunoassay with milliwatt-level laser under one-minute optical antibody-coating on nanoparticle-imprinted substrate

Introduction
Antigen-antibody reaction is an essential biochemical reaction in the immune system of humans and animals and is also used for testing for viruses and various diseases. Establishing rapid and sensitive testing methods for infectious diseases of microbial origin1, such as the novel coronavirus SARS-CoV-2 and noroviruses, is crucial for public health. However, viruses are nanoparticles with diameters of approximately 100 nm, hindering their detection. Spike proteins on the surface of viral nanoparticles are repeatedly displaced in the host2, leading to the development of numerous mutant strains, thereby resulting in long-term pandemics. SARS-CoV-2 virus is found at low concentrations in mild disease cases. Upon the onset of illness, the concentration of viruses was ~1.52 × 10¹¹ copies/mL in a saliva droplet collected from exhaled breath during 30 min coughing3. Therefore, conventional techniques can only detect the virus after the onset of fever or other symptoms, resulting in rapid transmission and an increase in the number of patients. Various detection methods targeting viral RNA or surface spike proteins have been developed. However, tests using the conventional detection method of nucleic acid with polymerase chain reaction (PCR) or Enzyme-Linked Immuno Sorbent Assay (ELISA) with antigen-antibody reactions in labratory4,5 require prolonged measurement times of more than several hours to obtain sufficient levels of signals for detection. Also, the lateral flow assay is quick, taking only a few minutes to measure for home use, its sensitivity is low, and the probability of false positive or false negative results is not negligible before the number of viruses increases sufficiently due to fever. Meanwhile, optical methods can provide non-contact remote inspection, reducing the risk of infection from aerosol since biological substances can be observed via optical signal from closed transparent cell, whereas there are still many improvement points. Optical nanomaterial detection methods include two-dimensional surface plasmons (SPs) in thin films and three-dimensional localised surface plasmons (LSPs) near the resonance wavelength that are highly sensitive to the refractive index of the target nanomaterials on the metal surface6,7. There are also numerous reports on molecular and nanomaterial sensors based on metal nanostructures8,9,10. A study applied this principle for virus detection using the SP-resonance shift produced when RNA extracted from a virus binds to complementary DNA modified on a gold thin film11. A direct detection method for viruses was also devised using anomalous light transmission resulting from the interactions of SPs and LSPs in an array of nanoholes, which periodically formed holes with sizes less than the wavelength of light in a thin metal film12; however, this method required an incubation period of one hour or longer. Also, the localised electric field of silver nanoislands was used to enhance the sensitivity to be 100 times depending on the surface roughness based on the theoretical analysis and optical experiment with prism13, whereas the detection time would be long without external field guiding effect and limit of detection was on the order of 1012 viruses/mL. Other than these, there were lots of reports on trials of passive optical methods to detect viruses, such as colorimetry, fluorescence, SP resonance, plasmon-enhanced fluorescence, and surface-enhanced Raman scattering, where advantages and disadvantages have been discussed14.
To solve the problems inherent to the passive detection methods described above, the “optical condensation” can be defined as a promising active detection method based on the light-induced force used in optical tweezers15,16,17 and light-induced fluidic effect (i.e. photothermal convection)18,19. a method to enhance the cooperative effect of LSPs at the measurement site using optical trapping with light-induced forces was theoretically proposed20, and a method to transport targets using convection arising from photothermal effect21,22 was experimentally proposed for active detection of biomaterials23,24. For example, using such light-induced force and photothermal effect, a method based on the principles related to the light-induced acceleration of biochemical reactions, such as DNA double-strand formation25 and protein antigen-antibody reactions26 have recently been proposed. Thus, the synergistic effects of both light-induced forces due to electromagnetic interaction and light-induced convection due to thermodynamic interaction were used for highly efficient optical condensation of various biological nanomaterials, and also the pressure-driven flow mediates optical condensation24,27,28. Such optical condensation can be used for high-density trapping of micron-order particles and bacteria24,29 and cell-penetrating biofunctional molecules30 using the region between the bubble and the substrate, generated through local heating with a focused laser, as an aggregation site. Honeycomb substrates and bowl-shaped substrates (BPS) with micro-scale periodic multiple pores, which enable high concentration while suppressing thermal transfer to the trapped bacteria, have been developed31,32; the principle of low-damage optical condensation by bubble-mimetic substrates has been reported33. Furthermore, there was a theoretical proposal to increase the sensitivity of detection by enhancing the light-induced force resulting from the localised electromagnetic field at the tip of the nanostructure, where randomly arranged nano-spike structures were assumed on the surface of the nanohole array substrate for guiding nanoparticles of approximately 100-nm diameter—comparable to a virus—toward the measurement site near a nanohole34. However, there is no current report on using photothermal fluidic effect and bubble for optical condensation targeting biological nanoparticles, such as viruses. Therefore, we deemed it necessary to develop a biochip that can guide nanoparticles to the detection site mediated by light-induced convection and bubble with a low-power laser, thereby facilitating a low-cost, portable, and versatile system that affords high speed and sensitivity while maintaining functionality. Selectivity is crucial when identifying the virus type; this can be achieved by developing a trap site modified with probe molecules such as antibodies to serve as a detector.
Here, we propose a light-induced detection method with our developed substrate consisting of a periodic array of nanoscale bowl-like structures (nanobowls) produced from a simple self-assembly of template nanoparticles, i.e., a nanoparticle-imprinted plasmonic substrate (NPI-PS). Particularly, based on NPI-PS, we elucidate a mechanism of rapid and highly sensitive specific detection of protein-modified biological nanoparticles (Fig. 1). In order to understand the correlation between the initial concentration of dispersion liquid of nanoparticles and the optical signals from optically condensed nanoparticles, we evaluated the dependence of the area of fluorescent nanoparticles around laser irradiated region after optical condensation. As an example, using optical condensation to induce the accumulation of antibody-modified nanoparticles at the observation site to form a trap site, we investigated the potential of a small, coin-sized chip to selectively detect viruses in droplets and saliva by targeting virus-mimicking nanoparticles (VMNPs) with spike proteins of SARS-CoV-2 on their surface. Moreover, we also investigated the shrinkage process of light-induced bubble for the enhancement of target condensation, and the change in the reflection spectrum due to the accumulation of the aggregates for label-free detection. This research will be an important foundation for the active detection of various biological nanomaterials (proteins or their aggregates, nanoparticles with unique membrane proteins on their surfaces such as viruses and nanoscale extracellular vesicles), using optical condensation based on simple and highly sensitive compact biochips, leading to high-throughput diagnosis of various types of diseases.

Schematic diagram of optical condensation of protein-modified biological nanoparticles using light-induced convection and light-induced bubble from an NPI-PS.
Results
Our research is motivated by the need to devise a detection technology sensitive enough to detect biomarker proteins or biological nanoparticles, such as viral surface antigens before the onset of symptoms if possible. The shortened turn-around time of detection, compared to that of existing technologies, could significantly interrupt not only the transmission of these pathological entities but also the risk of various diseases. The results are presented and discussed in the following sections. Initially, the fundamental mechanism of optical condensation with NPI-PS was discussed, and the survival rate of bacteria was discussed. After that, the application potential for nanoparticles modified with S-protein of SARS-CoV-2 was investigated. Moreover, an enhancement mechanism of detection sensitivity with optical condensation was discussed considering the shrinkage of light-induced bubble, and the simple high-sensitivity detection was also proposed with LSP resonance spectroscopy under optical condensation without fluorescent labeling.
Light-induced detection of nanoparticles using an NPI-PS
Using our developed NPI-PS, as shown in Figs. 2a, b, we observed images of fluorescent nanoparticles assembled by optical condensation in the stagnant region around the light-induced bubble as shown in the schematic image in Fig. 2c. Figures 2d–g and Movie S1 show the experimentally fluorescent images that were observed under laser irradiation onto the surface of an NPI-PS from above for 2 min (Fig. 1; Fig. S1 illustrates the optical system used in the experiment). Figure 2h shows a positive correlation between the aggregation area and concentration of nanoparticles in the dispersion liquid. With this result as a calibration curve, concentrations of nanoparticles contained in the dispersion can be quantitatively assessed based on the aggregation area in only 2 min. Furthermore, a laser power of 5 mW—approximately one-tenth of the power required by a conventional substrate with a thin gold film—was sufficient to generate bubbles (Fig. S2). This can be attributed to the fact that the periodic bowl structure facilitates heat accumulation and localised heating (Fig. S3). Furthermore, it is possible that air, which was retained in the bowl structure, expanded due to laser heating, thereby contributing to bubble generation.
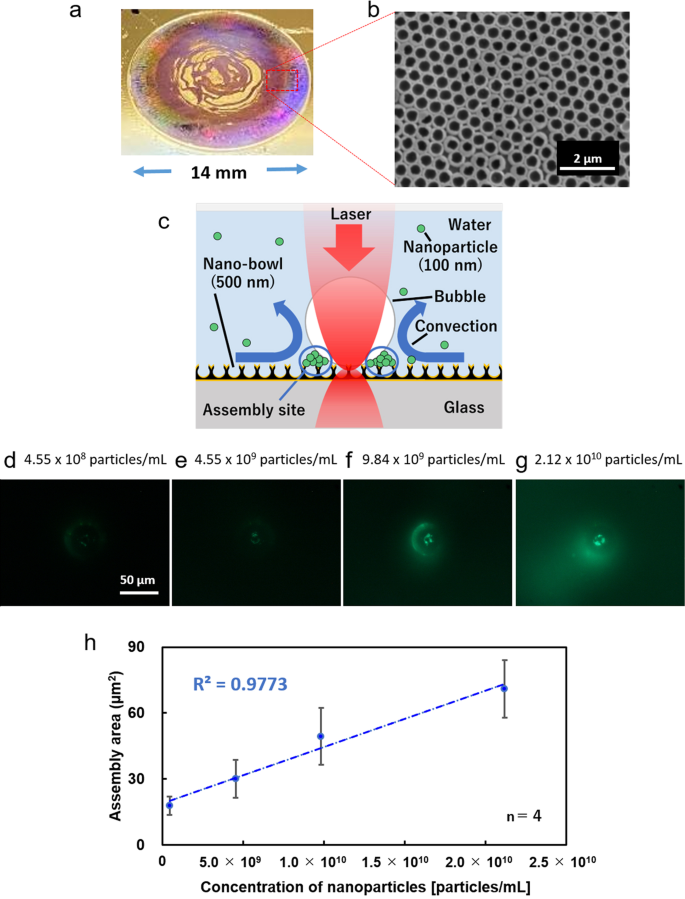
a Overall picture of NPI-PS at real scale without microscope, and (b) scanning electron microscope (SEM) image of a part of NPI-PS. c Schematic diagram of optical condensation using an NPI-PS from side view. d–g Fluorescence image of nanoparticles assembled via optical concentration using NPI-PS (see also Movie S1). The laser irradiation spot is at the center of each observed area. h Relationship between assembly area and concentration of nanoparticles. The aggregation area calculated from the fluorescence images is plotted on the vertical axis, and the concentration of the dispersion liquid before optical condensation is plotted on the horizontal axis as a logarithmic plot. The assembly area was calculated via image analysis. Error bars indicate standard deviation.
Survival rate of bacteria under optical condensation with NPI-PS
Before exploring the applicability of our novel NPI-PS to viruses, florescent-stained bacteria (Escherichia. coli) were assembled via laser irradiation at 5 mW for 1 min to determine the extent of damage to biological samples (Fig. S4). Bacteria were stained with the fluorescent dyes SYTO9 and PI; viable bacteria glow green (Fig. S4c), whereas dead bacteria glow red (Fig. S4d). The results exhibiting red fluorescence of PI in Fig. S4d suggest that the area near the laser irradiation was extremely hot, thus generating bubbles and killing bacteria. The high temperature near the laser irradiation area may be due to the use of a laser wavelength (800 nm) that is close to the resonance wavelength of the LSP resonance (LSPR) when the surrounding medium is water, possibly prompting the efficient conversion of laser energy into thermal energy. Assuming that the bacteria stained with SYTO 9 are live and the bacteria stained with PI are dead, the survival rate can be evaluated using the following equation: (survival rate) = (area of green fluorescence − area of red fluorescence) / (area of green fluorescence)31,33. By estimating the survival rate from the SYTO9-stained area (green fluorescence) by that stained by PI (red fluorescence), we identified the conditions for optical condensation that can accumulate bacteria with high survival rates ( > 90%). Based on this result, VMNPs may be able to accumulate at the trap site by optical condensation without damaging the spike proteins on the surface, which are necessary for selective detection.
Detection of virus-mimicking nanoparticles (VMNPs) using an NPI-PS
As an application, S-protein-modified nanoparticles derived from SARS-CoV-2 were used as VMNP targets (pseudoviruses in which the S2 site of the S-protein is specifically bound by an anti-S2 antibody, leaving the S1 site exposed). The affinity of each protein to the antibody was determined using the SPR molecular interaction analyzer (Fig. S5). We performed a two-step light-induced assembly of antibody-modified nanoparticles and target nanoparticles (VMNPs and unmodified nanoparticles), where the low power laser was used to generate the moderate light-induced convection for the antigen-antibody reaction over the wide area of millimeter scale. 5 μL of dispersion liquid of anti-S1 antibody-modified nanoparticles were dropped onto the NPI-PS and immobilised to form the trapping sites over the wide area of NPI-PS via optical condensation with the 1st laser irradiation (3 mW) for 1 min prior to VMNP accumulation (Fig. 3a). After that, 5 μL of dispersion liquid of VMNPs (match) were dropped onto the NPI-PS and assembled by optical condensation with 2nd laser irradiation (3 mW) for 4 min. In addition, 5 μL of dispersion liquid samples of unmodified nanoparticles (mismatch) were measured with the same procedure for the same concentration set. Also, the same set of dispersion liquid of VMNPs (match) with the same concentrations was dropped onto the NPI-PS and measured after 4 min without 2nd laser irradiation as the negative control. After that, a tube containing each NPI-PS (match with or without 2nd laser, and mismatch nanoparticles) was vortexed and washed with 0.01 mM NaOH for 10 sec. The fluorescent area on each sample on NPI-PS was compared with each other using the analysis software ImageJ35 (Fig. 3b, c). The concentration of virus in droplets over 5-μm diameter and in smaller aerosol was reported as 1.52 × 10¹¹ copies/mL collected after 30 min of coughing, as shown in a previous report3. Our result suggests that several minutes optical condensation enable the selective detection of 106-107 viruses in 5 μL corresponding to the concentration on the order of 109 particles/mL as 1/100 of the above conventional method without optical condensation. In Fig. S6, as an application to a real sample, it has been also confirmed that the selective detection of VMNPs even in the artificial saliva diluted into 50% with the same procedure in Fig. 3. We have also confirmed the selectivity even in the case of lower concentration as 108 particles/mL, where the calibration curve shows clear difference for VMNPs and mismatch nanoparticles. This result reveals the potential of detection of viruses or marker proteins even in the clinical samples.
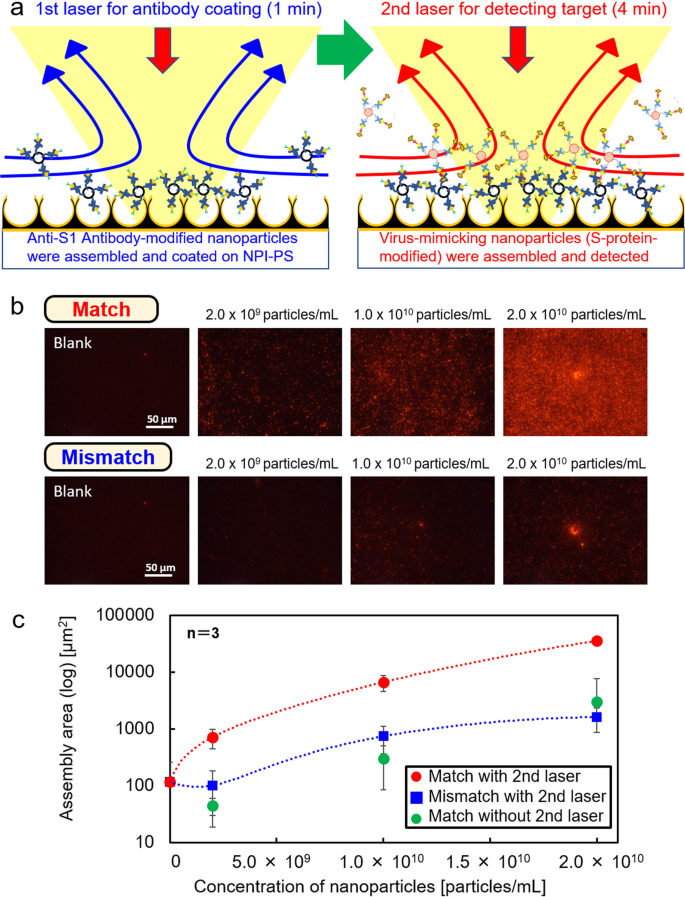
a Schematic diagram of two-step optical condensation detection of viruses using an NPI-PS. b Fluorescence images of VMNPs (match) and unmodified nanoparticles (mismatch) at different concentrations after optical condensation. The laser irradiation spot is at the center of each observed area. c Relationship between assembly area and concentration of nanoparticles for VMNPs (match, red plots) and unmodified nanoparticles (mismatch, blue plots), where the assembly area was calculated via fluorescence image analysis. Also, the assembly area of VMNPs were also measured without 2nd laser as the negative control (green plots). Error bars indicate standard deviation.
High-sensitivity detection by shrinkage of light-induced bubbles
In the case of low laser power, the wide range of optical condensation is possible as shown in Fig. 3, whereas there would be still room for improvement in sensitivity. In this section, we discuss the approach to improve the sensitivity with the shrinkage of light-induced bubble. When optical condensation in the NPI-PS was performed by laser irradiation at 5 mW for 30 sec, the generated bubbles shrank with the concentrated dispersed material within 1 min (Fig. 4a); the concentration was 4.55 × 10⁶ to 2.12 × 10⁸ particles/mL, which is higher than the result in Fig. 2. Nanoparticles can be detected with two orders of magnitude higher sensitivity and at lower concentrations (Figs. 4b, c). This heightened sensitivity is thought to be due to the multi-stage concentration process of particles attached to the bubble surface resulting from bubble contraction. The aggregate area was calculated from the fluorescence image of fluorescent nanoparticles after optical condensation (Fig. 4b) and plotted on the vertical axis (Fig. 4c), with the concentration of nanoparticles in dispersion liquid before optical condensation plotted logarithmically on the horizontal axis. A calibration curve showing high linearity was obtained, indicating a positive correlation between the aggregate area and dispersant concentration and enabling quantitative evaluation of dispersant concentration in the extremely low concentration range.
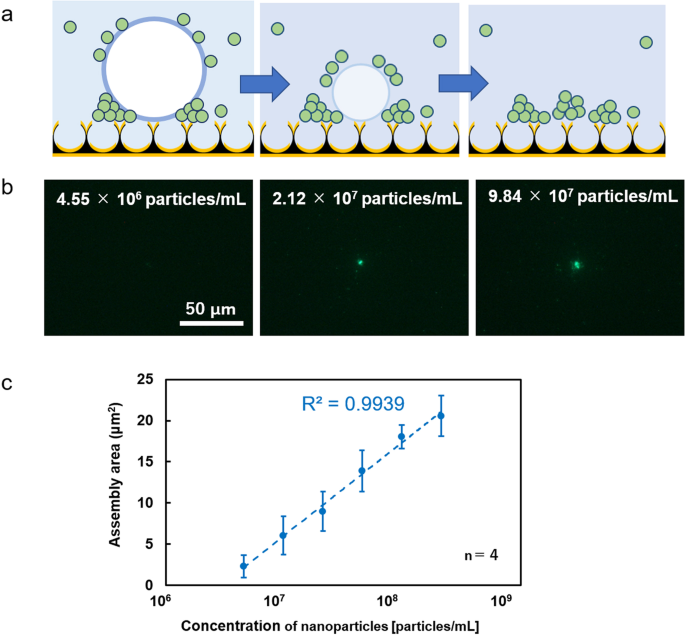
a Conceptual diagram of a high-sensitivity detection method using bubble shrinkage. b Fluorescence image of optical condensation aggregates. The laser irradiation spot is at the center of each observed area. c Relationship between assembly area and concentration of nanoparticles. The aggregate area calculated from the fluorescence image of fluorescent nanoparticles after optical condensation is plotted on the vertical axis, and the concentration of nanoparticles in dispersion liquid before optical condensation is plotted logarithmically on the horizontal axis. The assembly area was calculated via image analysis. Error bars indicate standard deviation.
Spectroscopy of LSPR after optical condensation
If the assembly of target nanoscale biomaterials can be observed without fluorescence image, it is useful to omit fluorescent labeling and optical parts. such as fluorescent filters. Therefore, we also investigate the possibility of the detection of nanoparticles via reflection image and reflectance spectra. NPI-PS can guide target nanoparticles toward the measurement site via highly efficient optical condensation, enabling not only fluorescence image analysis but also spectral analysis. As a specific example, Fig. 5 compares the reflectance spectra of the nanoparticle-dispersion solution before and after optical condensation (Figs. 5a, b); 5b shows that the LSPR-derived peak is considerably shifted by the synergistic effect of optical condensation and the plasmonic substrate. The estimated number of condensed nanoparticles was evaluated from the fluorescent area of assembled nanoparticles like Fig. 2d by dividing it with the cross-sectional area of each nanoparticle of 100 nm in diameter. Therefore, we plotted the relationship between the estimated number of condensed nanoparticles and the degree of peak shift, yielding a positive correlation between the area of nanoparticle aggregates and the degree of peak shift (Fig. 5c). From the slope of the line, we estimated that the peak of the NPI-PS reflectance spectrum shifts by 1 nm when 700 nanoparticles gather. We also compared the experimentally observed optical response of the NPI-PS with the solution obtained from theoretical calculations based on finite difference time domain (FDTD) simulations using Ansys Lumerical FDTD Solutions (Fig. 5d). The structural model simulated based on the NPI-PS scanning electron microscope (SEM) image (Fig. 2b) is shown in Fig. 5e. Periodic boundary conditions were used for the lateral boundaries because of the periodicity of the substrate structure. Figure 5f shows the spatial distribution of the magnitude of the electric field inside and around NPI-PS without target nanoparticles, the electric field is strongly localized inside of each nano bowl of NPI-PS (left), and the field magnitude inside the nano bowl was increased with nanoparticles adsorbed on the top of nano bowl. In order to understand the mechanism of the peak shift, we also investigated the reflectance spectra with water and ethanol with known refractive indices (Fig. S7). It was confirmed that a clear peak shift approximately 30 nm difference was observed even when the refractive index difference was as small as 0.03, as in the case of water with a refractive index of 1.33 and ethanol with 1.36, thus verifying correspondence with the theoretical results based on the FDTD method (Fig. S8). Remarkably, high sensitivity as 1000 nm/RIU (experimentally estimated) can be achieved even with self-assembled plasmonic substrate with higher structural fluctuations comparable to top down methods such as photolithography36.
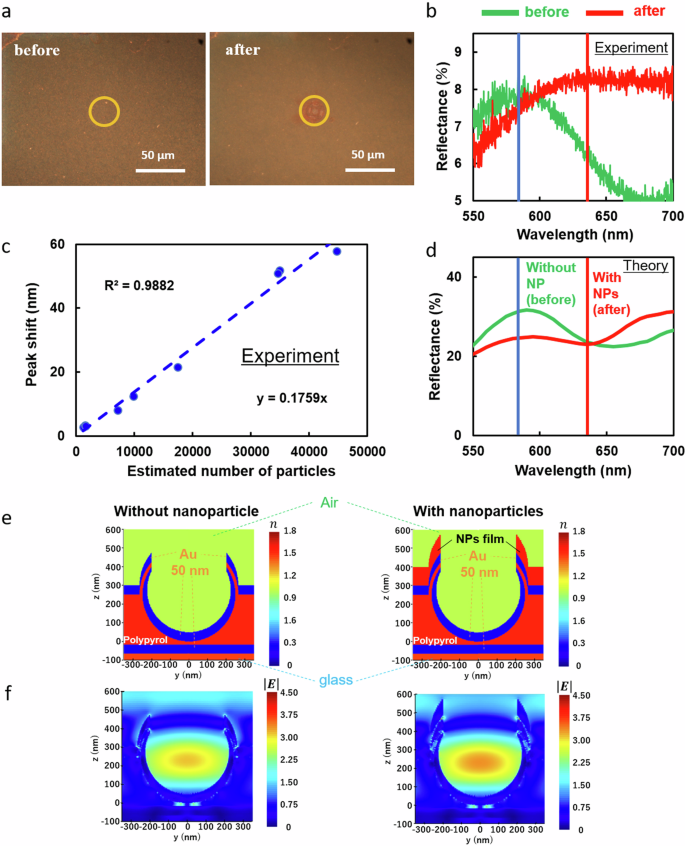
a Optical reflection image before and after optical condensation. b Comparison of reflectance spectra before and after optical condensation. The laser irradiation spot is at the center of each observed area. c Relationship between peak shift and estimated number of NPs around the laser spot after optical condensation. The reflectance spectrum of NPI-PS shows a redshift after optical condensation. d.Calculated reflectance spectra calculated via FDTD simulation, where e cross sections of the computational models were shown with refractive indices of respective materials at 600 nm wavelength without NP (left) and with NPs film (right). f Calculated distribution of magnitude of the electric field at 600 nm wavelength without NP (left) and with NPs film (right).
Discussion
We developed an NPI-PS with bowl structures of 500 nm in diameter arranged at intervals, and the nanoparticles underwent successful optical condensation with low-level mW laser irradiation. Furthermore, we demonstrated a positive correlation between the area of aggregates and the concentration of nanoparticle dispersion due to optical condensation. In particular, we achieved highly sensitive and selective detection of VMNPs with spike proteins on the surface of the SARS-CoV-2 virus via laser irradiation within 5 min even in the case of taking into account the coating process of antibodies on the substrate (1 min) and washing process with vortex (10 sec). This reveals the possibility of ultra-sensitive and rapid specific detection of viruses in a small amount of droplet of microliter-level (106–107 viruses in 5 μL) with 100 times sensitivity mediated by optical condensation. The NPI-PS also exhibited spectral modulation that is sensitive to changes in the ambient refractive index as 1000 nm/RIU, and when combined with optical condensation, it reveals the possibility of detecting nanoparticles at low concentrations without fluorescent label based on the peak shift in the reflection spectrum. Our findings provide an important basis for the development of compact biochips for future portable light-induced acceleration systems. In addition, these findings are expected to contribute to innovations in not only high-throughput on-site testing of viruses but also ultrafast immunoassay for nanomaterials secreted from cells as biomarkers of various diseases.
Methods
Production of the nanoparticle-imprinted plasmonic substrate (NPI-PS)
A glass-bottom dish (GBD, D11130H; Matsunami Glass, Osaka, Japan) consisting of a glass substrate surrounded by a 1.4-cm diameter cylindrical plastic wall was used to fabricate the periodic bowl-shaped structure of the NPI-PS (Fig. 2b). A thin gold film (thickness: 50 nm) was deposited on a GBD using an ion sputtering system (E-1010; Hitachi, Tokyo, Japan). Carboxyl group-modified polystyrene particles (09836; Polysciences, Inc., Warrington, PA, USA) with an average diameter of 500 nm were self-assembled on a thin gold film and used as templates for the bowl-shaped NPI-PS. The polypyrrole covering the mould was applied by pyrrole electropolymerisation (167-05662, Wako Pure Chemical Industries, Ltd., Osaka, Japan) over a self-assembled periodic array of polystyrene particles using platinum wire as a cathode and a gold-coated GBD as an anode. Subsequently, the polystyrene particles were dissolved using chloroform (035-02616; Wako) to obtain a bowl-shaped structure. Finally, a gold thin film was formed again. The NPI-PS structure was observed via scanning electron microscopy (JSM-IT100; JEOL, Japan Electron Optics Laboratory CO., LTD, Tokyo, Japan).
Preparation of virus-mimicking nanoparticles (VMNPs)
The VMNPs were prepared with fluorescent streptavidin-modified beads (30-19-102; Micromod Partikeltechnologie GmbH, Rostock, Germany; undiluted concentration is 1.9 × 10¹³ particles/mL, Rhodamin B (excitation:552 nm, emission:580 nm) was doped), biotinylated anti-S2 antibody (GTX632604; GeneTex, Irvine, CA, USA; undiluted concentration is 0.285 mg/mL), and S-protein (10549-CV; R&D Systems, Minneapolis, MN, USA; undiluted concentration is 0.5 mg/mL) that were mixed and allowed to stand at 42 °C for 1 h; the solvent was replaced by phosphate buffer (10 mM, pH 6.6) using a dialysis kit (40784; Scienova GmbH, Jena, Germany). For buffer replacement, the buffer was replaced and allowed to stand for 15 min four times. After that, the buffer was replaced and allowed to stand for 1 h, and this was replaced and allowed to stand for 2 h. Then, the obtained buffer was replaced and allowed to stand overnight (16–20 h, temperature was kept at 0 °C). In this replacement process, commercial phosphate buffer (FUJIFILM, 164-27135, pH 6.4) was diluted to 10 mM (pH 6.6). Anti-S1 antibody-modified nanoparticles were similarly mixed with streptavidin-modified beads (01-19-102; Micromod) and anti-S1 antibody (GTX635654; GeneTex; undiluted concentration is 0.285 mg/mL), and incubated at 42 °C for 1 h. The solvent was replaced by phosphate buffer (10 mM, pH 6.6) as described above. Biotinylation of each antibody was performed using a water-soluble biotinylating reagent (A39257; Thermo Fisher Scientific, Waltham, MA, USA). In Fig. S6, Artificial Saliva for pharmaceutical research (BZ108, Biochemazone) was used for investigating the effect of foreign substances, where the VMNPs were dispersed into the mixture of equal volumes of the artificial saliva and the diluted phosphate buffer (10 mM, pH 6.6).
Optical system
Fig. S1 is a schematic diagram of the optical system. Reflectance image visualisation and measurement of reflectance spectra of samples were performed using an optical upright microscope (Eclipse 80i; Nikon, Tokyo, Japan) equipped with halogen and mercury lamps as white light sources and a spectroscope (USB4000 (grating #3) SLIT-25; Ocean Optics, Inc., Dunedin, FL, USA) connected to an optical fibre (core diameter: 50 μm). An 800-nm CW laser (FPLD 0806-100-CS; FiberLabs Inc., Saitama, Japan) was introduced into the sample stage using a backport adapter (00272356001; Sigma Koki Co., Ltd., Tokyo, Japan) for optical condensation. To evaluate the optical response of the substrate material, optical condensation, and spectroscopy were performed using a 40× objective lens (CFI Plan Fluor 40x/0.75 DIC M/N2, NA: 0.75, Cover glass thickness: 0.17, WD: 0.66; Nikon, Japan). For fluorescent imaging, a halogen lump was used for Fig. 2d–g, and a mercury lamp was used for Fig. 3, Fig. 4, Fig. S4, Fig. S6 as illumination light sources, respectively, where green fluorescent images were observed via FITC-A-Basic (Nikon Japan) and red fluorescent images were observed via TRICK-A-Basic (Nikon, Japan) as optical filters. In order to binarising red fluorescent image for effective analysis, brightness was added +40% with PowerPoint in Fig. 3b and Fig. S6a. For reflectance spectrum measurements, a halogen lamp equipped with an optical microscope was used as a white light source; reflectance was calculated with respect to a protected silver mirror (PF10-03- P01-10; Thorlabs, MHI, USA).
Assembly area measurement
The area of the assembled structure of the fluorescence polystyrene particles of 100 nm diameter (16662-10; Fluoresbrite Carboxylate Microspheres (2.5% Solids-Latex), YG Polysciences, Inc., Warrington, PA, USA) by optical condensation was estimated from fluorescence images using NIS-Elements Analysis software (Nikon Instruments Inc., Tokyo, Japan). The emission intensity of the bacteria at the edge of the fluorescence image was designated as the standard value. The area of the luminescence collected at the assembly site near the centre of the bubble was measured (i.e., not the luminescence attached to the outside of the bubble). The estimated number of nanoparticles was determined by dividing the fluorescence area from assembled nanoparticles by the cross-sectional area of each nanoparticle calculated from the average diameter of nanoparticles. In Fig. 3 and Fig. S6, an assembly area of target nanoparticles was evaluated binarising each red fluorescent image with ImageJ35 (Ver. v1.54 f) as following steps; <1> The fluorescence image (RGB) was converted into grayscale image using “Split Channels” (function of ImageJ). Each grayscale image in 8 bits was quantified as luminance by splitting the color (0 for black, 255 for white. Each image was divided into 1280 × 960 pixel). <2> in “Threshold” (function of ImageJ), pixels above the threshold setting 50 (red area in the original color image) were considered as VMNPs. <3> the region beyond the threshold selected in <2> larger than 8 pixels was counted as the sum of fluorescence area of VMNPs using “Analyze Particles” (function of ImageJ). <4> When the weighted area should be calculated, the averaged luminance of selected pixels in <2> (value between 0 and 255) was multiplied with the fluorescence area in <3 >, where the product was finally divided by 255.
Theoretical calculations
The experimentally observed optical response of the NPI-PS was compared with solutions obtained from theoretical calculations based on FDTD simulations using the commercial software Ansys Lumerical FDTD Solutions (Ver. 2022 R1.4, Ansys Inc., USA, Pennsylvania). The SEM images were used to create a structural model for the simulation. Due to the periodicity of the substrate structure, periodic boundary conditions were used for the lateral boundaries (The width for x direction is set to 500 nm, and the width of y direction is set to 866.025 nm). The refractive index of the nanoparticles was assumed to be constant as 1.59, referring to the PRODUCT CATALOG of Polysciences 2022/2023. The wavelength dependence of real and imaginary parts of the refractive index of gold film, polypyrrole film and glass substrate were extracted from the previous literatures37,38,39, where experimental data in the literature were fitted to obtain the dielectric function for polypyrrole in the calculation using FDTD Solutions within the wavelength region of 500–800 nm (Fig. S9)38.


Responses