Turning mine-tailing streams into sources of water and mineral salts in a membrane-sustained circular scenario

Introduction
The growing global consumption of natural resources, under the pressure of continuous population growth and the expansion of emerging economies, has accentuated the impact of human activities on the environment1. As an ultimate consequence, many of the raw materials essential to the economy are limited2 and natural resources necessary for human life, such as water3, are stressed in ever larger areas of the world4. In this context, the paradigm shift from the current linear economy based on the extract—produce—use—dispose model, towards a closing loop circular economy scenario built on the concept of total recovery of raw materials, is seen as a viable solution for environmentally sustainable growth that combines economic development with social needs5.
Today, most materials used in industry, technological development and energy generation are extracted through mining6. Mining has historically been a major source of wastes, most often in the form of wet slurries that are conventionally disposed of in tailings dams. It is estimated that there are approximately 18,000 metal and mineral extraction dams in the world, of which 3,500 are still active, (https://earthworks.org) that globally generate more than 14 billion tons per year of wastewater7. These highly salts concentrated effluents deliberately or accidentally contribute to significant pollution of river basins, resulting in serious risks to human health and long-term environmental implications8 such as eutrophication9, increased salinity or alkalinity of the soil and deterioration of the quality of soil where wastewater is used for irrigation10.
However, in the context of natural resource recycling, mine-tailing wastewater can be considered as a potential source of water11,12, minerals13 and energy14,15, if treated with efficient and sustainable technologies, while decreasing the environmental polluting potential of the mining activities16. Salts recovered from hypersaline streams can find application in several industrial fields such as metallurgical, fertilizer, ceramic, detergent or petrochemical17,18. For example, among many essential products widely used in industry, magnesium and potassium are considered critical raw materials for the European ecosystem, whose recovery from highly concentrated solutions represents a serious technological challenge19,20,21.
On this basis, the main objective of this work was to demonstrate the possibility of valorizing wastewater deriving from mining activities through the recovery of pure water and mineral salts using membrane-assisted crystallization (MAC) technology22. MAC is an interesting separation technique that offers the possibility of obtaining a high recovery rate from hypersaline solutions whose salt concentration is well beyond the operating range of reverse osmosis (RO)23,24,25, thus obtaining high-quality water26 along with flexibility and suitability of integrated operations27. In one embodiment, it is based on the use of hydrophobic and porous membranes to contact the hot feed solution and the cold condensing fluid (normally water) undergoing mass exchange in the vapor phase, driven by the vapor pressure difference generated by the thermal gradient between the two sides22. Specifically, because each pore on the membrane surface acts as a solvent removal point, supersaturation is generated uniformly across the entire membrane module. Therefore, compared to typical crystallization methods, MAC technology allows optimal control of the supersaturation level by acting on operating parameters such as temperature, flow rate and membrane module geometry, thus influencing crystal nucleation and growth rates, while it can be easily scaled-up thanks to the modularity of the membrane16,28. Although the application of MAC technology for the recovery of solid products from industrial waste effluents has been proposed in recent publications29,30,31, these works are mainly linked to studies performed with synthetic model solutions and do not take into account the effect of multi-ionic composition and competitive precipitation kinetics from complex mixtures.
Here, we focused on real mine tailing wastewater extracted from the intersection point of the collector that picks up brines from different salt extraction industries in the region of Catalonia, which is located in Castellgalì (near Barcelona, Spain). In addition to being a stream of serious environmental impact that flows more than 162 km inland to the reception tank of the El Prat de Llobregat seawater reverse osmosis plant (SWRO), hypersaline waste is pumped 3 km offshore through a submarine outlet at the constant flow rate of 1800 m3 per hour, with a potential impact also on the marine ecosystem. Given the complex nature of the stream, we first performed thermodynamic simulation work, aiming to predict the salts that can be recovered from the brine of known composition under different temperature conditions and at different solute concentration factors. Then, membrane-assisted crystallization experiments were first conducted using artificial hypersaline brine, to validate the predictive ability of the theoretical approach. Finally, real mine wastewater was tested as a feed with two different MAC configurations designed to study the effect of thermal gradients on the composition of the recovered crystalline salt product.
Results
Theoretical simulations and MAC tests with artificial brine
The first step of this study consisted of a theoretical simulation using PHREEQC software implementing the Pitzer model, with ionic compositions, density, and pH of the feed solutions reported in the Methods section as input parameters. The objective was to evaluate the predictive ability of the method based on a theoretical framework built on available thermodynamic data, to anticipate the species that can be recovered as a crystalline solid product from a multi-ionic solution such as mining wastewater. Once the saturation index (SI) at incremental concentration factors (CF) was calculated for all ionic combinations that could give rise to solid species at the specified temperature, membrane-assisted crystallization tests were performed with artificial feed solutions to compare theoretical and experimental results.
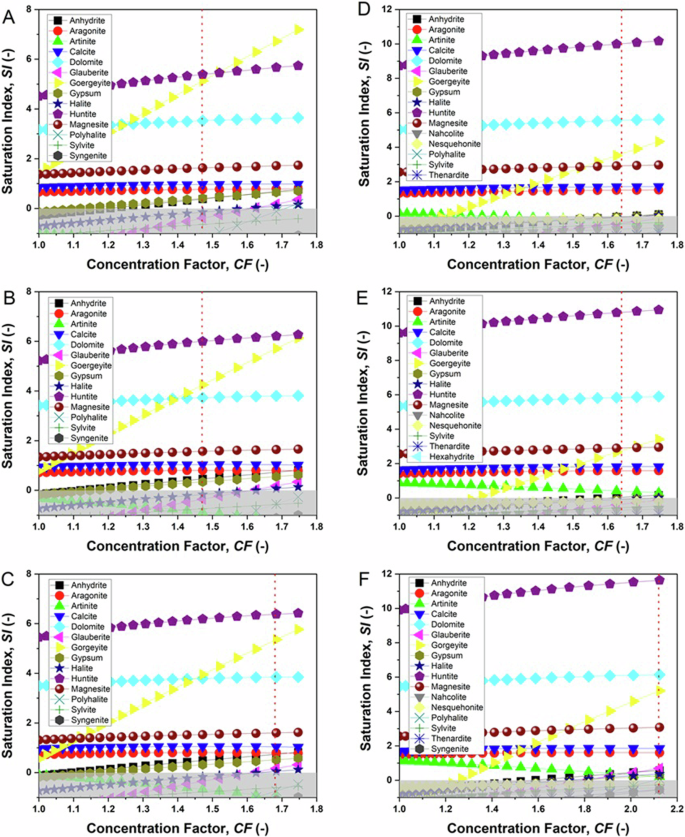
Figure 1A–C show the saturation profiles as a function of the concentration of the solution (up to CF 1.75) for the different species, while Table 1 reports the SI values at the final concentrations reached in the crystallization tests. At 31 °C (Fig. 1A), positive SI curves for six phases are shown over the entire range of solution concentrations, with the Ca/Mg-carbonates huntite and dolomite and the Ca/K-sulphate gorgeyite showing the highest saturation indices for CF > 1.4. The saturation curves for magnesite, aragonite and calcite always extend into the positive region of the graph, in the SI range of 1 to 2. Of note, the saturation curve for sodium chloride (halite) is negative for low concentrations, with a positive slope that brings the curve into the positive range for CF > 1.35; a similar behaviour is observed for calcium sulphates anhydrite and gypsum. Other mixed sulphates glauberite and polyhalite show positive SI values only for concentration factors higher than those obtained experimentally at the end of our tests.

Simulated saturation index (SI) versus concentration factor (CF) for the synthetic hypersaline solution at 31 °C (A, D), 44 °C (B, E) and 49 °C (C, F), before (A–C) and after (D–F) basic treatment of the feed solution. The vertical lines show the concentration factor at the endpoint of the MAC tests. The shaded areas highlight the negative SI region. For simplicity, curves for SI < −1 are not shown.
Moving to 44 °C and 49 °C (Fig. 1B, C, respectively), a shift towards progressively higher SI values is observed for all species, with the exception of gorgeyite, which shows a decreasing solubility trend, magnesite and halite, which have both solubility curves that are less temperature dependent. Therefore, based on the simulations, at all temperatures a similar scenario is observed, where preferential precipitation of Ca, Mg or combined Ca/Mg carbonates and minor contribution of the Ca/K sulphates gypsum and halite is expected.
Membrane-assisted crystallization tests were performed with synthetic feed solutions of the composition shown in Table 5, up to the concentration factor displayed in Fig. 1 at different operating temperatures. The two configurations shown in Fig. 9 were used: the crystallization with the feed solution circulated at a fixed temperature of 49 °C (Fig. 9A), and the configuration with the feed circuit divided into two crystallization vessels held at 44 °C and 31 °C, respectively (Fig. 9B).
Microscopy analysis of the recovered solid samples indicates that the size and shape of the crystals are highly dependent on the operating temperature (Fig. 2A–F). At 31 and 44 °C, the crystal size distributions (CSD) show a bimodal profile (Figs. 2D, E), with the two most frequent crystal sizes at 9–11 and 17–19 µm, and the variation coefficient (CV) of 40.1% and 65.5%, respectively.
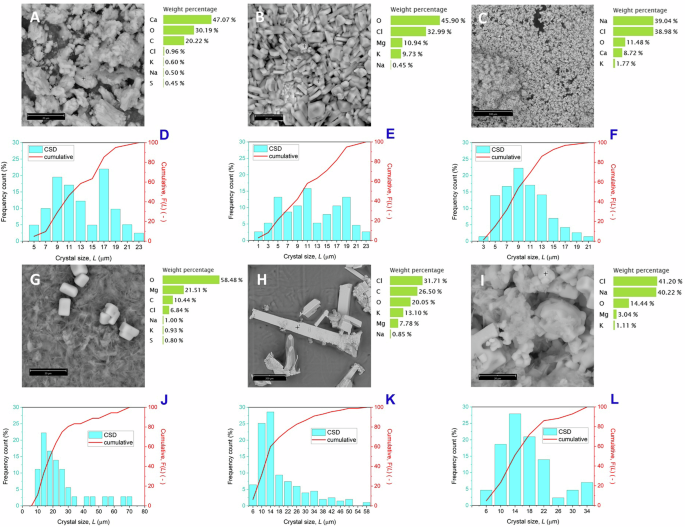
Crystals recovered at the end of MAC tests (28 h) from synthetic hypersaline feed at 31 °C (A, D), 44 °C (B, E) and 49 °C (C, F): scanning electron micrographs with element composition determined by EDX (A–C) and crystal size distribution calculated by elaborating the optical microscopy images (D–F). Crystals recovered from synthetic feed after basic treatment at 31 °C (G, J), 44 °C (H, K) and 49 °C (I, L): scanning electron micrographs with element composition determined by EDX (G–I) and crystal size distribution calculated using optical microscope images (J–L). The SEM images were taken randomly at various points of the samples and do not necessarily represent the most frequent morphology of the crystals that make up the precipitates.
By increasing the crystallization temperature to 49 °C, the shape changes from the predominantly irregular habit (Fig. 2A) seen at lower temperature, to small cubes/square-based prisms (Fig. 2C) with monodisperse size distribution centered around 9 µm (Fig. 2F) and the CV of 44.2%.
The increase in CV for crystals obtained at 44 °C is explained by the increase in the inhomogeneity of the product, being composed of a mixture of multiple crystal species with different habits and aggregation, compared to experiments conducted at 31 °C and 49 °C, where the prevalence of a specific crystalline phase was obtained. EDX analyses suggest that the irregular crystals were composed mainly of CaCO3 while the cubes/prisms were essentially NaCl.
Quantitative PXRD analysis of solid precipitates (Fig. 3A) obtained at the lowest temperature (31 °C) shows a mixture with aragonite as the main component (66.2%), a relatively low amount of halite (14.1%) and Mg-sulphates pentahydrite (6.5%), kainite (3.1%), bloedite (2.9%) and kieserite (1.8%) as minor components, with a small portion of polyhalite (3.1%) and sylvite (2.3%). As a result, the weight content of calcium in the recovered product exceeds 54% of all elements (Fig. 3B), being almost completely (∼99%) included in the aragonite phase.
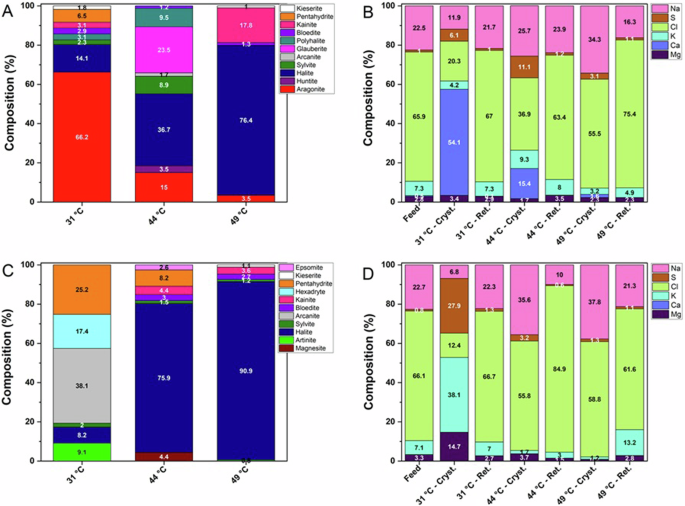
Compositions obtained before (A, B) and after (C, D) the basic treatment of synthetic hypersaline solution at different temperatures, in terms of crystalline phases detected by PXRD (A, C) and corresponding relative elemental composition (excluding C, O and H atoms) (B, D) in the starting solution (Feed), recovered crystals (Cryst.) and mother solution after removal of crystals by filtration (Ret.).
The precipitate recovered at 44 °C was a mixture composed mainly of halite (36.7%), with Ca-sulphate glauberite (23.5%), Ca/Mg sulphate polyhalite (9.5%) and Mg-sulphate bloedite (1.2%), and the carbonates aragonite (15%) and huntite (3.5%) along with a moderate amount of the K-salts sylvite (8.9%) and arcanite (1.7%). At 49 °C, a different composition of the precipitate was obtained, with 76.4% halite, some amounts of Mg-sulphates kainite (17.8%), bloedite (1.3%) and kieserite (1%) co-precipitated as secondary components with only a small amount of aragonite (3.5%).
The results indicated that within the relatively narrow range of temperatures explored in this work, a precipitate with a very different composition was recovered from the artificial feed, going from the prevalence of CaCO3 at the lowest temperature, to the preferential precipitation of NaCl at the highest temperature. While the simulations were not effective in predicting the detailed composition of the solid precipitate, the theoretical work predicted the crystallization of sparingly soluble Ca phases, particularly at lower temperatures, despite the Ca2+ concentration in the starting solution was 6 times lower than that of Mg2+ ions. Therefore, with the aim of reducing the amount of Ca2+ ions, while minimizing the loss of Mg2+, a basic feed treatment was performed by adding NaHCO3 to precipitate calcium as CaCO3 according to the following equilibria:
Based on the initial Ca2+ concentration, the NaHCO3 solution was dosed at 70 °C under continuous stirring to obtain a molar ratio [CO32−]/[Ca2+] > 3, adjusting the pH below 9 (with 1 M NaOH) to avoid the precipitation of Mg(OH)2 (brucite), which occurs at pH>9.332. As assessed by IC analysis, the basic treatment allowed the quantitative removal of Ca2+ with the loss of Mg2+ around 5% wt. With the new composition of the solution obtained after the basic treatment (shown in Table 5), the saturation curves for the three operating temperatures of interest were simulated again (Fig. 1D–F). The corresponding SI values at the concentration factors achieved at the end of the MAC tests are shown in Table 1. Under these conditions, magnesite and halite were the only phases showing positive saturation values for CF > 1.4. Also in this case, the simulations did not predict substantial differences at the three different temperatures.
Morphological analyses of the precipitates showed that bounded needle-like crystals were the most frequently observed shape at the lowest temperature, the composition of which contains relatively high amounts of magnesium (Fig. 2G). By increasing the crystallization temperature, the size of the crystals does not change significantly, remaining around 14 µm as the most frequent value (Fig. 2J–L), while the CSD is rather large, with CV of 75.4%, 80.1% and 46.4% at 31 °C, 44 °C, and 49 °C, respectively.
PXRD analysis of the solid precipitates (Fig. 3C) revealed that at 31 °C the most abundant component was arcanite (38.1%), with the Mg sulfates pentahydrite (25.2%) and hexahydrite (17.4%) and Mg carbonate artinite (9.1%) (tiny needle-like crystals shown in Fig. 2G) as the main magnesium-containing phases, while halite (8.2%) and sylvite (2%) were obtained as additional components. In these conditions the solid product mainly contains magnesium (14.7%), potassium (38.1%) and sulfur (27.9%), together with smaller quantities of chlorine (12.4%) and sodium (6.8%) (Fig. 3D).
The precipitates obtained at 44 °C and 49 °C were mainly composed of NaCl, with components containing Mg (mainly sulfates) decreasing their contribution with increasing temperature. At 49 °C, the amount of halite (Fig. 2I) reached approximately 91% with only minor amounts of Mg sulfates (⁓7%) and carbonates (⁓2%). In particular, while at the highest temperatures the basic pretreatment did not substantially influence the composition of the precipitate compared to the untreated feed, the crystalline product obtained at the lowest temperature turned from a solid containing predominantly calcium into a product composed of an excess of magnesium and potassium.
Experiments with real mine-tailing wastewater
The mining wastewater extracted from the collector in the district of Castelgalì (Spain), was fed to the MAC equipment of Fig. 9. The preventive evaluation of the actual composition of the feed by ion chromatography (Table 5) was necessary to simulate the SI vs. CF curves at the crystallization temperatures of interest for this work (Fig. 4A–C) from PHREEQC software. The values of SI at the final solution concentration obtained in crystallization tests are given in Table 2. The simulations described a similar situation for the real feed compared to the artificial solution (Fig. 1A–C) before the basic treatment, with the slight downward translation for all curves, due to the lower magnesium content. Given the similarity in ionic composition and saturation curves, the crystallization result was also expected to be comparable at all temperatures. Therefore, Ca/Mg carbonates huntite, dolomite, magnesite, calcite, aragonite, and K/Ca-sulphate gorgeyite are expected to precipitate from real solutions, with the appearance of sulphates anhydrite, gypsum, glauberite, and halite showing a reduced thermodynamic tendency to appear.
Simulated saturation index (SI) versus concentration factor (CF) for real wastewater at 31 °C (A, D), 44 °C (B, E) and 49 °C (C, F), before (A–C) and after (D–F) the basic treatment of the feed solution. The vertical lines show the concentration factor at the endpoint of the MAC tests. The shaded areas highlight the negative SI region. For simplicity, curves with SI < −1 are not shown.
Similar to what was observed with artificial solutions, crystallization from real wastewater produced at 31 °C mainly aggregated and irregularly shaped particles with bimodal size distribution (Figs. 5A, D) and a coefficient of variation of 54.3%. At 44 °C, the number of irregular crystals decreased while small cubes appeared with the crystal size decreasing to ~10 µm and CV of 39.5% (Fig. 5B, E). The precipitates obtained at 49 °C were mainly composed of NaCl cubes less than 10 µm in size (Fig. 5F), with some aggregated prismatic crystals of high aspect ratio and containing calcium and sulfur (Fig. 5C).
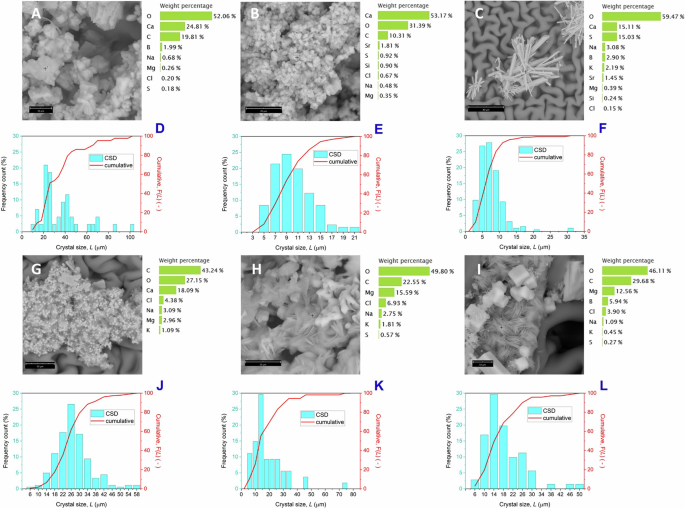
Crystals recovered at the end of MAC tests (28 h) from real mine wastewater at 31 °C (A, D), 44 °C (B, E) and 49 °C (C, F): scanning electron micrographs with element composition determined by EDX (A–C) and crystal size distribution calculated by optical microscopy images (D–F). Crystals recovered from synthetic feed after basic treatment at 31 °C (G, J), 44 °C (H, K) and 49 °C (I, L): scanning electron micrographs with element composition determined by EDX (G–I) and crystal size distribution calculated using optical microscope images (J–L). The SEM images are taken randomly at various points of the samples and do not necessarily represent the most frequent morphology of the crystals that make up the precipitates.
Based on PXRD analyses, crystals precipitated from the real feed at the lowest temperature (31 °C) contain >87% aragonite (Fig. 6A) and approximately 10% gypsum, with kieserite (1.8%) and halite (1%) as minor components. This allows recovery of a solid product containing >91 wt.% calcium (Fig. 6B). By increasing the crystallization temperature, the amount of aragonite progressively decreases (45.5% at 44 °C and 8% at 49 °C), while the NaCl content increases correspondingly to 39.5% and 69.8%, respectively, with a certain amount of gypsum found at the highest temperature (Fig. 5C).
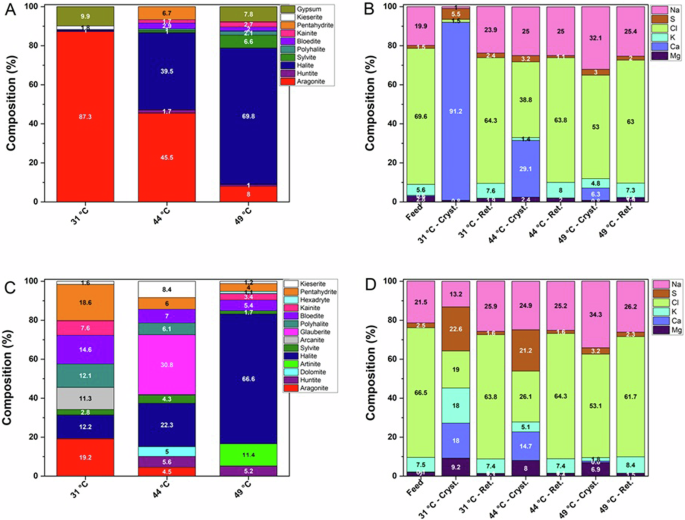
Composition obtained before (A, B) and after (C, D) basic treatment of real mine wastewater at different temperatures, in terms of crystalline phases detected by PXRD (A, C) and corresponding relative elemental composition (excluding C, O and H atoms) (B, D) in the starting solution (Feed), recovered crystals (Cryst.) and mother solution after removal of crystals by filtration (Ret.).
The basic treatment of the real feed proved to be less effective in removing calcium compared to the synthetic case, allowing the Ca2+ content to be reduced by >80% wt., with a loss of Mg2+ quantifiable as ⁓30% wt. The new solution composition reported in Table 5 was used as input to simulate the saturation curves of Fig. 4D–F. Due to incomplete Ca2+ removal, the simulations for treated and untreated wastewater appear very similar, with the notable shift towards higher SI values for all Ca/Mg carbonates artinite, calcite, aragonite, magnesite, dolomite and huntite, and downward migration to lower SI for the curves of sulfates goergeyite, anhydrite, gypsum, glauberite and for halite.
The crystals obtained at 31 °C were heterogeneous in shape, with a typical size distribution centered around 26 µm (Fig. 5J), probably due to some aggregation, and CV of 30.2%. At 44 °C the particle size distribution of the crystals worsens (Fig. 5K), reaching a CV of 72.8% with a heterogeneous composition of different particle shapes and sizes. For a crystallization temperature of 49 °C, the precipitate was consistent with an increased amount of NaCl cubes, embedded to some extent within bounces of Mg-rich needles (Fig. 5I), and a CSD with a CV of 53.6%, centered around 14 µm (Fig. 5L).
Based on PXRD analysis, it was shown that calcium-containing phases were still obtained (Fig. 6C), despite the treatment step, due to incomplete removal of Ca2+. At the lowest temperature, the product was composed of a mixture of many salts including Ca/Mg sulfates pentahydrite (18.6%), bloedite (14.6%), polyhalite (12.1%), kainite (7 .6%) and kieserite (1.6%) and K phases arcanite (11.3%) and sylvite (2.8%), with halite (12.2%) and aragonite (19.2%), so that similar amounts of calcium (18%), potassium (18%), chlorine (19%) and sulfur (22.6%) were obtained, with a magnesium content of 9.2% (Fig. 6D).
By increasing the temperature to 44 °C, Ca/Mg sulfates were still the dominant species with glauberite (30.8%), Mg and Mg/Ca sulfates kieserite (8.4%), bloedite (7%), pentahydrite (6%), polyhalite (6.1%) and Ca and Mg carbonates huntite (5.6%), dolomite (5%) and aragonite (4.5%), with halite (22.3%) and sylvite (4.3%). This allowed us to recover a solid product containing 14.7% calcium (about 84% less than real untreated feed) and 8% magnesium. At the highest temperature, excessive halite precipitation ( ~ 67%) provided a solid product containing mainly sodium and chlorine and a small amount of magnesium (6.9%), included mainly in artinite crystals (Fig. 5I).
Discussion
Quantitative and qualitative analysis of the solid precipitates recovered after the MAC experiments revealed that for both synthetic and real untreated solutions, CaCO3 was the most abundant phase at the lowest temperature (31 °C), while the prevalence of NaCl was observed at 49 °C. This result is inconsistent with the simulations that generated the highest saturation curves reported in Fig. 1A–C and Fig. 4A–C for huntite, dolomite, goergeyite and magnesite, without substantial variations across the temperature range investigated, while these species were hardly obtained in crystallization tests. Furthermore, the saturation curves of halite always lie below those of the CaCO3 polymorphs calcite and aragonite, with the solubility of NaCl slightly increasing with temperature and that of CaCO3 decreasing to some extent. In particular, among the anhydrous polymorphs of CaCO3, the metastable aragonite phase was obtained selectively for all conditions, although calcite is the most stable form at the temperatures considered33.
The exclusive formation of aragonite can be explained by the contribution of surface energy to the Gibbs free energy barrier for nucleation in the presence of relatively high concentrations of Mg2+ ions in solution34,35,36. It is known that for the concentration ratios [Mg2+]/[Ca2+] > 2, the increase in surface energy due to the adsorption of Mg2+ onto calcite increases the nucleation energy barrier, thus drastically inhibiting calcite formation37,38. In our study, the ratio [Mg2+]/[Ca2+] was ~6 in synthetic feed and ~5 in real wastewater, thus influencing polymorphic selection towards the formation of the metastable aragonite phase. The higher recovery of CaCO3 for the real feed compared to the synthetic solution is due to the higher initial Ca2+ concentration ( ~ 10%) and the larger concentration factor achieved at the end of the crystallization tests with real wastewater.
Similar to untreated feed solutions, MAC experiments with basic-treated hypersaline solutions provided a progressively increasing amount of halite as temperature increased, although the saturation curves of Fig. 1D–F and Fig. 4D–F suggested the crystallization of magnesite as the main magnesium-containing solid component. Furthermore, Mg-containing hydrated phases pentahydrite, hexahydrite, bloedite, polyhalite, kainite and artinite were obtained despite their low saturation curves. In this case, quantitative calcium removal was crucial to increase the amount of magnesium recovered from crystallization processes, as demonstrated by the precipitation of significant amounts of calcium sulphates from real wastewater, due to incomplete removal of Ca2+ ions.
In the case of synthetic feed, the complete removal of Ca2+ allowed the recovery at the lowest temperature of a solid product enriched in Mg (14.7%) and K (38.1%), which precipitated mostly as sulphates, while at 49 °C the preferential precipitation of NaCl with a purity greater than 91% by weight was obtained. In addition to the possible intrinsic limitations of the theoretical model implemented for such complex multi-ionic solutions, the substantial inconsistency between the simulated saturation curves and the actual composition of the precipitates cannot be explained on a purely thermodynamic ground, suggesting that crystallization in MAC experiments is controlled by kinetics rather than thermodynamics, where temperature plays an important role to achieve effective results.
According to the classical nucleation theory (CNT)39, the formation of a new thermodynamic solid phase from a solution (homogeneous) is an activated process whose energy barrier (({Delta G}_{{HON}}^{* })) is given by:
where γln [J/m2] is the interfacial energy between the liquid and the nucleus, kB is the Boltzmann constant (1.38×10⁻²³ J K−1), T [K] is the absolute temperature, Ω [m3] is the volume of a crystal unit (i.e., the molar volume divided by the Avogadro’s number), and σ is the chemical potential difference, that is defined as:
The nucleation rate N (number of nuclei per unit volume per unit time), can be expressed by:
where A [m−3 s−1] is a kinetics factor40.
Possible kinetics contributions can be exemplified by estimating the Gibbs free energy barrier for nucleation (ΔG*) and comparing it to the kBT term, since the magnitude of the energy barrier with respect to this thermal energy is a crucial factor in determining the number and nature of particles produced41. Based on Eq. 1 & 2, for a constant ion activity product, temperature influences the nucleation energy via inverse quadratic proportionality with the kBT term and via the temperature dependence of Ksp. However, in the temperature range considered in this study, the slopes of the solubility curves for both CaCO3 and NaCl are rather flat, while the increase in thermal energy is only 6% going from 31 °C to 49 °C.
Therefore, using literature data for γln and Ω38,42, we calculated the homogeneous nucleation (HON) energy barrier for aragonite and halite at different temperatures. The data are reported in Table 3 and show that at 31 °C, ({Delta G}_{{HON}}^{* }) of aragonite and halite is of the same order of magnitude for the untreated synthetic solutions, while NaCl is unsaturated for the real feed. Moving to 49 °C, the energy barrier of aragonite decreases by 14% and 20% for synthetic and real solutions respectively, while that of halite decreases by approximately 85% for synthetic solutions while in real wastewater the halite becomes saturated. Therefore, at such temperature, the nucleation barrier of aragonite becomes 25 and 1.5 times larger than that of halite for synthetic and real feeds, respectively, thus justifying the preferential precipitation of NaCl at the higher temperature.
For basic-treated synthetic solutions, complete removal of Ca2+ ions by precipitation as CaCO3, allowed crystallization at the lower temperature of hydrated Mg sulphates. By moving to 49 °C, the energy barrier of halite decreased by 75%. For real solutions, the precipitation of aragonite at 31 °C was due to incomplete removal of Ca2+, while halite was unsaturated. At 49 °C, although the energy barrier of aragonite is decreased by ~25%, halite becomes saturated with the ratio ({Delta G}_{{HON},{aragonite}}^{* }/{Delta G}_{{HON},{halite}}^{* } sim 18). Based on these calculations, the different precipitation trends of CaCO3 and NaCl within the investigated temperature range could be explained by the undersaturation of NaCl at the lower temperature and by the lower nucleation energy barrier for halite at 49 °C.
Inspection of the membrane at the end of the MAC tests revealed that the surface was covered with a thin layer of loosely attached crystals. This crystalline product was completely recovered by rinsing the membrane with the retentate, leaving the surface clean, as shown by SEM analysis (Fig. 7). This observation supports the hypothesis that the crystals did not nucleate heterogeneously on the membrane but were eventually formed in the bulk solution and then deposited on the membrane surface, transported by the flowing liquid. However, the data in Table 3 indicate that for all conditions, ({Delta G}_{{HON}}^{* }) is from 3 to 4 orders of magnitude larger than kBT, suggesting that the hypothesis that nuclei have enough thermal energy to grow beyond the critical size, thus exceeding the energy barrier for homogeneous nucleation, is rather questionable43.
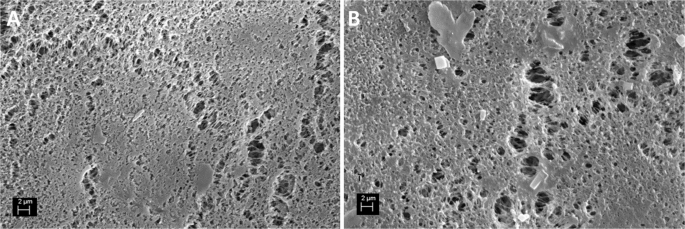
Surface before MAC test (A) and after a crystallization test and rinsing with deionized water (B).
Furthermore, heterogeneous nucleation on the membrane surface and/or on other exogenous surfaces present in the bulk solution (such as impurities or colloidal particles), is much more common than homogeneous one44 and could substantially contribute to reducing the energy barrier and its temperature dependence. The free energy barrier for heterogeneous nucleation (({Delta G}_{{HEN}}^{* })) is related to the homogeneous term by the following relation, valid for porous surfaces45:
where ε is the surface porosity (varying from 0 and 1) and θ is the contact angle between the nucleus and the surface. θ is defined by the Young’s equation:
with γln the liquid−nucleus, γls the liquid−surface, and γsn the surface−nucleus interfacial energies. As θ varies from 0° to 180°, the ratio ({Delta G}_{{HEN}}^{* }/{Delta G}_{{HON}}^{* }) ranges between 0 and 1. Therefore, ({Delta G}_{{HEN}}^{* }) is always smaller than ({Delta G}_{{HON}}^{* }) which indicates that heterogeneous nucleation is always kinetically more favourable than homogeneous nucleation. Since accurate evaluation of θ is not trivial, we used the values of 139.5° and 136.4° measured for synthetic and real feed solutions, respectively, on hydrophobic polypropylene membrane of surface porosity 70%.
Although the calculated energy barrier for nucleation on the membrane is always lower than in the homogeneous case (Table 3), the values of ({triangle G}_{{HEN}}^{* }) are still several orders of magnitude higher than the thermal energy. This suggests that the formation of both aragonite and halite crystals recovered in the crystallization vessel is unlikely to be triggered by heterogeneous nucleation at the membrane surface46, in agreement with recent studies that have shown that the nucleation mechanisms underlying bulk crystallization are distinct from nucleation within the solution/membrane boundary layer which could eventually lead to scaling47.
Based on this assumption, we then calculated ({triangle G}_{{HEN}}^{* }) by considering heterogeneous nucleation on a solid and non-porous (ε = 0) surfaces which would be wetted (θ = 10°) by the nascent nucleus. Table 3 contains such calculations where it is demonstrated that the nucleation energy barrier is typically comparable to or lower than the kBT term, thus supporting the assumption that heterogeneous nucleation on exogenous solid surfaces is the main control of the nucleation step.
The data reported in Table 4 show that the waiting time estimated by turbidimetric monitoring, is between 35 and 96 min from the start of the experiments. Based on the measured transmembrane fluxes, this means that the solution concentration at which the first crystals were observed was 1–3% higher than at the initial feed. Since heterogeneous nucleation is generally initiated at low supersaturation48, the experimental results support the possibility that heterogeneous mechanism was dominant in our MAC tests49.
Figure 8 shows the composition of the crystalline precipitates with the saturation index of the corresponding species. It is notably that the species contained in larger quantities have SI values (calculated at the CF obtained at the end of the crystallization tests) around 0, while species with SI ≥ 1 were rarely obtained. This is particularly evident for untreated and higher-temperature solutions. Furthermore, solid phases characterized by a large negative SI ( < −1) were accidentally observed only for pre-treated solutions and at the lowest temperature. Since SI values close to 0 are related to species of greater solubility (less stable), it is argued that the crystallization performed in our systems preferentially provides kinetic products in which metastable phases are the first to appear through a heterogeneous nucleation mechanism supported by exogenous solid surfaces dispersed in bulk solutions, while species with a strong thermodynamic tendency to precipitate are inhibited, due to solute depletion.
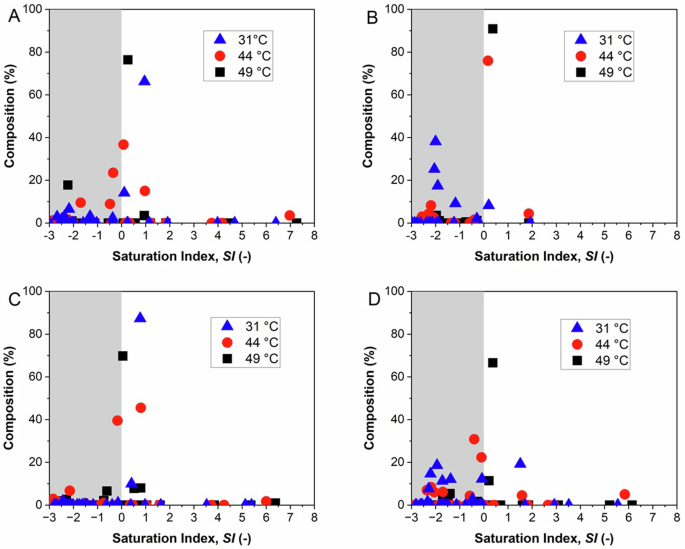
SI calculated at the effective concentration factors at the end of the crystallization tests for the component species and at the different temperatures, for hypersaline synthetic solution (A), synthetic solution after basic treatment (B), real wastewater from mines (C), real wastewater after basic treatment (D). The shaded areas highlight the negative SI region.
Furthermore, by comparing the crystallization results obtained under different conditions and theoretical predictions, it can be deduced that, while CNTs offer the starting point to describe the system studied, more sophisticated models are needed to define the complexity of the events related to nucleation in multi-ionic solutions such as hypersaline brines. The possibility that a system follows a specific path is difficult to predict with current knowledge, since the complex kinetics and numerous factors that govern the formation of metastable species driven by heterogeneous contributes pose a considerable difficulty in theoretical treatments.
In conclusion, this work demonstrated that within a relatively narrow range of operating temperatures, several crystalline salt minerals can be produced from real mine wastewater using MAC: at 31 °C, the solid product contained up to 87% by weight of CaCO3 (and >91% in calcium) in the form of metastable polymorphic aragonite; with the operating temperature increased to 49 °C, the solid precipitate contained predominantly NaCl (∼70%). Feed conditioning by basic pre-treatment was found to have a notable influence on the outcome of the crystallization process, being strongly dependent on the efficiency of Ca2+ ion removal. Experiments with synthetic brine have shown that quantitative removal of calcium allows the recovery of a precipitate containing 15% magnesium and 38% potassium.
Although our results are in accordance with recent studies demonstrating that the nucleation mechanisms underlying bulk crystallization in MAC are distinct from nucleation occurring in the boundary layer of the feed-membrane, heterogeneous nucleation effects mediated by dispersed impurity particles would affect the free energy barrier, thus allowing metastable or near-equilibrium species to precipitate soon after the solution begins to concentrate. These kinetic effects are believed to be at the origin of the inconsistencies between the theoretical prediction based on simulation work implemented on a purely thermodynamic ground and the observed composition of the solid products, calling for more sophisticated models to describe the complexity of the system.
Finally, based on the results of this work (process and conditions), we propose a new treatment scheme for the recovery of the valuable magnesium and potassium salts in a circular economy scenario, which can contribute to solving the problem of pollution resulting from mine tailing waste. The proposed approach represents an ecologically sustainable and technologically efficient process based on membrane-assisted crystallization, to be explored in the future on a larger scale to promote the green development of different industries.
Methods
Materials
Sodium chloride (NaCl, 27810.295, from VWR Chemicals), sodium hydrogen carbonate (NaHCO3, 1.06329.1000, from Merck), sodium sulfate (Na2SO4, 13464, from Honeywell – Fluka), calcium chloride bihydrate (CaCl2·2H2O, C/1500/53, from Fisher Scientific), magnesium chloride hexahydrate (MgCl2·6H2O, 1.0583.1000, from Merck), potassium chloride (KCl, 26764.298, from VWR Chemicals) and magnesium sulfate heptahydrate (MgSO4·7H2O, cod. 13142, from Honeywell—Fluka) were used as received to prepare synthetic hypersaline solutions of compositions reported in Table 5 (Synthetic). MilliQ water (0.05 µS/cm) was used to prepare artificial feed solutions and as condensing fluid on the distillate side in the MAC equipment. Commercial polypropylene (PP) membranes (Accurel PP 2E HF, nominal pore size 0.2 µm, overall porosity 70%) were purchased from Membrana GmbH (Wuppertal, Germany). The real mine tailing wastewater (Real) was collected from the brine collector in Castellgalí (Spain) and pre-filtered by PES membranes with nominal pore size of 0.45 µm prior to crystallization tests. Table 5 reports the ion concentration of both synthetic and real feed.
Simulations
Theoretical simulations were performed by PHREEQC (https://www.usgs.gov/software/phreeqc-version-3) software which generated the activity coefficient for high salinity solutions by implementing the Pitzer model50. The input parameters were the ion concentrations, temperature, density and pH of the feed solutions. The simulations provided saturation index (SI) curves as a function of solution concentration for the possible species that can form from the ionic combinations as the solvent is gradually removed from the initial solution.
The SI compares the ion activity product (IAP) with the solubility product (Ksp), based on the following relation:
SI values provide indications on the thermodynamic tendency of a certain specie to precipitate in the considered conditions: for SI < 0, Eq. 6 indicates that the solution is unsaturated with respect to that specie; for SI > 0, the solution is supersaturated and that specie is expected to crystallize. Therefore, SI values could help predict the solid phases emerging after crystallization as long as the solvent is removed across the membrane in the MAC process.
Membrane-assisted crystallization tests
The experimental lab-scale setup schematically illustrated in Fig. 9 consists of a nylon membrane module hosting a commercial hydrophobic flat sheet membranes with a total active area of 24 cm2; a two-channel peristaltic pumps (Masterflex L/S digital drive, 7524-50, with easy-load pump heads, from Cole-Parmer, USA); two graduated cylinders for monitoring feed and distillate volume variations; three thermostatic baths (F32, Julabo, Germany) for the feed and distillate side; a technical balance to measure the increase in distillate weight due to water recovery from the feed; on-line conductivity sensors (CONDS-N-025, PendoTECH, USA) placed at the outlet of the membrane module and connected to a datalogger (CMONT, PendoTECH, USA); K-type thermocouples connected, to a multi-channel thermometer (SPER Scientific, 800024), to read temperature at the inlet and the outlet of the membrane module and within the distillate and feed solutions vessels; pressure sensors (PREPS-N-025, from PendoTECH, USA) connected to a monitor (PMAT2A, from PendoTECH, USA), to measure pressure at the inlet of the feed and distillate of the membrane module; a turbidity measurement system consisting of a compact on-line UV-VIS-NIR 280–880 nm dual-wavelength photometer (SPEC-L-2-280-880-PHOTO, from PendoTECH, USA) with a flow cell having 1 cm path length (SPECPS-N-025, from PendoTECH, USA) integrated into the feed line and directly connected to the photometer by fiber optics and a monitor (PMAT2A). Turbidity monitoring allows to detect the waiting time for crystallization, indicating the elapsed time between the creation of the supersaturation and the appearance of the first detectable nuclei. The flow rate was set at 60 mL/min (v = 4.8×10⁻³ m s−1) for both feed and distillate solutions to allow working in laminar regime (Re around to 30). Based on preliminary experiments, this fluid dynamic condition represents a compromise that allows a moderate transmembrane flux associated with a supersaturation generation rate that avoids excessive nucleation and a retention time that allows crystallization in a time interval of 24–28 h.
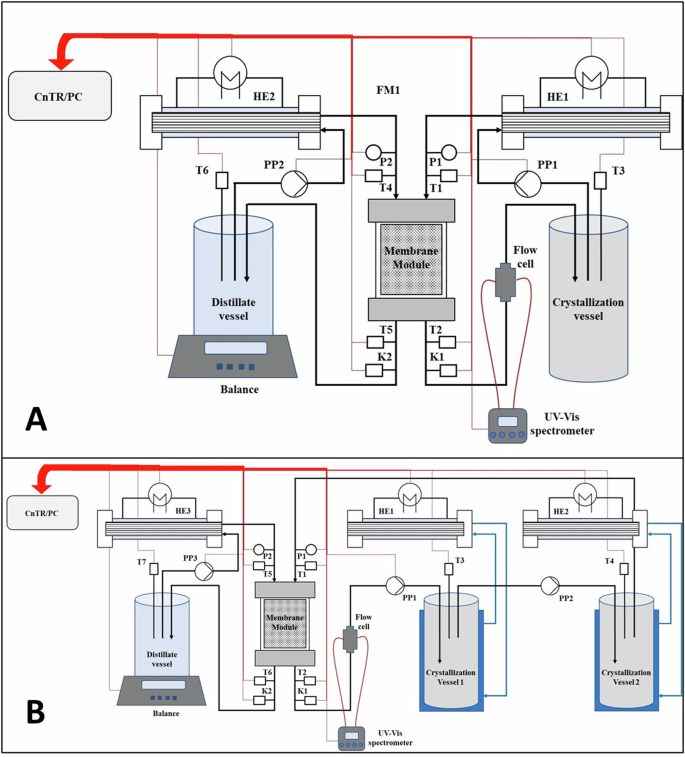
Experiments performed with two different configurations: feed solution is circulated at constant temperature of 49 °C (A); the feed solution line is broken down in two crystallization stages working at the same concentration factor but different temperature: 31 °C and 44 °C (Tx: temperature probes; Kx: conductivity probes; Px: pressure sensors; PPx: peristaltic pumps; HEx: heat exchangers; CnTR/PC: programmable logic controller connected to a PC) (B).
Experiments were performed by using the two MAC equipment configurations showed in Fig. 9; in Fig. 9A, the feed and the distillate solutions, with a starting volume of 0.25 L each, were circulated at a nominal temperature of 49 °C and 10 °C, respectively (further details can be found elsewere51). In Fig. 9B, the feed line was broken down into two crystallization chambers working at different temperature: 31 °C and 44 °C. This approach allowed to differentiate the crystallization at the two temperatures while keeping the same concentration factor in both vessels.
MAC tests were performed with hypersaline artificial or real mine tailing wastewater before and after basic treatment (BT), having the ion compositions reported in Table 5.
The pH and conductivity of the feed and distillate prior the tests and at the end of the MAC experiments were measured by a pH/conductivity meter (Orion Star A215, from Thermo Scientific). The water transmembrane flux Jw [kg m−2 h−1] was evaluated by monitoring the increase in the distillate weight every 30 min and taken as the average value under steady conditions (normally after the first hour of operation), calculated as:
where ΔMd [kg] is the increment in mass of distillate, Δt [h] is the distillation time and Am [m2] is the active membrane area. The solute rejection R [%] was determined as:
where Cd and Cf [g L−1] are the distillate and the feed salt concentrations, respectively, that were estimated after mass balance by measuring the electrical conductivity of the solutions. Each MAC test lasted 28 h.
Optical microscopy
At time intervals of 6, 24 and 28 h, a sample (0.5 mL) of the feed was withdrawn from the crystallization vessel(s) and visually examined by optical microscope (Eclipse LV100ND, from Nikon) to determine the crystal size distribution (CSD). At the end of the tests, crystals were recovered by vacuum filtration using a polyethersulfone (PES) membrane (Durapes, nominal pore size 0.2 µm, from Membrana GmbH, Wuppertal, Germany), washed with ethanol, dried in a thermobalance to estimate the amount of crystal recovered per unit volume of mother liqueur (magma density), and then stored in a desiccator before powder X-ray diffraction (PXRD) analyses. The crystal size distribution was calculated by processing the pictures by using the ImageJ software. The coefficient of variation (CV), representing the dispersion of the size distribution curve around the mean size, was calculated by the following relation:
where L is the crystal size as in the F(L) curve at the specified percentage52.
Scanning electron microscopy (SEM)
A qualitative characterization of crystals was carried out by scanning electron microscopy (SEM) (Pro X desktop SEM from Phenom) equipped with a backscattering detector (BSD-Phenom-World B.V., Eindhoven, the Netherlands). Prior of SEM analyses, all samples were sputter-coated (1 min cycle) with a thin layer of gold using a Quorum Q150 RS sputter machine (Quorum Technologies Ltd, Ashford, Kent, England) to minimize the charge and improve the image quality. Elemental analyses were performed with an energy dispersive X-ray spectroscopy detector (EDX) and the Phenom Elemental Mapping Software.
Ion chromatography (IC)
To quantify ion composition, the starting feed solutions and dissolved solid precipitates obtained from experiments were analyzed by ionic chromatography (Dionex Integrion HPIC from Thermo Fisher Scientific, USA) equipped with a conductimetric detector. Anion’s concentration was determined using a Dionex IonPacTM AS22-Fast-4 μm 2×150 mm analytical column with suppressor (Dionex AERS 500 carbonate 2 mm) and sodium carbonate/sodium bicarbonate solution as eluent. Cation analysis were performed by a Dionex IonPacTM CS16-Fast 4 μm analytical column with suppressor (Dionex CERS 500, 2 mm) and methanesulfonic acid as eluent. Before analysis, samples were filtered with 0.45 µm pore size PES membrane and subsequently diluted to the desired concentration range with MilliQ water.
Qualitative and quantitative powder X-ray diffraction analysis
Powder X-ray diffraction (PXRD) profiles were collected by using a Rigaku Rint2500 laboratory diffractometer with a rotating Cu anode. The instrument operated at 50 kV and 200 mA in Debye-Scherrer geometry. The diffractometer is equipped with an asymmetric Johansson Ge (111) crystal to select the monochromatic CuKα1 radiation (λ = 1.54056 Å) along with the silicon strip Rigaku D/teX Ultra detector. The data were collected in the range of 5 to 100˚ (2ϑ) with a step size of 0.02˚ (2ϑ) and a counting time of 6 s/step. To perform the measurements, each powder sample was introduced in a glass capillary with a diameter of 0.5 mm and mounted on the goniometer’s axis. The capillary was rotated during the measurement to enhance the randomization of the individual crystallites’ orientations and minimize the potential impact of preferred orientation.
As a first step, collected PXRD profiles were processed with the computer program QualX2.053 to perform crystal phase(s) identification. The software can query the commercial PDF-2 database54 and the freely available POW_COD database. QualX2.0 searches for the phase(s) belonging to the database best matching the experimental pattern, via a search/match approach using the list of experimental values of interplanar d-spacings (derived from the diffraction angle) and peak intensities.
As a second step, the crystal phases identified by qualitative analysis were used to perform quantitative analysis. Given the number of crystal phases present for each brine mixture, this was performed by using two different approaches: the Rietveld refinement process using the EXPO software55, which was used to validate the crystal phase composition and to perform a graphic inspection of the differences between measured and calculated profiles, and the computer program QUANTO56, which was used for robust weight fraction assessment on selected crystal phases.
The main difficulties encountered were the complexity of crystal phase composition of the brine mixtures and the prevalence of the NaCl phase in most of them, which hides the signal coming from the minority phases in the diffraction profile.
Responses