Perceptible climate warming amplifies how education increases climate concern in the US

Introduction
With a majority of Americans now believing that climate change is caused by human activities, two prominent predictors of concern in the US are the level of education1,2,3 and perceptible climate change that people experience4,4,5,6,7,8,9,10,11. This concern is moderated by political affiliations12,13,14, economic situations15, value and belief systems2,14,16,17,18,19. In the US, where the two main political parties have quite different climate mitigation platforms, climate concern strongly predicts political affiliation20.
In contrast to these factors that correlate with climate concern, education arguably serves as the more causal factor, by equipping people to understand climate science as a means of explaining observable change16. In advanced economies, people with more education are more likely “to say they are willing to adjust their lifestyles in response to the impact of climate change”21.
Here, we propose that the effect of education should increase with local climate warming. Under this hypothesis, the concern increases due to observable climate-related events9,10,11 combined with education5. Education acts like a lever, in that the higher the average education level in a population, the more climate concern will increase in response to local climate change.
We address this hypothesis by combining data, at the US county level, on climate concern, education level, and health risks of increased heat, together with a measure of climate warming in the state over the last decade.
Data for climate concern use the 2023 county-level estimates from the Yale Program on Climate Change Communication (YPCCC). Since the YPCCC climate opinion data, consisting of 73 related opinion estimates, are highly correlated, we reduced the dimensions through principal component analysis. This yields one major principal component, PC 1, which captures 40% of the variance in the county-level data of YPCCC 2023, with loadings that are clearly indicative of concern about climate change (see Supplementary Table S2). We refer to the PC 1 score as the “climate concern” estimated in each county.
For education levels, we use US Census 5-year (2018-2022, county-level) estimates of percentage bachelor’s degrees for adults 25 and over (see Methods and Data Availability). We also test for an effect at other levels of educational attainment, from 9th grade to graduate degrees.
As a measure of warming, we use the aggregated statistic of mean temperature increase, which serves as a proxy for the more episodic, tangible change that people experience21. A rising mean temperature leads, for example, to more frequent hot summer days6, increased wildfires, flooding, and storm activity22,23, along with prolonged droughts and heatwaves24, and shifting seasons11,25. In Wisconsin, an increase by less than 2 ∘C since 1950 has brought more frequent days above 30 ∘C, heat indices exceeding 40 ∘C, and lakes freezing later in winter. Florida has seen increased hurricane activity, tidal flooding and severe heavy rainfall events.
As a parsimonious proxy for perceptible recent warming, we define “state-level warming” as a fractional measure that compares the past decade of warming in the state to a baseline average. For each state, we use the average the past ten years (2014–2023) of temperature anomaly determinations (in ∘Celsius) determined by NOAA26, Ta, which we then divide by (bar{T}), the mean annual baseline (from 1971 to 2000) temperature (∘C) throughout the state. Since this fraction, (W={T}_{a}/bar{T}), varies geometrically—for a 1 °C increase, it would be 0.2 in Maine (annual ave 5 ∘C) but only 0.05 in Florida (ave 21.5 ∘C)—we take its logarithm, (ln (W)), as human intuition of such statistics tends to be logarithmic27. As a comparison, we also add the Heat and Health Index (HHI) from the US Center for Disease Control and Prevention to capture “communities where people are most likely to feel the effects of heat on their health”28.
Results
First, we confirmed the expected correlation among US counties between education level (% bachelor’s degrees for adults 25 and over) and climate concern (PC 1 from YPCCC 2023), among US counties. Among the 3048 US counties for which data exist on both variables, the regression slope is 0.0390 ± 0.0009 (adjusted r2 = 0.389, F1,3048 = 1944, p < 0.000001). The Pearson correlation is r = 0.624; we label this correlation as the “education effect”, as a proxy for the degree to which concern about climate change increases with education level. This education effect increases modestly with the age of the cohort (Table 1 and Supplement Table S1).
Second, we confirm that climate concern (PC1) is well-correlated with politics in the US. Across the 3048 US counties, the correlation between PC1 and percent Democratic vote in the 2020 election (Supplementary Figure S1) is so strong (Pearson’s r = 0.91) that we approach party vote and climate concern as very nearly proxies for each other. Although the residual climate concern after regressing against Democratic vote is relatively small, we test effects on residual climate concern, below.
Next, we determine the education effect in each of 43 US states as the correlation between education level and climate concern, among the counties of each state (seven US states do not have enough counties to derive this statistic: AK, CT, DE, HI, RI, DE). As US states differ considerably in climate, we can compare the state-level education effects to mean annual temperature in the respective states. Figure 1a shows that the education effect decreases with mean annual temperature (slope = − 0.0219 ± 0.0074, F1,43 = 8.8, adjusted r2 = 0.1504, p = 0.0049). We propose that education effect decreases with mean annual temperature because recent climate warming has been more perceptible in colder climates of the US. Consistent with this, state-level warming, a relative measure, predicts education effect (Fig. 1b). For the linear model between state-level warming and education effect, the coefficient is 0.217 ± 0.060 (adjusted r2 = 0.211, F1,43 = 12.8, p < 0.001). Fitting a linear model between W and education effect yields a coefficient of 0.918 ± 0.30 (adjusted r2 = 0.159, F1,43 = 9.31, p < 0.004). These correlations indicate that education increases how state-level warming engenders climate concern. Re-calculating this for different levels of educational attainment (Table 2) suggests the effect manifests at high-school level and above.

a Education effect (see text) in 43 states versus mean annual temperature (Celsius) in the state. b Relationship between the education effect and the logarithm of the warming fraction measure, W, for the state. The circles for the 43 states are colored by the 2022 Cook Partisan Voter Index (Note values on x-axis are negative because they are logarithms).
Interaction analysis
To further examine the interaction between education and warming, we use mixed effects regression, where counties (level 1) are clustered under states (level 2) and the dependent variable is climate concern (PC1). The results of this model are shown in Table 3. The interaction between education and state-level warming is significant in the mixed effects model (Table 3). Figure 2a shows this significant interaction when grouped by education level, with state-level warming on the x-axis and average climate concern (PC 1) among the grouped counties on the y-axis. The Intraclass Correlation Coefficient of 0.766 indicates a high correlation between county climate concerns within states, with ± 0.339 average variation among counties within a state. Table 3 shows that both education and HHI affect climate concern on their own (both p < 0.001), but they do not significantly interact with each other (p = 0.436). This indicates that education moderates the effect of state-level warming on climate concern (p < 0.001) but it does not moderate the effect of HHI on climate concern (Fig. 2b).
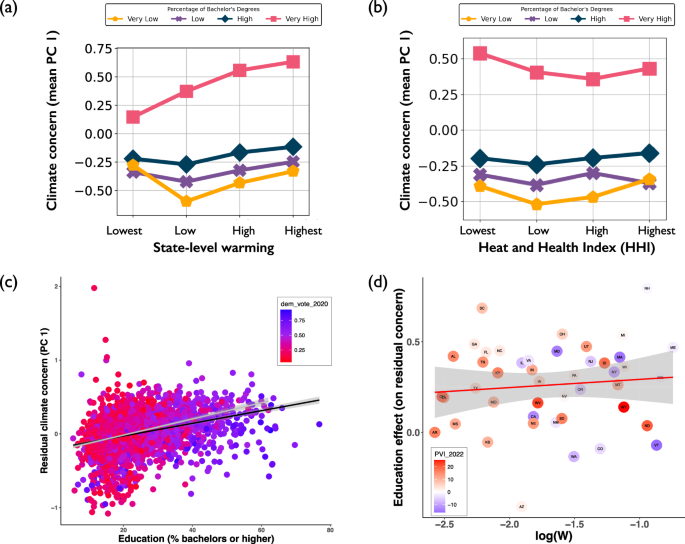
c Residual climate concern (not predicted by 2020 Democratic vote) vs temperature anomaly. The overall regression slope is 0.00856 ± 0.00044 (adjusted r2 = 0.109, F1,3048 = 373, p < 0.000001) and is slightly steeper for republican-leaning (gray line) than democratic-leaning (black line) counties. d Education effect on residual climate concern vs (log W), with no significant relationship.
While the interaction of state-level warming with education is clear, HHI does not interact with education to increase climate concern (Fig. 2). This is likely because HHI correlates with poverty28. Lower income tends to predict lower support for climate policies because concern about day-to-day finances is prioritized over the future of climate change1,2,3,15,29. Also, under the psychological burden of poverty30, the responsibility for dealing with global climate change policies tends to be attributed elsewhere15,31.
Other variables will certainly have an effect. The political party acts as a proxy for climate concern and many Republican-leaning states are in the warmer US South. Figure 1 shows the states colored by the 2022 Cook Partisan Voter Index (see Methods), and indeed there is a modest correlation at the state level between education effect and PVI (slope − 0.009 ± 0.003, adjusted r2 = 0.143, p = 0.006). As such, politics help explain the outliers in our analysis, North and South Dakota (Fig. 1b), where education effects are anomalously low given the state-level warming. In North Dakota, for example, a strong partisan divide over climate policy reflects the state’s economic reliance on the oil industry32. Without the Dakotas, the correlation between state-level warming and the education effect is considerably stronger (slope 0.266 ± 0.047, adjusted r2 = 0.429, F1,41 = 32.5, p < 0.000002).
As a further check on the effect of politics, we look at the effects on the residual climate concern left after regressing climate concern (PC1) is regressed against the percentage Democratic vote in the 2020 election. Across 3048 US counties, there is still a correlation between the percentage bachelor’s degrees and residual climate concern (Fig. 2c) but the magnitude of that correlation—education effect—is no longer correlated with the warming measure (Fig. 2d) and the Dakotas are no longer outliers.
Discussion
The education effect is correlated with recent state-level warming, but the residual education effect is not. Where people vote according to their concerns, this is expected—the more concerned about climate change, the more likely to vote for the Democratic platform. Liberals and moderates tend to show greater trust in science as their education levels rise, while conservatives may become more skeptical33. From 2013 to 2023, the fraction of Democrats who considered climate change a major threat to well-being increased from 58 to 78 percent while that concern among Republicans remained at 23 percent.20
We suggest education enables climate concern, whereas politics is more a reflection of concern. They also interact, in that people approach scientific information through their group values34, such that more educated conservatives might use their knowledge to critically dismiss climate science, while those with less education might be less engaged35,36.
In summary, we find that perceptible warming in the last decade increases the effect that education, but not health risk, has on climate concerns. Building on findings that concern about climate change is increased by observable climate change combined with education5, our finding identifies feedback, in that the effect of education is further increased by the warming itself. This suggests that education increases climate concern by enabling people to explain their own experiences of climate change—the more warming they notice, the greater the effect of education.
Methods
Data for climate concern use the 2023 county-level estimates from the Yale Program on Climate Change Communication (YPCCC). Since the YPCCC climate opinion data, consisting of 73 related opinion estimates, are highly correlated, we reduced the dimensions through principal component analysis. This yields one major principal component, PC 1, which captures 40% of the variance in the county-level data of YPCCC 2023, with loadings that are indicative of concern about climate change (see Supplementary Table S2). We refer to the PC 1 score as the “climate concern” estimated in each county.
County-level education levels are drawn from the US Census 5-year (2018-2022) American Community Survey estimates about educational attainment (ACS S1501; see Data Availability). We use percent with bachelor’s degrees to determine this education effect while testing it at other levels of educational attainment, from 9th grade to graduate degrees.


Responses