Projected increase in ENSO-induced US winter extreme hydroclimate events in SPEAR large ensemble simulation
Introduction
Extreme hydroclimate events, such as droughts, floods, and heavy rainfall, account for a substantial portion of natural disasters in the United States (US), negatively impacting agriculture, public health, and others and leading to significant socio-economic losses1,2,3. Previous studies have reported that the US has experienced a dramatic increase in precipitation, its intensity, and the associated extreme hydroclimate events since the mid-20th Century4,5,6. For instance, the National Integrated Drought Information System (https://www.drought.gov/) shows a marked increase in the number of boreal winter (December-February, DJF) extreme hydroclimate events, particularly in the southern US during the recent period of 1990–2020, compared to the early period of 1895–1925 (Table S1). Therefore, to mitigate the associated socio-economic losses, it is important to improve our understanding of the drivers for US precipitation and associated extreme hydroclimate events.
El Niño – Southern Oscillation (ENSO), characterized by warm and cold sea surface temperature (SST) anomalies in the equatorial Pacific, is the primary modulator for US winter precipitation on interannual time scales7,8,9,10,11,12,13. More specifically, during boreal winter, the cold phase of ENSO (i.e., La Niña) produces anomalous extratropical stationary Rossby wave trains, generating an anomalous atmospheric ridge over the North Pacific. This leads to a poleward shift of the North Pacific jet stream (NPJ), which in turn decreases precipitation over the southern US, thus enhancing the likelihood of droughts14,15. In contrast, the warm phase of ENSO (i.e., El Niño) produces an anomalous atmospheric trough over the North Pacific. This leads to a strengthening and a southward shift of the NPJ, producing wetter-than-normal conditions over the southern US, thus reducing drought frequency in the region7,9,16,17,18,19,20.
While climate model simulations under historical and future emission scenarios project diverse changes in ENSO amplitude (measured by the standard deviation of the ENSO index), ENSO teleconnections and the associated US precipitation and extreme hydroclimate events are projected to strengthen in the 21st century compared to the 20th century5,12,21,22,23,24,25,26,27,28,29,30. For example, the ENSO-induced extratropical teleconnections via the Pacific-North American (PNA) pattern are projected to strengthen12,31,32,33, suggesting an increase in extreme hydroclimate events over the southern US. Specifically, partly due to the strengthened ENSO teleconnections34,35 extreme hydroclimate events over California are projected to increase significantly in the 21st century4,24, consequently increasing the risk of megafloods36. Oh et al.37 also showed that the relationship between ENSO and southeastern US precipitation is expected to increase in the 21st century. However, some studies argued that future changes in US extreme hydroclimate events are more influenced by non-ENSO sources, such as mean precipitation and soil moisture memory, than ENSO-related sources38,39,40, suggesting that future US precipitation and associated extreme hydroclimate events are not highly sensitive to future changes in ENSO amplitude29.
As briefly reviewed above, while the impacts of future changes in ENSO and its teleconnections on US precipitation and extreme hydroclimate events have been investigated in many previous studies, the analysis has focused on specific regions (e.g., California, the southwest US, or the southeast US) or a single aspect of extreme hydroclimate events (i.e., drought or flood). Here we perform a comprehensive analysis of precipitation, droughts, and floods to explore the importance of ENSO and its teleconnection on the future extreme hydroclimate over the entire US. In addition, although several studies have reported that ENSO and its teleconnection are projected to strengthen12,31,32,33, the relative roles of ENSO amplitude changes versus other background environmental changes (e.g., changes in the mean state, teleconnection, precipitation sensitivity to tropical forcing, etc.) in US precipitation have not been fully explored. Thus, it still remains unclear whether the projected amplification of the precipitation and extreme hydroclimate events are a direct response to a strengthened ENSO amplitude or an underlying modification of the atmospheric background state. Thus, it is necessary to better understand and quantify the relative roles of ENSO amplitude and the atmospheric background state in the future changes in ENSO-induced US precipitation.
The main objectives of this study are (1) to explore the future changes in ENSO-induced boreal winter precipitation and extreme hydroclimate events in the US and (2) to decompose the future ENSO-induced US precipitation changes into ENSO amplitude effects and environmental effects (See Methods section). To accomplish the two main objectives, we use a large ensemble simulation, Seamless System for Prediction and EArth System Research (SPEAR)41, under the historical and the Shared Socioeconomic Pathway 5-8.5 scenarios (SSP-585)42,43.
Results
Increasing ENSO variance and its impacts on US winter precipitation
To explore the historical and future changes in the interannual variation of ENSO, we calculated a 31-year moving average of the standard deviation of the DJF Niño3.4 index derived from various observational datasets (HadISST44, ERSSTv545, and COBEv246 SST) and SPEAR-LENS, as shown in Fig. 1a. Despite differences in the amplitude of ENSO variability among the observational datasets before 1960, the observed interannual variation of the Niño3.4 index shows a steady increase throughout the analysis period from 1921 to 2022. Additionally, in the satellite era, all observations display very similar ENSO variations. Consistent with the observation, SPEAR-LENS also shows an increasing trend, which continues until 2050 and decreases afterward. Thus, ENSO variance has increased during the past decades and is projected to continue increasing in the future at least until around 2050, as shown in previous studies27,28,30,47,48. According to recent studies, most CMIP6 models show an increasing trend in ENSO variability until around the late 21st century and a decreasing trend afterward due to weakening thermocline-wind coupling49 and thermocline feedback50 after 21st century.
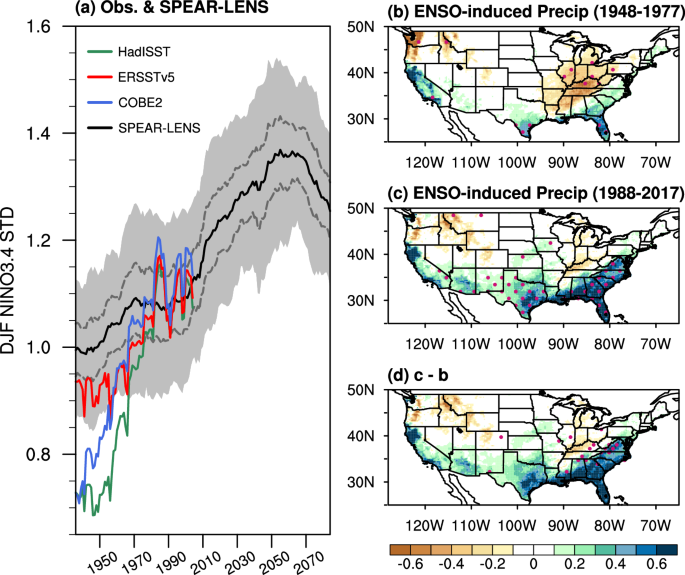
a Time series of a 31-year moving average of December-February (DJF) standard deviation of Niño3.4 index from ERSSTv5 (red solid line), HadISST (green solid line), COBEv2 SST (blue solid line), the SPEAR-LENS ensemble mean (solid black line), SPEAR-LENS ensemble spread (gray shading) and the 95% confidence interval (gray dashed line). (b, c) show the DJF precipitation (mm day−1) regressed onto the Niño3.4 index during the early period (1948–1977) and recent period (1988–2017) from observation, respectively. (d) is the difference between the recent and early periods. The regression coefficient for the late period is scaled by the ratio of the standard deviation (1.17) between the early and late periods. The red dots in (b–d) denote statistical significance at the 95% confidence level based on the two-tailed Student’s t-test.
Before examining the impact of increased ENSO variance on the US winter precipitation, we examined the representation of tropical Pacific SSTAs and the associated precipitation response to ENSO in SPEAR-LENS and compared with observations (Supplementary Fig. S1). Despite stronger-than-observed SST anomalies and their elongation toward the western Pacific warm pool region, SPEAR-LENS accurately captures the observed SST and precipitation response to ENSO in the tropical Pacific. To examine the impact of the increased ENSO variance on US winter precipitation during the observational period, we conducted a linear regression analysis for two separate periods, an early period (1948–1977, Fig. 1b) and a recent period (1988–2017, Fig. 1c). The spatial patterns of regression coefficients are similar between the two periods, but their amplitudes are different. Specifically, during both early and recent periods, a strong wet condition appears over the southern US while a dry condition appears over the Northwest US and around Ohio Valley. However, the winter precipitation associated with ENSO during the recent period is wetter than during the early period (Fig. 1d), particularly over the southern US, suggesting a potential connection between the increasing ENSO variance and its remote effects on US hydroclimate. The ensemble mean from SPEAR-LENS shows an increase in US ENSO-induced winter precipitation, which is consistent with observations (Supplementary Fig. S2). This result from SPEAR-LENS shows that despite potential influences of decadal/multidecadal climate variability, the interannual variation of ENSO-induced precipitation has increased in the historical period.
Projected increase in ENSO-induced US winter precipitation in SPEAR-LENS
Figure 2 shows the simulated US precipitation, zonal wind at 200 hPa, and geopotential height at 500 hPa regressed onto the Niño3.4 index for the historical (1931–1980) and future (2031–2080) periods. In order to quantify objectively the ENSO-induced changes from the historical to the future period, the regression coefficients for the future period must be scaled by the ratio of standard deviations of the Nino3.4 index between the future (σF) and historical (σH) periods (parameter c in Methods section). Thus, if the regression coefficients remain the same between the historical and future periods but the ratio is greater than 1, the implied amplification effects of ENSO are reflected by the rescaled regression coefficients.
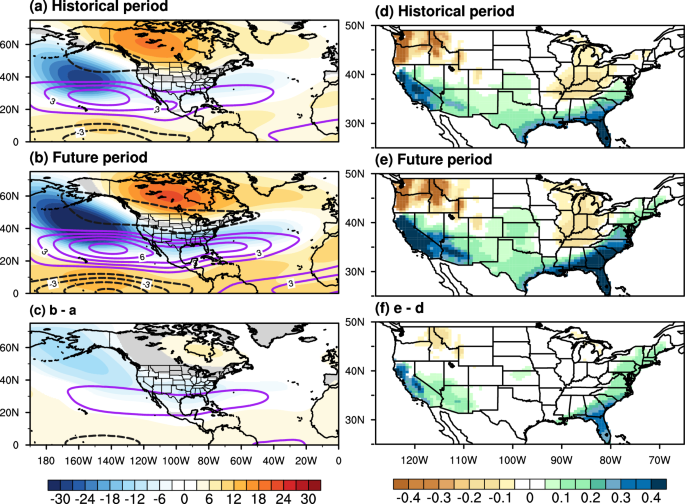
a, b Regression of 200 hPa zonal wind (ms−1, contour; positive anomalies are purple lines and negative anomalies are black dash lines) and 500 hPa geopotential height (m, shading) on the Niño3.4 index in SPEAR-LENS for the historical (50 years: 1931–1980) and future periods (50 years: 2031–2080), respectively. The regression coefficient for the future period is scaled by the ratio of the standard deviation (1.27) between the historical and future periods. (c) is the difference between the future and historical periods. (d–f) are the same as (a–c), but for DJF precipitation (mm day−1). It is noted that the colored areas shown in this figure are above the 99% confidence level based on the two-tailed Student’s t-test.
Figure 2a shows the zonal wind at 200 hPa and geopotential height at 500 hPa regressed on the Niño3.4 index, illustrating the ENSO-induced teleconnections during the historical period. El Niño produces a positive PNA-like pattern characterized by a pair of anomalous atmospheric trough and ridge over the North Pacific and eastern Canada, respectively. El Niño also leads to a southward shift of the NPJ, which in turn drives an increase in the precipitation over the southern US. In the future period, the El Niño-induced NPJ is projected to strengthen significantly and expand further eastward (Fig. 2b, c). Similarly, both the anomalous atmospheric trough over the North Pacific and the ridge over eastern Canada also strengthen12,32,33,51. These changes are likely influenced by the amplified and eastward-expanded SST-precipitation anomalies in the eastern tropical Pacific21,28,52 and by the strengthened connection between ENSO and NAO in the future12,53. Consistent with the strengthened ENSO teleconnection patterns, the future US precipitation response to ENSO is also projected to strengthen, but with no large change in the spatial pattern (Fig. 2d–f). Specifically, El Niño-induced wet conditions over the West (particularly California), Southwest (SW, particularly Arizona), Southeast (SE) and Northeast (NE) US are projected to substantially increase in the future. This suggests that the variability of ENSO-induced US winter precipitation is projected to increase in those regions, enhancing the likelihood of extreme hydroclimate events modulated by ENSO.
Projected increase in ENSO-induced US winter extreme hydroclimate
Figure 3 shows the probability of extreme wet events during El Niño and extreme dry events during La Niña. The probability of extreme events is calculated by counting the number of extremely wet events (SPI3 ≥ +1.6) and extremely dry events (SPI3 ≤ −1.6) during El Niño and La Niña years and then dividing by the total number of El Niño and La Niña years for each corresponding period. Therefore, the probability values are normalized and thus do not reflect ENSO frequency. In the historical period, the probability of extreme wet events during El Niño is increased over the SW and SE US (Fig. 3a). The probability of extreme wet events during El Niño is projected to increase for most of the US, with a remarkable increase over the SE US, NE US and the US Great Plains (Fig. 3b, c).
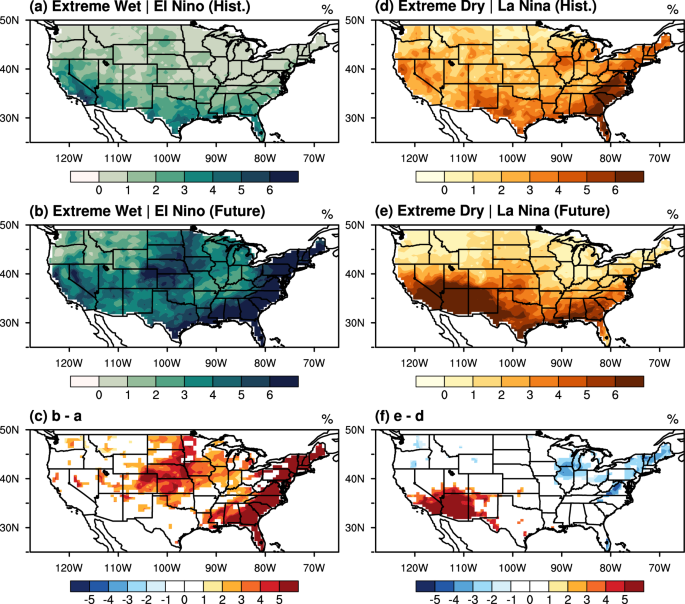
Composite maps of the probability (%) of extreme wet events during El Niño for (a) the historical and (b) future periods, respectively. (c) is the difference between the future and historical periods. (d, f) are the same as (a, c), but for extreme dry events during La Niña. Note that El Niño (La Niña) is defined by when the Niño3.4 index is above (below) 0.5 °C (−0.5 °C), and the extreme wet (dry) event is defined by the SPI3 equal to above (below) 1.6 (−1.6). It is noted that the colored areas shown in (c, d) are above the 95% confidence level based on the two-tailed Student’s t-test.
Extreme dry events during La Niña are more common over the SE and NE US in the historical period (Fig. 3d). The probability of extreme dry events during La Niña is projected to increase drastically over the SW US in the later part of the 21st century (Fig. 3e, f), and decrease slightly over the NE US. Thus, the SW, SE and NE US are expected to experience large changes in ENSO-induced extreme hydroclimate events in the future. As such, we further explore the temporal changes in extreme hydroclimate events in these three regions.
Figure 4 shows the 31-year running average of the regionally averaged probability of extreme wet events during El Niño and extreme dry events during La Niña over the SW, SE, and NE US. ENSO-driven extreme hydroclimate events in the three regions show distinctly different trends depending on the ENSO phase although the ENSO variance is projected to increase continuously until the mid-21st century (Fig. 1a). For instance, extreme dry events during La Niña show a pronounced increasing trend over the SW US, while extreme wet events during El Niño do not show any significant change (Fig. 4a). In the SE and NE US, on the other hand, the extreme wet events during El Niño are expected to substantially increase whereas extreme dry events during La Niña are expected to decrease (Fig. 4b, c).
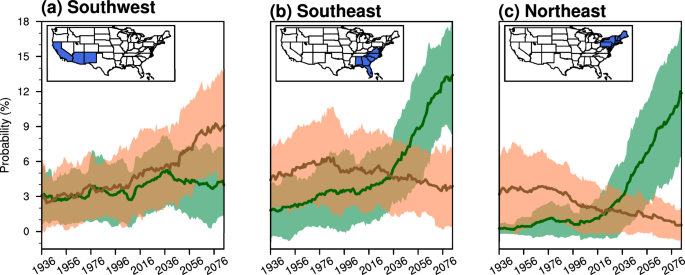
a Time series of the 31-year running average of the regionally averaged probability (%) of extreme wet events during El Niño (ensemble mean: green solid line, ensemble spread: light green shading) and extreme dry events during La Niña (ensemble mean: brown solid line, ensemble spread: light brown shading) over the Southwest (SW) US. (b, c) are the same as (a) but for the Southeast (SE) and Northeast (NE) US.
Interestingly, the projected changes in ENSO-related extreme hydroclimate events are not consistent with the regression pattern of precipitation. As shown in Figs. 3, 4, the NE US shows a noticeable increase in ENSO-related extreme wet events despite the impact of ENSO on precipitation not being as pronounced as it is in the SW and SE US (Fig. 2d−f). This result suggests that the changes in ENSO and its linear impact on precipitation do not totally explain future changes in extreme hydroclimate events and that other factors may influence these changes. Recent studies suggested that the projected changes in non-ENSO factors, such as mean precipitation, soil moisture memory, and atmospheric rivers, could also influence the future changes in the US extreme hydroclimate39,40,54,55. For example, an increase in the mean precipitation in the future could support more extreme wet events while hindering the occurrence of extreme dry events. To explore this hypothesis, our analysis further examines the future changes in the mean precipitation (Supplementary Fig. S3). Mean precipitation is projected to increase over the SE and NE US, while it is projected to decrease over the SW US, consistent with future changes in extreme hydroclimate events. This suggests that while the future changes in ENSO significantly influence future changes in US precipitation and associated extreme hydroclimate events, the future changes in the mean precipitation also contribute to regional differences in extreme hydroclimate events. However, it is still unclear how much future changes in ENSO will influence future US precipitation and associated US extreme hydroclimate events compared to other factors. Therefore, it is essential to assess the contribution of ENSO to total precipitation relative to other sources.
Impacts of ENSO versus non-ENSO factors on the future US precipitation
We performed a signal-to-noise ratio (SNR) analysis to determine how much of the variability of US winter precipitation can be explained by ENSO. We first partitioned the total winter precipitation anomalies into an ENSO-related component (i.e., defined by the linear regression of precipitation on the Niño3.4 index) and a non-ENSO component (i.e., defined by the residual after subtracting ENSO-related portion from total precpitation). We then defined the signal as the ENSO-related precipitation variance and the noise as the non-ENSO-related precipitation variance. It is noted that the non-ENSO component represents the variance from other sources, such as internal atmospheric variability and low-frequency climate variability.
In the historical period, both ENSO and non-ENSO components show strong variability along the western US seaboard and the SE and NE US (Fig. 5a, d). The amplitude of non-ENSO components in the future is projected to increase over the entire US especially in the SE and NE US while the ENSO component is projected to increase over the SW, SE, and NE US with little change in spatial pattern (Fig. 5b, c, e, f). This suggests that future changes in the SNR, which quantifies the relative influence of the ENSO signal, will be dominated by amplitude changes rather than by a spatial shift. In addition, the SNR is expected to increase the most over the SW, and SE US (Fig. 5i), where the future changes in precipitation and extreme hydroclimate events are predominant, indicating that the roles of ENSO on US winter precipitation and associated extreme hydroclimate events in these regions are expected to increase in the future. To quantify the change in SNR between the two periods, we calculated spatially averaged SNR over the SW, and SE US regions as defined in Fig.4a, b. The SNR in the SW and SE US are expected to increase from 0.05 to 0.19 (an increase of 280%) and from 0.08 to 0.31 (an increase of 287%), respectively. This result implies that if ENSO prediction skills remain the same as in the present day, the prediction skills of winter precipitation and associated extreme hydroclimate events are anticipated to improve in the future due to the increased role of ENSO (i.e., signal) on total precipitation.
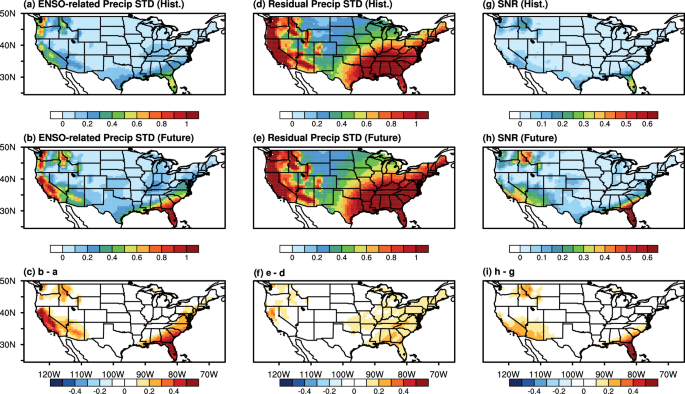
a, b show the standard deviation of ENSO-related precipitation (mm day−1) for the historical (1931–1980) and future (2031–2080) periods, respectively. (c) is the difference in ENSO-related precipitation between future and historical periods. (d–f) are the same as (a–c) but for non-ENSO-related precipitation (mm day−1) defined by the residual after removing the ENSO signal from total precipitation. (g–i) are the same as (a–c), but for the signal-to-noise ratio (SNR), which is the ratio between the variance of the ENSO component and non-ENSO components. It is noted that the colored areas shown in (c, f, i) are above the 95% confidence level based on the two-tailed Student’s t-test.
Impact of ENSO amplitude versus ENSO-induced environment on US precipitation
Consistent with previous studies12,27,28,32,56,57, our results show that both amplitudes of ENSO and its teleconnections are projected to increase. This results in an increase in the ENSO-related US precipitation and associated extreme hydroclimate events. However, it is still unclear whether the amplified impact of ENSO on US precipitation is due to an increase in ENSO amplitude or environmental factors that enhance ENSO-induced teleconnections under a fixed ENSO amplitude. In order to explore how ENSO amplitude and environmental factors individually contribute to future changes in US precipitation, we decompose the impacts of future changes in ENSO on US winter precipitation into ENSO amplitude and environmental effects (see Methods section).
As shown in Fig. 6a, the total ENSO effect (see Method section) shows strong positive precipitation anomalies over the SW, SE, and NE US, while negative precipitation anomalies are shown over the Northwest US. Both the ENSO amplitude and environmental effects show similar spatial patterns and amplitude over the SW and SE US. However, the increased precipitation over the NE US driven by the environmental effects is much larger than by the ENSO amplitude effect (Fig. 6b, c). This result suggests that future changes in precipitation in the NE US are driven primarily by environmental effects, even if no significant change in ENSO amplitude occurs in the future.
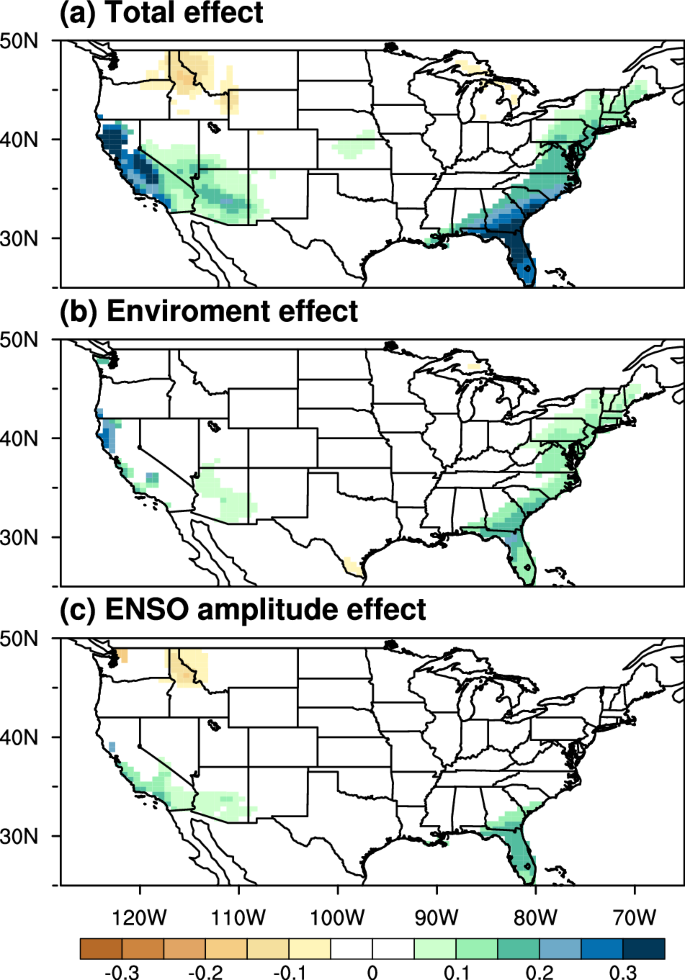
a–c The changes in (a) total ENSO effect, (b) ENSO amplitude effect, and (c) ENSO environmental effect on winter US precipitation (mm day−1) in SPEAR-LENS. The total ENSO effect is defined as the difference between the regression coefficients of scaled future ENSO and historical ENSO. The ENSO amplitude effect is defined as the difference in regression coefficients of scaled future ENSO and non-scaled future ENSO. The environmental effect is defined as the difference between the regression coefficients of non-scaled future ENSO and historical ENSO (See Method section 2.4). The precipitation shown in (a–c) is above the 95% confidence level based on the two-tailed Student’s t-test.
Consistent with this result, the tropical precipitation in response to a unit amplitude of ENSO is projected to intensify (Supplementary Fig. S4). Previous studies found that under a warming climate, the Clausius-Clapeyron relationship strengthens the tropical Pacific convection response, leading to enhanced ENSO-teleconnection patterns and associated atmospheric responses, regardless of changes in ENSO amplitude29,33,52. In summary, while both the ENSO amplitude and environmental effects are expected to contribute to the increased US precipitation variability in the future, the environmental effect is likely to play a more dominant role than the ENSO amplitude effect, particularly in the NE US.
Summary and Discussion
This study examines the future projection of ENSO and ENSO-induced US winter precipitation and associated extreme hydroclimate events using SPEAR-LENS. ENSO variance has gradually increased in both the observation and SPEAR-LENS during the observational period (1921-2022). According to SPEAR-LENS, ENSO variance is projected to continue increasing until the mid-21st century, consistent with previous studies12,27,28,58,59,60. The ENSO-induced US precipitation is also projected to increase particularly over the SW, SE, and NE US via two mechanisms: (1) an increased ENSO amplitude and (2) an enhanced ENSO-induced teleconnection for a fixed ENSO amplitude. There is also a corresponding projected increase in the occurrence of extreme hydroclimate events over the SW, SE, and NE US with some regional contrasts. Specifically, the SW US is projected to experience an increase in extreme dry events but little change in extreme wet events. In contrast, the SE and NE US are projected to experience an increase in extreme wet events but a decrease in extreme dry events. These regionally contrasting trends in extreme hydroclimate events are shown to be a compound effect of changes in ENSO and the mean state of regional precipitation.
An analysis of the SNR shows that the US precipitation driven by ENSO component over the SW and SE US is projected to increase in the future compared to that caused by other non-ENSO components, alluding to an increasing role of ENSO in US precipitation and extreme hydroclimate events in those regions. A decomposition of the ENSO effects into the ENSO amplitude and environmental effects shows that while both effects are important to future US precipitation and extreme hydroclimate, the environmental effect is more dominant over the US NE than the ENSO amplitude changes, suggesting an amplification of the atmospheric response to ENSO variability in the future.
There remain several points that have not been extensively discussed in this study. First, the decomposition method used here assumes that the amplitude of El Niño and La Niña and their impacts exhibit linear and symmetric changes in the future. However, ENSO and its future changes are not necessarily symmetric or linear61,62. For example, the equatorial Pacific zonal wind stress modulated during El Niño is more intense and extends farther east than during La Niña, resulting in asymmetric SST growth rates47,58,63. It has been shown that extreme El Nino events tend to promote an eastward shift in El Nino-teleconnection patterns over North America compared to La Niña and weaker El Niño events19,64. Additionally, SPEAR-LENS shows that the asymmetric ENSO teleconnections are projected to intensify over the central North Pacific and the Gulf of Alaska, with a poleward shift that may influence the US hydroclimate. Therefore, although the symmetric components of ENSO can largely explain the impact of ENSO on US extreme hydroclimate, it is important to discuss the asymmetric components of ENSO impacts (Supplementary Fig. S5). To quantify the impacts of ENSO’s non-linearity and asymmetry on US precipitation and extreme hydroclimate, future work should employ a series of sensitivity climate model experiments.
Another important point is that future changes in ENSO spatiotemporal diversity and its impacts are not explored in this study. A recent study28 suggests that future El Niño events are projected to grow at a faster rate and persist longer in the eastern tropical Pacific. In addition, another study65 shows that the frequency of Central Pacific El Niño events and the amplitude of Eastern Pacific El Niño events are projected to increase under the influence of increasing greenhouse gases. Therefore, ENSO-induced US extreme hydroclimate events may be subject to spatiotemporal changes in the future. Thus, further research is needed to explore future changes in ENSO diversity and its connection to US precipitation and extreme hydroclimate. Lastly, it is important to note that this study uses a single large ensemble simulation, SPEAR-LENS. Therefore, further analysis using multi-model ensemble simulations is needed.
Properly addressing the above-mentioned points through targeted modeling studies and analyses of multi-model ensemble simulations could further improve our understanding of the roles of future changes in ENSO in the US precipitation and extreme hydroclimate.
Methods
Observational and reanalysis datasets
The extended reconstructed SST version 5 (ERSSTv5)45, HadISST44, and COBEv246 SST are used to examine the change in observed ENSO variance spanning 102 years (1921–2022). Monthly precipitation is derived from the NOAA Climate Prediction Center (CPC) Unified Gauge-Based Analysis of precipitation over the contiguous US with a fine horizontal resolution grid (0.25° × 0.25°) for the 1948–2022 period66. The analysis is confined to the boreal winter season (DJF) when ENSO and its teleconnection to North America are strongest. All datasets were linearly detrended for the analysis period to remove a potential influence of anthropogenic climate change.
Seamless System for Prediction and EArth System Research – Large Ensemble Simulation (SPEAR-LENS)
In this study, we used the Seamless System for Prediction and EArth System Research – large ensemble simulation41 (SPEAR-LENS) to explore future changes in ENSO variability and its impact on US precipitation and extreme hydroclimate events. SPEAR-LENS has 30 ensemble members which started from different initial conditions and integrated for 180 years (1921–2100). The simulations are forced with historical radiative forcings for the historical period (1921–2014) and with radiative forcings for the Shared Socioeconomic Pathways (SSP) 5–8.5 scenario41,43 for the future period (2015-2100). SPEAR-LENS has a 50 km horizontal resolution and 33 vertical levels for the atmosphere component. The horizontal resolution of the land component is the same as the atmosphere component. SPEAR-LENS has an approximate 1° horizontal resolution for the ocean and sea-ice components. More detailed model descriptions and additional features of SPEAR-LENS can be found in Delworth et al.41.
We used linear regression analysis to assess the impact of ENSO on US precipitation in the SPEAR-LENS simulations computed during two separate 50-year periods, a historical period spanning from 1931 to 1980 and a future period from 2031 to 2080. The future and historical periods in SPEAR-LENS are selected by the period of maximum and minimum ENSO variation, respectively, based on the 31-year running average of ENSO standard deviation. The regression analysis is performed for each ensemble member individually and discussed as the ensemble mean including confidence intervals based on the Student’s t-test.
ENSO and Standardized Precipitation Index (SPI)
To obtain the ENSO index, we first calculated the area-averaged monthly SST anomalies over the Niño3.4 region (170°W–120°W, 5°S–5°N) from the monthly climatological mean (1921–2022), accounting for the seasonality of the Niño3.4 index. Therefore, the DJF Niño3.4 index is derived from the DJF climatological mean. El Niño and La Niña events are defined when the DJF-averaged Niño3.4 index exceeds +0.5 °C and falls below −0.5 °C, respectively. In SPEAR-LENS, Niño3.4 SST anomalies are obtained by subtracting the monthly climatological mean from the 1921 to 2100 period for each ensemble member individually, and then further subtracting the ensemble mean to remove the influence of external forcing. In order to explore US hydroclimate events such as droughts and floods, we used the Standardized Precipitation Index (SPI), which is widely used as an index for meteorological dry and wet conditions67,68. The SPI is defined by the standard deviations from the long-term mean of precipitation. The SPI index in the observation is calculated using the standard deviation from the historical climatological mean for the 1948–2022 period. In contrast, the SPI index in SPEAR-LENS is calculated using the climatological mean from the entire SPEAR-LENS period (1921–2100). Therefore, future changes in the ENSO composite of the SPI are influenced by both ENSO variability and mean state changes in precipitation. It can be objectively used to categorize extreme hydroclimate events as either drought (dry) or flood (wet) events. It is computed by normalizing the precipitation distribution over a specified interval, thus facilitating the assessment of precipitation deviation over a variety of time scales. For this study, we select a 3-month time scale (SPI3), which can be obtained by accumulating precipitation for the prior 3 months. Extreme drought and flood events were defined by SPI3 values below −1.6 and above +1.6, respectively. The criteria indicate approximately a 5% probability, which is the same criteria used in the National Integrated Drought Information System (https://www.drought.gov/) (Table S1).
Decomposition of ENSO-Induced US Winter Precipitation Changes
To better explain and attribute the future changes in ENSO-induced US winter precipitation and extreme hydroclimate events, it is necessary to decompose the projected ENSO-induced US precipitation changes into two parts: one linked to ENSO amplitude changes (referred to as ENSO amplitude effect) and the other not directly linked to the projected ENSO amplitude changes (referred to as “environmental effect”). The latter component (i.e., environmental effect) includes projected changes in ENSO-induced tropical deep convection and associated tropical Pacific rainfall variability, extratropical teleconnection patterns, and other regional changes in the atmospheric conditions with an assumption that the amplitude of ENSO is unchanged in the future. More specifically, the environmental effect represents a potential amplification of the atmospheric response to ENSO variability due, in part, to the projected increase in tropical vapor response to SST anomalies linked to the Clausius–Clapeyron relationship29,52,69.
We performed decomposition analysis based on linear regression analysis to address the different effects of ENSO amplitude and the environment on US winter precipitation. The regression coefficients represent the ENSO effect corresponding to one unit change in the ENSO index for each period. Therefore, the regression analysis does not directly reflect the impact of future changes in ENSO amplitude on US precipitation. To consider future changes in the ENSO amplitude, the future ENSO effect is defined by multiplying the future regression coefficient (βF) by the scaling factor (c), a ratio (c =σF/σH ≈ 1.27) of the standard deviations of the ENSO index between the historical period (σH = 1.04, 1931–1980) and the future period (σF = 1.32, 2031–2080). As a result, the total ENSO effects, comprising the effects of ENSO amplitude and environment effect for each reference period based on that period’s standard deviation of ENSO, are computed as follows,
To explore if and to what extent future changes in US precipitation and extreme hydroclimate are driven by changes in ENSO amplitude and by changes in the environment (i.e., mean state, teleconnections, etc.), we decompose the change in total ENSO effect (Eq. 3) into a change in ENSO amplitude (Eq. 4) and a change in environmental effects independent of ENSO amplitude change (Eq. 5).
Specifically, the future change in the total ENSO effect is the difference between regression coefficients of the scaled future ENSO (cβF) and historical ENSO (βH) effects. The future change in the environmental effect associated with ENSO is derived from the difference between the regression coefficients of non-scaled future ENSO (βF) and historical ENSO (βH) effects. The future change in the ENSO amplitude effect (Eq. 4) is the difference between the total ENSO effect (Eq. 3) and the environmental effect associated with ENSO (Eq. 5), where the ENSO amplitude effect is dependent on the ratio of the standard deviation of ENSO between two periods. It should be noted that the sum of the environmental effect and ENSO amplitude effect is equal to the total ENSO effect.

Responses