How different is tropical cyclone precipitation over land and ocean?

Results
Average precipitation rates of analog TC pairs
Here, we used an analog selection method to pair each landfalling tropical cyclone case with an oceanic TC case of the same intensity and under similar environmental conditions. This results in a total of 2895 TC pairs occurring over the land and the ocean (see Methods). The spatial distributions of the analog pairs revealed that the landfalling TCs were primarily concentrated along the eastern coasts of North America and East Asia; their oceanic pairs were relatively distributed scattered among the ocean basins (Fig. 1a, b). The intensities, environmental relative humidity, and VWS were similar between landfalling and oceanic TCs; any differences were not statistically significant. This similarity indicates that the discrepancies in precipitation between landfalling and oceanic TCs can be largely attributed to differences in the underlying surface.

Geographical distributions of TC pair samples over land and ocean (a) in the North Atlantic and eastern North Pacific basins and (b) in the western North Pacific and North Indian basins. Boxplots of (c) maximum surface wind (m s-1), (d) environmental relative humidity (%) and (e) vertical wind shear (m s-1). The spline, box, plus sign, and black solid line represent the 10th and 90th quartiles, 25th and 75th quartiles, the mean of the data (labeled above the box) and the median of the data, respectively. There are a total of 2895 data samples of TC pairs, with the difference of TC intensity and environmental factors being not statistically significant.
Radial distributions of azimuthally averaged TC precipitation rates reveal that the rates in storms’ inner region are uniformly larger for TCs occurring over the ocean compared with those occurring over land; these differences decrease radially outward (Fig. 2a), which is consistent with previous finding23. A radius of 500 km is conventionally used to characterize the rainfall area of TCs35,36,37. Averaging all rainy grids within a 500-km radius (Fig. 2b) reveals that the average precipitation rates of TC pairs are comparable to, but smaller than, those of all global TCs14,30. This phenomenon may be due to the fact that landfalling TCs and their corresponding oceanic pairs have weaker intensities and convection than the global mean. Comparing the precipitation rates for TCs occurring over the land and the ocean reveals that the former are lower than those of the latter. The difference is, on average, 27.8% (Fig. 2b). That result is statistically significant above the 99% confidence level based on the Student’s t test. When a smaller radius (i.e., 300 km) is selected, the average precipitation rate difference tends to be greater (i.e., 35.1%) (Fig. 2c). However, the precipitation rates in the outer regions of the storms (i.e., within radii of 300–500 km) appear to be comparable between landfalling TCs and oceanic TCs (Fig. 2d). This result indicates that, despite storms being of the same intensity and experiencing the same atmospheric environmental conditions of VWS and relative humidity, precipitation in oceanic TCs can be systematically stronger than that of landfalling TCs. Moreover, the higher rates of precipitation in oceanic TCs compared with landfalling TCs mainly occurs in the inner regions of the storms; in the outer regions, the average precipitation rates of landfalling and oceanic TCs are comparable.

a Radial distribution of azimuthally averaged TC rain rate (mm h-1) and (b–d) boxplots of area-averaging rain rates (mm h-1) for TC pair samples over land and ocean. The area averaging is taken within radii of (b) 500 km, (c) 300 km, and (d) 300–500 km from the TC center. The spline, box, plus sign, and black solid line represent the 10th and 90th quartiles, 25th and 75th quartiles, the mean of the data (labeled above the box) and the median of the data, respectively. The averaged rain rates of TCs over land are lower than that of oceanic TCs on average by 27.8% within 500 km and 35.1% within 300 km from the TC center, respectively, both of which are statistically significant above the 99% confidence level based on the Student’s t test. The difference in (d) is not statistically significant.
TC rainfall pattern discrepancies
Spatial patterns are an important component of TC precipitation characteristics, because they are critical to local disaster prevention strategies. To understand whether the precipitation patterns of landfalling and oceanic TCs differ, we examined the spatial distributions of precipitation for landfalling TCs, their oceanic pairs, and precipitation differences between landfalling and oceanic TCs (Fig. 3a–c). We found that the VWS was overall in the similar direction as the TC translation14; both the magnitude and direction of the VWS were additionally similar between landfalling and oceanic TCs (Supplementary Fig. S1). This result implies that rainfall asymmetry between the analog pairs cannot be attributed to the VWS direction. A further inclusion of VWS direction into the analog selection procedure produces qualitatively consistent results (discussed in the following section).
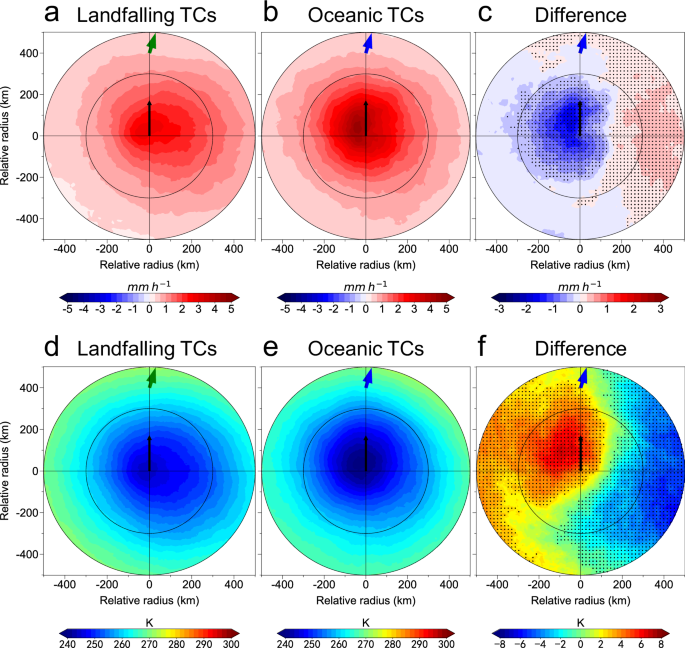
Plan views of (a–c) composite rain rate (mm h-1) and (d–f) infrared brightness temperatures (K) for TCs (a),(d) over the land and (b),(e) over the ocean, and (c),(f) difference of TCs over the land minus those over the ocean. Stippling denotes the area where the rainfall difference between landfalling TCs and oceanic TCs is statistically significant above the 95% confidence interval. The black arrows denote the direction of TC translation. The green and blue arrows denote the average directions of vertical wind shear for landfalling and oceanic TCs, respectively. The gray circles denote radii of 300 km and 500 km.
Rainfall is maximized near the center of TCs, and is located slightly in front of the storm for both landfalling and oceanic TCs8 (Fig. 3a, b). With reduced amount of upward surface moisture flux, the peak precipitation rate for landfalling TCs tends to be much smaller than that for oceanic TCs. Another notable feature is that the TC rainfall patterns are relatively asymmetric over the land and are rightward biased relative to the TC track (Fig. 3a, b). Oceanic TCs exhibit a comparatively much more symmetric rainfall distribution than landfalling TCs. As a consequence, the precipitation patterns of landfalling and oceanic TCs exhibit distinct discrepancies. Although landfalling TCs exhibit uniformly lower precipitation rates in their inner cores, that rainfall tends to be greater on the right side in the outer region (i.e., beyond a radius of 150 km) compared with oceanic TCs. The left-right rainfall discrepancies are mostly statistically significant above the 95% confidence level based on the bootstrap resampling technique. The heavier precipitation on the right side of the initial landfalling stage was also observed in TC landfall simulation experiments, but most of the phenomenon occurred within 100 km of the TC center31,38, which is different from the results above.
The IR brightness temperature field is an indication of convection activities39. The IR product is used to compare the convection between landfalling and oceanic TCs. The colder cloud tops in oceanic TCs are associated with more intense convection compared with landfalling TCs (Fig. 3d, e). That finding is consistent with the differences in precipitation rates (Fig. 3a, b). The spatial discrepancies of IR brightness temperature between landfalling and oceanic TCs also exhibit a distinct left-right difference pattern. This consistent finding from two independent satellite products reveals a robust influence of the underlying surface on TC convection and precipitation.
Tropical cyclone translation can also influence TC precipitation. The superposition of translation to TC wind field leads to a first-order rightward biased pattern of TC asymmetry30,40. Furthermore, TC translation can increase low-level inflow for a moving TC; stronger convective precipitation can be induced by faster-moving TCs14. As a TC translates from the ocean to the land, the surface friction increases dramatically, which, combined with the translation speed, may affect precipitation characteristics.
To determine whether TC translation was related to stronger precipitation on the right side of landfalling TCs, we further classified the analog TC pairs based on their translation speeds. We defined three cases: low speed (0–6 kt, 270 pairs), medium speed (6–9 kt, 433 pairs), and high speed (9–12 kt, 457 pairs). The cases with translation speed larger than 12 kt are excluded following Tu et al. (2022), since high speeds may hinder the maintenance of symmetrical structures of TCs14,41. The spatial distributions of TC rainfall in all three categories are shown in Fig. 4. Uniformly higher precipitation rates on the right side of landfalling TCs can be observed compared with oceanic TCs; the difference was more pronounced with increasing translation speed (Fig. 4a–c). That finding indicates that the translation speed of TCs plays a role in determining rainfall pattern discrepancies between landfalling and oceanic TCs. When we compared the radial rainfall distributions of landfalling and oceanic TCs with varying translation speeds (Supplementary Figs. S2a, c and e), we found that azimuthally averaged precipitation in the inner cores of oceanic TCs was uniformly stronger than that of landfalling TCs; in the storms’ outer regions, the precipitation of landfalling TCs turned to be larger than that of oceanic TCs with increasing translation speed. This result largely stems from enhanced surface precipitation on the right side of landfalling TCs undergoing increased translation (Supplementary Figs. S2b, d, and f).

Plan views of composite rain rate difference (mm h-1) for TCs over the land minus those over the ocean with translation speeds in the range of (a) 0–6 kt, (b) 6–9 kt, and (c) 9–12 kt. Stippling denotes the area where the rainfall difference between landfalling TCs and oceanic TCs is statistically significant above the 95% confidence interval. The black arrows denote the direction of TC translation. The green arrow (blue arrow) denotes the average direction of the vertical wind shear for TCs over land (TCs over ocean). The gray circles denote radii of 300 km and 500 km.
Robustness of the observational phenomenon
Although we found remarkable discrepancies in precipitation between landfalling and oceanic TCs, several factors might be potentially interfering these results. To definitively state that changes in the underlying surface are responsible for these discrepancies, we need to test several potential contributors.
To begin with, TCs in their early stages of making landfall could be affected by both the underlying ocean and the land at the same time. To exclude the possible influence of the offshore sea surface, we removed landfalling TCs close to a coastline. We selected a distance of 200 km; omitting storms any closer than that yielded 806 pairs (Supplementary Fig. S3). We found that the average precipitation rates of landfalling TCs remain lower than those of oceanic TCs within 500 km and 300 km of the TC center. The average difference was 32.7% and 43.0%, respectively (Supplementary Fig. S4). The left-right difference pattern between landfalling and oceanic TCs persisted (Supplementary Fig. S5), and the difference in precipitation rate was even larger when we excluded the offshore cases. That finding reveals that the coastal effect cannot be responsible for the discrepancies in rainfall. In addition, we also limited the cases within 30°N or 35°N to exclude extra-tropical transition cases, or removing cases below 34 kt, and consistent results have been obtained (not shown).
Secondly, the direction of the VWS could potentially influence the rainfall characteristics of TCs in a significant way; stronger precipitation tends to occur in the downshear quadrants of the VWS15,16. Although the average VWS directions are similar to the storms’ translation, there may be large VWS differences between landfalling and oceanic TCs case by case. Incorporating VWS direction into the selection procedure reduced the sample size to 1177 pairs, but the primary conclusions remain largely unchanged (Supplementary Fig. S6).
Thirdly, the precipitation characteristics of TCs may be different in different ocean basins42; the analog pairs were matched throughout all of the Northern Hemisphere’s oceanic basins. Pairing each landfalling TC with an oceanic TC in the same basin, with a size of 2404 pairs, also yielded consistent results (Supplementary Fig. S7).
Fourthly, all of the landfalling TCs were in their weakening stage, while a portion of the oceanic TC pairs were in their intensification stage. To identify the differences in precipitation between weakening and intensifying TCs, we assembled new analog pairs. We first isolated weakening TCs over the ocean that were no closer than 500 km from land. Analog pairs were then matched based on the intensifying TCs over the ocean. To ensure similar intensity and environmental conditions, as well as a sufficient sample size, the selection was relieved using a standard smaller than two times the standard deviation. Doing so yielded a total of 436 pairs. The spatial precipitation patterns of weakening TCs tend to be more asymmetric than those of intensifying TCs, as expected. The rainfall of intensifying TCs was much larger than that of the weakening TCs in almost all quadrants (Supplementary Fig. S8). Therefore, the left-right differences between landfalling and oceanic TCs are not related to their different intensity evolution stages. Moreover, the less rainfall observed on right sides of oceanic TCs in the weakening stage than landfalling TCs (Fig. 3a and Supplementary Fig. S8a) implies that the increased surface friction after landfall contributes to increased rainfall in the right quadrants of TCs.
Fifth, although the intensity and track of TCs are default prediction factors in TC forecast system, the environmental conditions are not. For each predicted TC case over the land at a specific intensity, there is ideally one occasion when it possessed the same intensity over the ocean several days in advance. Thus we re-assembled analog pairs by removing the constrain on VWS and RH; only the maximum surface wind was matched between landfalling and oceanic samples for the same TC case. A total of 2236 pairs were gathered. Results reveal that though with possibly different large-scale environmental conditions, the left-right difference of rainfall pattern remains dominated between landfalling and oceanic TCs (Supplementary Fig. S9). Therefore, the findings in this work might have potential application in practical TC forecast.
Physical mechanisms
To explore the possible mechanism responsible for the changes of TC precipitation after landfall, we conducted idealized numerical simulations using the Coupled-Ocean-Atmosphere-Wave-Sediment Transport (COAWST) model system43. The model comprises one domain with spatial resolution of 12 km, similar to that of the GPM product. The model output is saved every hour. Additional details about the model configuration are provided in the Supplementary Material (Supplementary Text S1). The simulated vortex developed and translated west-northwestward over the ocean, and reached its peak intensity at roughly 33 h. It then made landfall at 44 h and decayed rapidly afterward (Fig. 5a). Using the analog selection method described above, we assembled a total of 21 landfalling and oceanic TC pairs. The simulated TC rainfall patterns were consistent with those noted observationally: there was more asymmetric and rightward biased precipitation for landfalling TCs and more symmetric and stronger precipitation for oceanic TCs (Fig. 5b–d). The spatial precipitation of landfalling and oceanic TCs also exhibit a left-right difference, just like the observations. The cold wake left behind by the TC over the ocean may give feedback to the precipitation. A sensitivity experiment with the air-coupling process turned off also reveals the left-right difference pattern between landfalling and oceanic TCs (Supplementary Fig. S10). These results imply that the cold wake does not play a decisive role; the enhanced rain rate on the right side of TCs over land can be largely attributed to the landfall effect.

a Time evolution of the idealized TC intensity in terms of maximum surface wind simulated by the COAWST model. The red vertical dashed line denotes the time making landfall, and the gray zone denotes the time when the TC is over land. The inserted panel denotes the westward translation of the storm from the ocean to the land. Plan views of (b),(c),(d) composite rain rate (mm h-1) for TCs (b) over the land and (c) over the ocean, and (d) difference of TCs over the land minus those over the ocean. The black arrows denote the direction of TC translation. The gray circles denote radii of 300 km and 500 km.
The change in the underlying surface from ocean to land causes surface friction to increase significantly and the moisture supply to decline rapidly. The landfalling TC exhibited a dry core associated with low boundary layer moisture in the inner region (Supplementary Fig. S11), as a consequence of the surface evaporation cut off over land. The moisture of the landfalling TC derives exclusively from the atmospheric environment outside the TC; the moisture peaks in the outer region of the TC. This situation leads to land-traversing TCs having less moisture in their inner cores compared with ocean-traversing TCs.
Strong moisture convergence is the primary contributor to the high precipitation rates observed in TCs8,44. Low-level convergence increases with enhancing surface drag45,46,47,48, which can stimulate stronger convection and precipitation in TCs14,49. With storm translation, the wind field is rightward biased to a first-order in the Northern Hemisphere; since surface friction effect is positively related to surface wind, the surface friction causes stronger boundary-layer radial inflow on the right side of TCs, which could contribute to larger asymmetric low-level convergence and convection10,44.
The simulated surface inflow of landfalling TCs is maximized at right side of the storms (Fig. 6a). Overall, the radial inflow of the simulated TCs was stronger over land than the ocean, particularly in the right-side quadrants (Fig. 6c; Supplementary Fig. S11a). The transition of underlying surface from the ocean to the land plays an important role in this process, which can be better reflected from the storm’s time evolution (Fig. 6d). The radial winds in the left and right quadrants are at first comparable when the storm is over the ocean; they both strengthen as the storm intensifies. After the TC makes landfall, the radial winds decrease as the storm weakens. However, the radial winds in the right quadrants turn to be stronger than those in the left quadrants during the latter stage of the simulation (Fig. 6d). This situation indicates that the increase in surface friction due to landfall has contributed to the left-right asymmetry in the radial winds. The spatial characteristics of radial inflow and boundary layer moisture adequately explain the discrepancies in rainfall between landfalling and oceanic TCs. For landfalling TCs, the lack of moisture in the inner core leads to weaker precipitation; the rightward biased asymmetry of surface inflow is additionally responsible for increased rates of precipitation in the right quadrants.
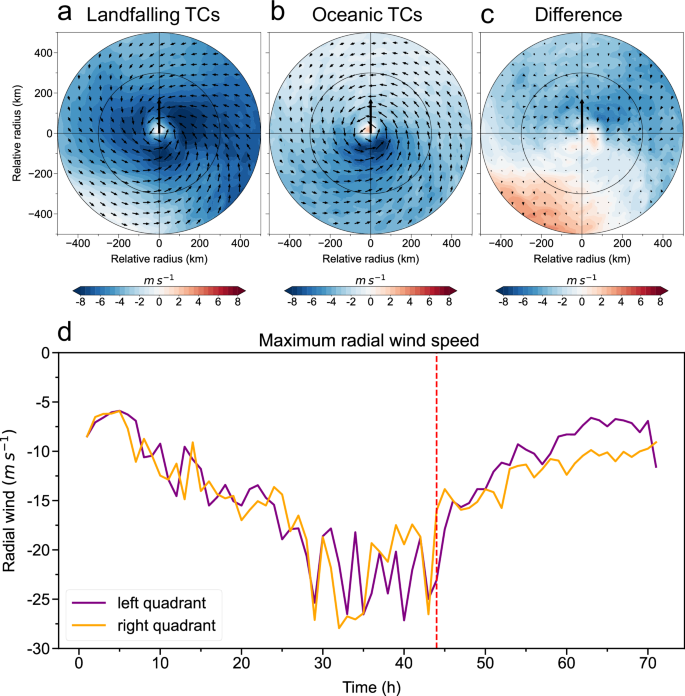
Plan views of composite surface radial wind (shaded; m s-1) and full wind field vectors (vector) for simulated TCs (a) over the land and (b) over the ocean, and (c) radial wind difference of landfalling TCs minus oceanic TCs. The radial wind is negative toward the storm center, but positive away from the storm center. d Time evolution of maximum surface radial winds for left and right quadrants of the idealized TC throughout the simulation.
Discussion
We have examined discrepancies in surface precipitation for landfalling and oceanic TCs using 20 year observational statistics. We used an analog selection method to ensure the comparisons were conducted with storms of the same intensity experiencing similar environmental conditions i.e., VWS and relative humidity. Statistical results reveal robust discrepancies in precipitation rate and pattern for landfalling and oceanic TCs. The area-averaged precipitation rates of landfalling TCs are about one third lower than those of oceanic TCs (27.8% within 500 km and 35.1% within 300 km). We noted stronger precipitation on the right side of landfalling TCs compared with oceanic TCs. The spatial distributions of TC precipitation were overall symmetric and maximized near the storm center for oceanic TCs; they were relatively asymmetric with a rightward-biased pattern for landfalling TCs. An independent satellite product of IR brightness temperature field confirmed that the convection on the right side of landfalling TCs was more intense than that of oceanic TCs.
We further conducted sensitivity tests by considering several potential factors that might have hindered the robustness of the observational conclusions (e.g., the distance to the coastline, the influence of VWS direction, basin discrepancies in terms of TC characteristics, and differing stages of TC intensity evolution). We showed that none of these factors were responsible for the systematic discrepancies in precipitation between landfalling and oceanic TCs. The left-right difference pattern of TC precipitation tended to be more pronounced as the translation speed increased. That finding implies that the rightward biased asymmetry of landfalling TC precipitation is related to TC translation. Of course, TC precipitation is a complex process controlled by multiple factors, and there are more than those mentioned above that determine its precipitation pattern, so there may be room for further optimization of the analog selection method. Besides, caution should be taken when applying the systematic difference from statistical results to individual cases.
We also used idealized numerical simulations, in which a storm translated from the ocean to homogeneous land surface, to explore possible mechanisms that could lead to such discrepancies. The simulated TC exhibited relatively symmetric precipitation over the ocean but rightward-biased rainfall pattern over land. The discrepancies of precipitation rates and patterns between landfalling and oceanic TCs are in agreement with the observations. We also showed that the significantly increased surface friction after landfall induced much stronger radial inflow, especially in the storm’s right quadrants. At the same time, the moisture in the inner core of the TC declined significantly due to the absence of upward surface moisture flux. Such a cutoff of moisture supply caused the precipitation rate in the inner core to become weaker for landfalling TCs; the rightward-biased strengthened radial inflow was primarily responsible for the enhanced precipitation rates in the right quadrants of landfalling TCs.
Methods
Data
We analyzed all landfalling TCs that occurred from 2001–2020 in the Northern Hemisphere. We derived the storms’ locations, maximum surface winds, translation speeds and direction, and land masks from the 3 h (most data reported at 6 h but are interpolated to 3 h) best track data of the International Best Track Archive for Climate Stewardship (IBTrACS, version 4)50. To ensure data consistency, we used data from US agencies to cover TCs in the Northern Hemisphere. A landfalling TC was defined as having at least four continuous inland data points where the first point located on land as the first point; we omitted TCs that remained over land for fewer than 12 h. We obtained precipitation data from the Global Precipitation Measurement (GPM) Mission (IMERG) product (version 6)51; these measurements have spatial resolutions of 0.1° × 0.1° from 90°S to 90°N in latitudes and 180°W to 180°E in longitudes and a temporal resolution of 0.5 h, available from June 2000 through October 2021. For each TC point at an interval of 3 h, there is a corresponding snapshot of precipitation. A combination of TC best track data and precipitation data produces 3425 and 73,351 precipitation data samples for landfalling and oceanic TCs, respectively.
We used infrared (IR) brightness temperature data to characterize the cloud characteristics, obtained from the National Center for Environmental Prediction/Climate Prediction Center (NCEP/CPC) merged IR V1 product at a spatial resolution of 4 km from 90°S to 90°N in latitudes and 180°W to 180°E in longitudes and a temporal resolution of 0.5 h. These data have been available since 1998. We calculated large-scale environmental conditions in terms of VWS and relative humidity using the fifth generation of the European Center for Medium-Range Weather Forecasts (ECMWF) reanalysis dataset (ERA5), which has a 1 h temporal resolution and spatial resolutions of 0.25° × 0.25°. The environmental VWS was defined as the difference between the mean wind vectors at the 200- and 850 hPa levels over an outer region of 200–800 km from TC center; it appears to be the deep VWS that plays a major role in dominating the TC precipitation structure15,52. We calculated the environmental relative humidity by averaging between the 500 and 700 hPa levels (results are unchanged using other ranges) over the same region of 200–800 km from the TC center. To quantify rainfall pattern discrepancies, we defined a polar-coordinate domain centered on each 3 h TC position, with 3 km spacing in the radial direction and 1° intervals in the azimuthal direction. The 0° azimuth points to the translation direction of each TC data point. The variables of interest were then bilinearly interpolated into polar coordinates.
Analog selection
To investigate the differences in rainfall between landfalling and oceanic TCs of the same intensity occurring under the same large-scale environmental conditions, we turned to an analog method21,53,54 to pair each landfalling TC case with a comparable oceanic TC case. The maximum surface wind of TCs, VWS, and environmental relative humidity were considered to be selection parameters. We calculated a cost function J as:
where Vmax is maximum surface wind speed, VWS is the magnitude of the environmental VWS, RH is environmental relative humidity, and σ represents the standard deviation of each quantity. The subscripts “land” and “ocean” denote TC samples occurring over the land and the ocean, respectively. The value of J characterizes the similarity extent of TC intensity and large-scale environmental conditions between two TC cases. The analog selection procedures are introduced as follows. For each 3 h landfalling TC data sample, we first calculated the J values of all oceanic TCs. We then selected the oceanic case with a minimum value of J as a potential analog of the landfalling case. For the situation in which one oceanic case was paired with multiple landfalling cases, we paired the landfalling case with the oceanic case with the largest minimized J21. After the initial screenings, we calculated the mean and standard deviations of the three terms that went into in calculating J. If any component differed from its mean by more than two standard deviations, that pair of matched TCs was disregarded. We accordingly obtained a total of 2895 TC pairs occurring over the land and the ocean. We used bootstrap resampling55 to test the statistical significance of the composite difference at the 95% confidence level.
 region")


Responses