Human behavior-driven epidemic surveillance in urban landscapes

Introduction
Throughout history, the interplay between epidemics and human societies has been profound, each significantly influencing and shaping the course of the other1,2,3. This interplay, already present during our early hunter-gatherer days, was notably boosted by the establishment of agrarian societies around 10,000 years ago, when the creation of communities provided fertile breeding grounds for diseases to thrive. It was during this transformative period that humanity first encountered diseases such as malaria, tuberculosis, leprosy, influenza, and smallpox, which have since significantly altered the course of human history4.
As human settlements transformed into nowadays vast urban centers, they also introduced new challenges for contemporary epidemiology5,6. Urban environments, characterized by dense populations, complex social interactions, and socioeconomic disparities, create ideal conditions for the spread of communicable diseases7,8,9. Moreover, the rapid movement of people and goods within and across cities sweeps out national and continental boundaries, thus facilitating the global dissemination of pathogens between major city centers10.
The advent of big data and advanced modeling techniques offers new avenues for understanding and managing this cocktail of epidemic boosters, emphasizing the importance of integrating mobility data and demographic insights into urban epidemic management strategies11. In this line, data analytics have significantly advanced epidemic modeling12,13, enabling the mathematical formalization of complexities associated with demographic segregation, mobility patterns, and heterogeneous contacts-key factors in disease propagation14.
Utilizing metapopulation frameworks, epidemic models effectively manage the interaction among the above ingredients by coupling contact-driven transmission with mobility-related dispersal15,16,17,18,19,20,21,22. In recent decades, such behaviorally informed metapopulation models have become indispensable for mechanistic forecasting, enabling precise predictions of epidemic trajectories across diverse scales-from local communities23,24 through national25,26,27 to global levels28,29,30. Moreover, contemporary epidemic models extend beyond mapping the spatio-temporal spread of diseases, but also facilitate the development of data-informed containment strategies with maximal resource efficiency and minimal socioeconomic disruption31,32,33,34.
These efforts highlight the critical role that incorporating social dynamics into epidemic models has on our capacity to respond to infectious disease threats, an aspect that has recently materialized in research agendas35,36,37 aimed at advancing this endeavor. These agendas, among other problems, specifically highlight the challenge of employing realistic human contact structures to explore localization behavior in key subpopulations for epidemic control policies. Addressing this precise challenge, here we introduce a data-informed approach tailored for large urban centers, leveraging their unique demographic and mobility patterns. Our framework allows identifying critical human flows and leads to actionable surveillance strategies to obtain valuable early warnings of incoming epidemic outbreaks.
Results
Mixing matrix M
To address the former challenge, we first present a formalism aimed at capturing the complex spatiotemporal structure of human mobility, particularly within urban environments. Over the last decades, extensive research has been devoted to reveal the complex and rich spatiotemporal structure of human mobility patterns38,39. When focusing on urban environments, public surveys reveal that human flows are mainly dominated by recurrent mobility patterns40,41 connecting the residence of individuals with the work place to which they usually commute. Consequently, recurrent human flows have been incorporated into theoretical frameworks42,43,44,45,46 as the backbone of metapopulation models tailored to track urban epidemics. This way, the analysis of origin-destination matrices (OD), either constructed from mobile phone devices or from census surveys, have been instrumental in shedding light into the vulnerability of cities during the initial stages of epidemics and the spatially uneven distribution of cases47,48,49.
Regardless of the former advances, the feasibility and efficiency of surveillance campaigns and control strategies driven by commuting data remains to be explored. To tackle this challenge here we leverage the formalism proposed in ref. 50 for the study of contagion-diffusion processes with recurrent mobility patterns of distinguishable agents. This model represents a city as a collection of P interconnected patches (see Fig. 1a), each one representing a geographical area. The mobility data informs the matrix n, whose elements, nij, identify subgroups of individuals living inside patch i and regularly traveling to patch j. Therefore, a generic patch, say i, is populated by ni residents, divided into subgroups based on their travel destinations (ni = ∑jnij), as schematized in Fig. 1a.

a Illustration of the mobility model here considered. We assume a metapopulation of P patches and construct the mobility network from daily back-and-forth movements recorded in public surveys. Each geographical patch i in the metapopulation is partitioned into different subgroups according to their usual destination, being nij the number of residents inside i daily commuting to patch j. b–e Mixing patterns of the subpopulation of nij residents in i with typical destination in j. When staying in their residential patch i, these residents might interact with others staying also there (b) and also with residents from other patches (c) that have as usual destination patch i. In turn, when moving, residents in i will interact with those residents from other patches: (d) either those that belong to the usual destination j and that decide not to move or (e) with residents of a patch l who also have as usual destination patch j.
Once constructed the matrix n, we can simulate reactive processes, such as contagion dynamics, coupled with the diffusion of the population. To this aim, the model assumes a discrete-time approach, where each time step consists of four different stages. First, each individual decides to move to the usual destination with probability pd or stay in the residence area. Second, (day) interactions take place with those agents sharing the same location. Third, those individuals that moved in the first stage return to their residence and, fourth, another interaction stage takes place when agents make local contacts inside their subpopulation of origin (night interactions). These contacts reflect interactions with members of their own household or neighborhood. In any of the two interaction stages occurring in each time step, contagions can occur. A more exhaustive description of the steps present in the simulation scheme is found in the Methods section.
The processes described above can be encapsulated into a Mixing matrix M which contains the expected number of interactions among the different subgroups of individuals found in an urban environment. We illustrate in Fig. 1b–e the elements of the mixing matrix associated to a specific subgroup of individuals with residence in patch i and destination in patch j. These elements capture all the contagion venues affecting these individuals as a result of their mobility across the city. Namely, these individuals can interact with other residents staying there (Fig. 1b) and with others coming from a different patch (Fig. 1c). In contrast, when moving to their usual destination, they interact with its residents (Fig. 1d) and with other visitors also moving there (Fig. 1e). The mathematical expression of the elements of the Mixing matrix M can be found in the Methods section whereas their derivation from the equations governing the epidemiological model used here is explained in the Supplementary Information.
Mobility-informed testing and quarantine policies
The leading eigenvector of Mixing matrices, derived from epidemic models on networked populations, plays a pivotal role in pinpointing key actors in epidemic outbreaks, whether they are individuals51 or specific geographical areas32,33. Expanding upon these insights, we introduce a testing strategy that prioritizes screening of those agents participating in origin-destination trips with a large contribution to the leading eigenvector of the matrix M. The operational framework of this policy is the Susceptible-Exposed-Infected-Recovered-Quarantine (SEIRQ) model, as depicted in Fig. 2a, so that those agents that test positive are isolated from the population as a control policy.

a Susceptible-Exposed-Infected-Recovered-Quarantined (SEIRQ) compartmental model used in the epidemic simulations. In addition to the usual flows governed by the pathogen infectiousness λ, the incubation period η−1 and the recovery probability μ, we assume that Infected and Exposed individuals are quarantined after being tested. b Illustration of the testing strategy implemented in the model. Such strategy depends on the amount of daily tests available to screen the population ntests and on how these tests are allocated across the city, governed by L. Small values of L capture targeted resource allocation on the most vulnerable subgroups defined from the Mixing matrix M whereas large L values correspond to their random allocation. c Time evolution of the number of infected individuals in Bogotá when distributing ntests = 2 × 10⁵ tests every day on the L most critical links (color code). Solid lines represent the average time evolution and the shadowed region corresponds to 95% confidence interval over 25 simulations for each L value. The basic reproduction number of the pathogen responsible for the outbreak is ({{mathcal{R}}}_{0}=4).
As illustrated in Fig. 2b, our testing policy hinges on two critical parameters: the total number of tests ntests at our disposal, and the links in the mobility network L targeted by these tests. By adjusting the parameter L, our strategy can transition from a focused approach, targeting individuals taking part in those trips with the largest contributions to the leading eigenvector of M, to a more distributed allocation of tests across the urban landscape. A more detailed exposition of the strategies for the distribution of testing resources is provided in the Methods section.
We apply our mobility-informed testing strategy to two real scenarios, the cities of Bogotá and Miami, whose mixing matrices are constructed from demographic and mobility data drawn from public surveys, as detailed in the Methods section. For this purpose, we simulate several outbreaks caused by a pathogen with basic reproduction number ({{mathcal{R}}}_{0}=4) and for which we have ntests = 2 × 10⁵ daily tests to counteract its spread. This way, varying the number L allows us to evaluate the impact of different testing distributions.
In Fig. 2c we plot the time evolution of the number of infected for different strategies. Starting from an scenario when resources are distributed quite evenly across the city (L = 5 × 10⁴), decreasing L yields the usual flattening of the epidemic curves, reducing and delaying the peak of contagions. However, when tests are concentrated in the individuals of a few critical links (L = 2 × 10³), spreading them out by increasing L also favors epidemic control. Overall, our analysis for the city of Bogotá reveals the existence of an optimal number of links ({L}_{{rm{opt}}}^{* }) on which testing and isolation policies should be prioritized to efficiently control an outbreak. Remarkably, Supplementary Fig. 1 shows that such ({L}_{{rm{opt}}}^{* }) value does not exist for Miami, pinpointing that in this city the concentration of tests on a few subgroups of individuals, i.e. reducing L, seems to be the best control strategy.
Optimal control policies depend on urban landscapes
To further showcase the effects of targeted testing and quarantine policies, we now focus on the impact of the mobility-informed policies on the attack rate, defined as the total number of individuals contracting the disease during an epidemic outbreak. Fig. 3a–b show how the latter indicator depends on both the basic reproduction number of the disease ({{mathcal{R}}}_{0}) and the spatial allocation of the ntests across L mobility links in Bogotá and Miami respectively. Figure 3a reaffirms the existence of an optimal value ({L}_{{rm{opt}}}^{* }({{mathcal{R}}}_{0})) of targeted links reducing the long-term impact of epidemics on Bogotá. Interestingly, such value is not independent of the epidemic process but strongly varies with the basic reproduction number ({{mathcal{R}}}_{0}), yielding a complex interplay between the extent of an outbreak and the optimal spatial allocation of resources to reduce its burden. Conversely, Fig. 3b shows that, in Miami, concentrating testing efforts on a few critical links allows mitigating an outbreak even for relatively large ({{mathcal{R}}}_{0}) values. Similar findings are presented in Supplementary Fig. 2 for other cities retrieving the same behaviors observed in Bogotá or Miami. The optimal ({L}_{{rm{opt}}}^{* }) value is found in the cities of New York and Boston, while the city of Austin returns the same outcomes as Miami. The results are further reinforced in Supplementary Figs. 3 and 4 where we perform a sensitivity analysis on other parameters, namely the variables η (the latency probability) and the mobility p, proving the qualitative results remain consistent.
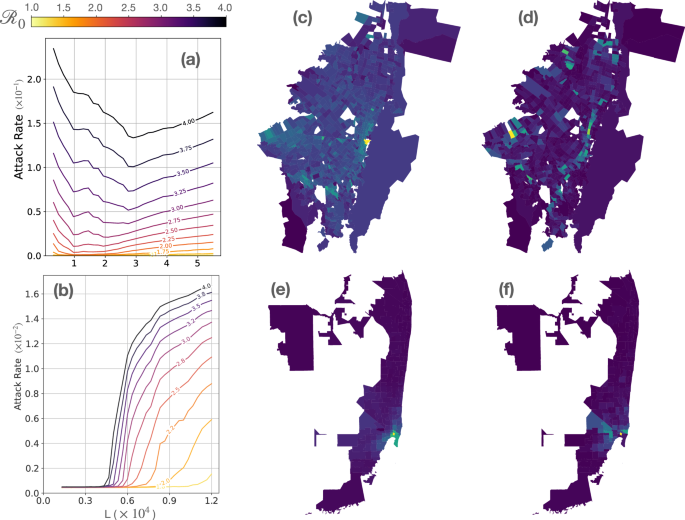
Panels a and b show the attack rate of an epidemic wave as a function of the basic reproduction number ({{mathcal{R}}}_{0}) of the pathogen (color code) and the number L of mobility links used to distribute the ntests = 2 × 10⁵ daily tests in Bogotá (a) and Miami (b). The central maps show the distribution of cases across Bogotá (c) and Miami (e) by plotting the attack rate in each patch after implementing a control strategy that sets ntests tests across the most important mobility links (L = 2.8 × 10⁴ for Bogotá and L = 6 × 10³ for Miami). Finally, the maps in the right show how the ntests were distributed according to the destination of the aforementioned most critical links in Bogotá (d) and Miami (f). In all the maps, brighter colors correspond with higher values of the represented quantities.
Our findings underscore that mobility-informed policies should be adapted to the unique characteristics of each urban environment52,53. Specifically, in cities with complex and segregated socio-economic activities, concentrating resources on the most critical links does not always ensure community-wide protection and thus proves ineffective. Conversely, this strategy yields significant benefits in cities where the most relevant links are primarily confluent towards a few and close patches. These two contrasting patterns correspond to the two cities under study and can be further elucidated by examining the spatial distribution of cases for a resource allocation characterized by (L,gtrsim,{L}_{{rm{opt}}}^{star }({{mathcal{R}}}_{0})).
In Fig. 3c, we consider that tests are allocated across the L = 2.8 × 10⁴ most critical links in Bogotá and depict the attack rate in each patch ({R}_{i}^{infty }), defined as the total number of recovered agents living in patch i at the end of the epidemic outbreak. This reveals a widespread penetration of the disease with varying degrees of impact across different areas. We also represent in Fig. 3d the spatial allocation of resources, that is, the proportion of tests conducted on individuals moving to each patch in this scenario. This spatial distribution indicates that the mobility-informed policies prioritize acting over human flows spanning multiple neighborhoods. An in-depth exploration of the dependence of both cases and test distribution on L is presented in Supplementary Fig. 5. There, it becomes evident that the optimal ({L}_{{rm{opt}}}^{star }) arises from the trade-off between the spatial allocation of resources required to address different contagion sources and the minimum number of tests needed for local outbreak control in each patch. In fact, when (L ,< ,{L}_{{rm{opt}}}^{* }({{mathcal{R}}}_{0})), the epidemic is contained in very specific locations but emerges elsewhere. Conversely, beyond the optimal value, i.e. when (L ,>, {L}_{{rm{opt}}}^{* }({{mathcal{R}}}_{0})), the dispersion of tests across the urban landscape is such that preventing the spread in the main outbreak becomes totally unfeasible.
The epidemic scenario observed in Bogotá starkly contrasts with that of Miami for L = 6 × 10³, where the majority of both cases (Fig. 3e) and the allocated tests (Fig. 3f) concentrate around a single patch and its immediate vicinity. In this context, the aforementioned trade-off leans towards maximizing local outbreak control, thereby favoring strategies that adopt lower L values. Specifically, Supplementary Fig. 5 reveals that as tests become more evenly distributed (i.e., as L increases), the surge in attack rate shown in Fig. 3b is attributable to a significant outbreak in the most vulnerable area, which cannot be contained with the limited resources available there.
Mobility-informed surveillance policies
The results shown above have illustrated that the Mixing matrix M can guide the optimal allocation of tests to reduce the long-term extent of epidemic outbreaks. Regardless of the potential adequacy of the different control policies here proposed, their timing of implementation also represents a crucial factor shaping their ultimate benefits to reduce the epidemic burden on the population54,55,56. Such timing is closely related to the design of efficient surveillance strategies, which should provide the authorities with an up-to-date picture of the evolution of the number of cases for the early diagnosis of ongoing epidemic crises.
We now explore whether the Mixing matrix M can inform surveillance campaigns for an efficient screening of the infected population in an epidemic outbreak. In what follows, we restrict our analysis to Bogotá and consider an epidemic outbreak with ({{mathcal{R}}}_{0}=4). Our surveillance strategy distributes ntests = 2 × 10⁴ tests across the L most critical mobility links identified in the matrix M. Unlike the previous analysis, we assume an uncontrolled scenario, meaning that infected individuals are no longer quarantined upon detection but, instead, their number is monitored for surveillance purposes as shown in the compartmental diagram in Fig. 4a. Thus, our baseline scenario (see Fig. 4b) consists in an uncontrolled epidemic wave in which contagions naturally propagate through the urban environment. This enables us to quantify the temporal evolution of positive cases as the epidemic unfolds without case detection having any effect on its evolution.

a The SEIR model is augmented with a surveillance system that records positive tests from exposed and infectious individuals. b The solid line represents the natural (without interventions) epidemic curve. The dotted lines correspond to the epidemic curves shown in f (commented below). In panel c we show the time evolution of detected cases for different concentrations of testing resources on critical links. The dashed horizontal line signifies the threshold, nalarm, which triggers containment actions. The Early Warning Time (EWT) – the interval spanned from the initial infections to the time when nalarm detections occur – is plotted against the degree of test concentration L for d various numbers of available tests, ntests, and for e distinct basic reproduction numbers, ({{mathcal{R}}}_{0}). Panel f shows the mitigated epidemic curves upon the imposition of containment measures that reduce ({{mathcal{R}}}_{0}) by 50% at time t = EWT (these curves are also represented with dashed lines in panel b for illustrating the mitigation effect with respect to the uncontrolled scenario). The shaded areas in panels d–f represent the 95% confidence interval in the results obtained from 100 distinct simulations.
In Fig. 4c, we present the temporal evolution of the total number of detected cases for different allocation strategies of testing resources, regulated by L. These results indicate that concentrating testing resources on a limited number of key mobility links (indicated by a small L) enables surveillance systems to detect an impending epidemic more swiftly. In addition, the cumulative number of cases detected 30 days after the beginning of the outbreak decreases as tests are more evenly distributed across the city, for different values of ({{mathcal{R}}}_{0}) and amounts of testing resources, ntests (see Supplementary Fig. 6).
To more precisely measure this effect, we introduce the concept of the Early Warning Time (EWT), defined as the time needed to declare an epidemic scenario after detecting nalarm infected individuals (indicated by the dashed line in Fig. 4c). The increasing trend of the EWT with the number of links, L, across which tests are allocated is evident in Fig. 4d–e. This observation aligns with the premise that mobility-informed strategies enhance the preemptive detection of an epidemic by testing individuals in high-risk transmission flows. Moreover, these two panels corroborate the persistent benefit of such surveillance campaigns focused on the most critical human mobility links, irrespective of the volume of testing resources, ntests, (Fig. 4d) and the basic reproduction number, ({{mathcal{R}}}_{0}), of the spreading pathogen (Fig. 4e). This also holds for the other cities included in the study (Miami, New York, Boston and Austin) as shown in Supplementary Fig. 7.
We further delineate the implications of timely control strategies following the epidemic alarm raised by mobility-informed surveillance campaigns. To do so, we consider that, when nalarm cases are detected, containment strategies are deployed, halving the reproduction number ({{mathcal{R}}}_{0}). Figure 4f shows the trajectories of the epidemic after the activation of containment measures at the EWT ascertained through the surveillance strategies shown in Fig. 4c. Significantly, in all instances, a marked decline in case numbers is observed, as indicated by the dashed lines in Fig. 4b (that replicate the evolution of the average values shown in Fig. 4f). Focusing on the differences among the scenarios presented in Fig. 4c, we note that an anticipation of roughly 10 days in the EWT not only postpones the epidemic peak but also substantially curtails peak incidence. A more granular analysis of the effects of the containment measures implemented at the EWT is presented in Supplementary Fig. 8, which showcases a significant reduction in the size of the epidemic peak and the attack rate when focusing the tests on the most vulnerable mobility links, as well as a temporal shift of the epidemic peak.
Mobility-informed surveillance at Transit Stations
So far, mobility-informed strategies have demonstrated effectiveness in early epidemic detection and in palliating their long-term burden on the population. However, the granular application of testing based on the anticipated knowledge of citizen’s residences and workplaces is impractical during an actual epidemic due to privacy and logistical constraints. Consequently, other control strategies leveraging critical mobility data obtained from Mixing matrix M, while still actionable, are necessary. To this aim, here we seek for alternative targeted strategies based on interventions at the level of transportation systems.
In Bogotá, the Transmilenio bus rapid transit system accounted for 38% of urban travel in 2022. Its extensive network, shown in Fig. 5a, vertebrates the daily flows through 12 routes that feature 144 stations with varied geographic distribution. The system’s electronic card check-ins and check-outs offer a digital trace of users’ travel patterns. This feature, along with the massive use of the Transmilenio mobility network, facilitates the implementation of mobility-informed policies by allocating tests at strategic transport hubs.

a The spatial distribution of the Transmilenio stations in Bogotá (Colombia): colored areas correspond to the different patches whereas dots correspond to stations. The alignment of raw mobility flows with Transmilenio journeys is made by assigning (see Methods) the fraction of population of a patch making use of a particular station. Different situations of the assignment processes are highlighted in b: (I) all the population of a patch is assigned to the same station, (II) three stations serve a single patch, and (III) a single station serves the population of a collection of patches. Test positivity (c) and EWT (d) as a function on relative size of the pool of public transport users targeted for testing (relative to the city’s population) following 5 different surveillance strategies: prioritizing critical mobility links projected on the transportation network (black), the amount of daily users of each transport station (dark blue), the betweenness centrality of the stations (light blue), their eigenvector centralities (green) and randomly across all transportation users (gray dashed line). In these panels, solid lines represent the average quantities and the shadowed region constitute the 95% confidence interval for the results obtained for each scenario across 100 simulations.
To identify those stations where resources should be prioritized, we need to map the critical links identified in the mobility network, connecting two geographical patches, with critical journeys between two stations in the transportation network. To do so, we assume that the Transmilenio network is used by those individuals whose residence and workplace are located within a radius of 800 m of distance from their respective nearest stations, which are considered to be the origin and destination of the trip in the transportation network. Overall, the aggregation process, sketched in Fig. 5b and further explained in the Methods section, preserves 15% of the human movements recorded in the mobility network.
Figure 5c–d present the comparison between different strategies for allocating tests among users of the public transportation network. To this aim we show how detected cases (Fig. 5c) and EWT (Fig. 5d) depend on the pool of the public transport users chosen for testing according to different criteria. The results, complemented with those presented in Supplementary Fig. 10, show the same qualitative behavior as before, where concentrating the tests on a few critical links leads to a much higher positivity rate (or detections) and lower epidemic warning time. Therefore, even when restrained to the lower resolution of the transportation network, targeted surveillance campaigns on vulnerable subgroups of individuals provide a better early assessment of an epidemic crisis. Note, however, that the loss of accuracy when projecting the mobility flows onto the transport network gives suboptimal results compared to the distribution of tests directly using the mobility network, as shown in Supplementary Fig. 11. This is expected, as the coarse-graining of the flows into subgroups of diverse exposure levels results in focusing tests on many individuals that are not at high risk. The information needed to move from number of links to percentage of population tested is represented in Supplementary Fig. 12.
To round off our analysis, we compare the performance of the control policies implemented on the links of the transportation networks with other simpler, more straightforward strategies focusing on transportation stations. These strategies encompass focusing the resources on the transport stations with the highest number of users, highest betweenness centrality and highest eigenvector centrality, as detailed in the Materials and Methods section. Such strategies, yet more effective than a complete random selection, do not achieve the same performance as the policies relying on the critical transportation links, thus showing the usefulness of the mixing matrix M for surveillance and testing strategies.
Discussion
In this work, we have explored the intersection of urban mobility and epidemic surveillance, harnessing the capacity of metapopulation frameworks to enrich epidemic models with a, often overlooked, layer of behavioral complexity. Our findings contribute to the emerging field of digital epidemiology37, addressing the challenge of incorporating human behavioral data to construct realistic human mixing models that improve our preparedness and response to epidemic scenarios35.
We have shown that urban mobility flows and demographic data can be combined into a Mixing matrix that captures the interactions of residents in urban environments driven by their daily recurrent mobility patterns. Our results underscore that the dominant eigenvector of this matrix has the potential to streamline testing and quarantine efforts by identifying critical pathways conducive to pathogen transmission. Thus, equipped with the particular mixing matrices of real cities, we have leveraged the knowledge of critical mobility links, identifying vulnerable subgroups of population with a given origin and destination, to design targeted mitigation measures (based on test and quarantine policies) and surveillance campaigns. In both scenarios, we have assumed limited testing resources, a common situation when facing sanitary crises in large urban environments, and studied how the allocation of testing resources to the most critical mobility links affects the outcomes of both processes.
For containment purposes, we have demonstrated that an optimal concentration of testing resources can significantly reduce the impact of an epidemic outbreak. However, the contrasting scenarios observed in cities like Bogotá and Miami illustrate that the optimal distribution of tests is contingent upon the specific socio-economic urban landscape. This insight is critical for urban planners and public health officials seeking to enhance the resilience of cities against future outbreaks.
In the realm of surveillance, we have shown that the concentration of testing resources in critical mobility links results in a considerable anticipation of the epidemic wave, allowing for prompt action even with limited resources. Specifically, the concept of Early Warning Time (EWT) emerges as a key metric for assessing the timeliness of epidemic alerts, reinforcing that targeted testing of individuals within high-risk transmission flows can lead to more expedient interventions. We have also demonstrated that the proposed human behavior-informed surveillance campaigns are significant and actionable by showing that strategic testing at public transport stations – a more practical approach than widespread testing – can be an effective method of epidemic control.
Our findings should be considered in light of several limitations of the model here introduced. First, our model assumes that the population fully complies with the implemented policies. While this assumption greatly simplifies the simulations and the data requirements, it neglects the socioeconomic factors leading to heterogeneous adherences to public health interventions57,58,59 or the pandemic fatigue effect60,61, reducing the overall compliance of the population as a result of a prolonged implementation of control policies. Consequently, our model overestimates the expected impact of mobility-informed surveillance strategies on the public health of the population. In addition to this, our model does not account for the economic constraints or the logistic challenges62,63 associated with the spatial deployment of limited resources to monitor the advance of epidemic outbreaks. Additional economic metrics such as the cost-effectiveness of mobility-informed surveillance strategies would be thus needed to obtain a more informed assessment on their suitability to improve our preparedness and response to future epidemic outbreaks.
In conclusion, our research highlights the importance of strategically leveraging human behavior data to design efficient control policies when facing an epidemic crisis64. While challenges in the implementation of such strategies persist, particularly regarding data privacy and ethical considerations, the advantages of enhancing epidemic intelligence through astute data analysis are clear. As globalization advances and urban populations continue to expand65, the necessity for informed and multidisciplinary approaches such as the one presented here becomes increasingly vital, providing a shift from merely reacting to epidemic crisis to an integrative program that includes, among others, epidemiology and social sciences35,36.
Methods
Construction of real metapopulations
Our framework represents cities as metapopulations whose nodes correspond to residence areas and their links encodes the mobility patterns of the population. The construction of a metapopulation then requires demographic data, capturing how residents are distributed across the city, and mobility data encoding their commuting patterns. For the cities here analyzed, we can construct their associated metapopulation by using publicly available data.
Demographic data for the city of Bogotá, Colombia, come from the 2018 National Census of Population and Housing66. The public database provides household, residence, and individual data at the spatial resolution of city blocks (manzanas). Moreover, origin-destination data T for commuters is sourced from the 2018 Bogotá mobility survey67 with the resolution of the Transport Analysis Zones (Zonas de Análisis de Transporte or ZATs). These zones are considerably larger in area than the city blocks. To match both data sources, we use available geometric spatial data to aggregate the populations of the city blocks within each ZAT and use the latter as the patches of our metapopulation model.
We also analyze the mixing matrix corresponding to different metropolitan statistical areas (also known as core based statistical areas or CBSAs) in the United States: Miami-Fort Lauderdale-West Palm Beach (referred to as Miami), Austin-Round Rock-San Marcos (referred to as Austin), Boston-Worcester-Providence (referred to as Boston) and New York-Newark-Jersey City (referred to as New York). We extract the population distribution in each city at the census block level from the 2010 US census68. The census also provides mobility data on the Longitudinal Employer-Household Dynamics69 (LEHD) database. Specifically, daily mobility patterns of the population can be extracted from LEHD Origin-Destination Employment Statistics70 (LODES), which provides commuting data over the entire country, also at the level of census blocks. As census blocks represent very small geographical areas, we aggregate both data sets to ZIP Code Tabulation Areas (ZCTAs) resolution, thus being able to provide a more coarse-grained description of the locations on which resources should be prioritized.
For both cities, the constructed metapopulations are fully characterized by the number of residents in each patch i, ni and the mobility flows nij across patches, which can be constructed from the elements of the origin-destination matrix T as:
where Tij is the number of survey respondents commuting from i to j. The main characteristic of the constructed metapopulation for each city under study can be found in Supplementary Table 1.
Agent-based simulations
All the epidemiological curves shown in the manuscript are computed through agent-based simulations combining mobility data nij and the epidemiological processes driving the evolution of epidemic outbreaks. These simulations allow tracking the epidemiological state of each individual of the population according to a SEIRQD (Susceptible-Exposed-Infected-Recovered-Quarantined-Detected) dynamics.
We use a discrete-time approach considering that each time step in the simulations corresponds to a day. For each time step, different processes are simulated:
-
First, we distribute the population according to the mobility flows nij recorded in the metapopulation, giving rise to a new (temporary) spatial distribution in which each patch i is effectively populated by ({n}_{i}^{{rm{eff}}}={sum }_{j}{n}_{ji}) agents.
-
Then, day contacts are simulated at each patch. These contacts aim at capturing interactions occurring at workplaces, schools etc. We assume that all individuals who are concurrently in the same subpopulation make the same number of contacts. These contacts are proportional to the effective population density of the patch in which they are located. Therefore, an individual located at patch i makes zDfi interactions with randomly chosen individuals within their temporary patch, where ({f}_{i}={n}_{i}^{{rm{eff}}}/{a}_{i}) captures the effective population density at patch i, being ai its area. Likewise, zD is a scaling factor to ensure that the average number of day contacts is a fixed value 〈kD〉, i.e. ({z}_{D}=langle {k}_{D}rangle /{sum }_{i}{n}_{i}^{{rm{eff}}}{f}_{i}). This means that, while the number of interactions each agent makes is different depending on their origin and destination, their average values in the total population is fixed. Throughout the manuscript, we assume 〈kD〉 = 8 for all epidemic scenarios. To simulate contagions, we assume that a susceptible (S) individual becomes exposed (E) with a probability β for each contact with an infected (I) person.
-
Then, we simulate local contagion processes within their neighborhood or household members. Those processes add a total number of 〈kH〉 interactions to every susceptible individual, which are established with randomly chosen individuals within their residence patch. Throughout the manuscript, we assume 〈kH〉 = 3 for all epidemic scenarios. Unlike the previous case, this number of contacts does not vary across patches.
-
The rest of compartments get updated according to their respective dynamics. Every exposed (E) individual has a probability η of turning infectious (I), and every infected (I) agent has a probability μ of becoming recovered (R).
-
Finally, depending on the control strategy in question, a specific number of daily tests ntests are randomly distributed every time step over agents belonging to the selected links in the mobility network, nij, or in the transportation network nαγ, where i and j are patches in the mobility network and α and γ represent stations in the transport network. When enforcing quarantine, every positive test will set the state of the individual to a different compartment, quarantined (Q), isolating them from the rest of the population.
The parameters used for all the simulations can be found in Supplementary Table 2 whereas the deterministic equations that describe the dynamics of the systems are contained in the Supplementary Information.
Construction of the mixing matrix M
As explained in the main text, the Mixing matrix M simplifies the multitude of mobility-driven contagion processes into a single, mathematically manageable entity, whose dimension corresponds to the number of different subgroups in the metapopulation under study. In particular, we focus on the Mixing matrix M when pd = 1, for it captures the essence of behavioral-driven surveillance in urban landscapes subjected to the baseline mobility scenario. Note that pd = 1 does not imply that all the individuals move across the metapopulation, as the mobility network contains self-loops nii, capturing individuals who daily commute to a workplace located at their residential patch i.
To construct this matrix, we must take into account the two different types of contagion processes occurring at each time step in our model. First, we assume that individuals interact in their destination, being their number of contacts proportional to the effective population density inside that patch. In addition, we assume that individuals make 〈kH〉 contacts with individuals from their household or neighborhood.
From these assumptions and as shown in the Supplementary Information, the element Mijlk, encoding all the interactions of one individual whose residence (destination) is located in i (j) with the subgroup of residents in l traveling to k, is given by:
where δil denotes the Kronecker delta and zD ensures that an average number of 〈kD〉 daily contacts are observed across all destinations, i.e. ({z}_{D}=langle {k}_{D}rangle /{sum }_{i}{f}_{i}{n}_{i}^{,text{eff},}).
Mobility-informed testing strategies and the Mixing matrix M
The mixing matrix governs the evolution of the spatial distribution of infected individuals throughout the city at the initial stages of epidemic outbreaks, as proven in the Supplementary Information. For a Susceptible-Infected-Recovered (SIR) dynamics, defining ϵij as the fraction of population with residence in i and destination in j in the infected state, the former time evolution can be approximated as:
where β and μ denote the transmission and recovery probabilities. Expressing the former equation in matrix form, the evolution of the epidemic state of the population is given by the following linear equation:
The former expression neglects all nonlinear terms involved in contagions across the metapopulation, as it assumes a finite but negligible fraction of infected individuals across the metapopulation at early stages of the outbreak, i.e. ϵij(t) ≪ 1 ∀ i, j. This assumption is no longer valid when the epidemic prevalence is higher across the metapopulation; however, it allows us to envisage testing policies relying on the spectral policies of the Mixing matrix M. In particular, its leading eigenvector (overrightarrow{epsilon }) is expected to capture the spatial distribution of infected agents at the onset of an outbreak, thus providing an early estimate of the most vulnerable groups of population. As this eigenvector corresponds to individuals with different origins and destinations, we will refer to its elements as links L (origin-destination pairs) of the metapopulation.
Spatial allocation of tests
Mobility-informed policies relying on the Mixing matrix M are shaped by two parameters: ntests, determining the amount of resources available for testing the population, and L, dictating how many subgroups of individuals (links) are prone to be tested. Specifically, for each time step (day) in the agent-based simulations, ntests are distributed randomly among the pool of population composing the most critical L links identified by analyzing the Mixing matrix M. Specifically, following our analysis in the previous section, we assume that these links correspond to the L largest entries of the leading eigenvector of matrix M. This methodology allows us to evaluate whether concentrating resources on the most critical links or spreading them out across the city constitutes an optimal strategy to face an emerging epidemic.
Critical mobility links on the public transport network
While quite useful for surveillance purposes and the long-term control of epidemic outbreaks, mobility-informed policies that rely on the Mixing matrix M are not feasible due to practical difficulties in identifying specific subgroups of the population. As explained in the main text, we can take advantage of the information provided by the Mixing matrix M and implement a more plausible testing policy by allocating strategically test in the transport stations, based on the passengers’ entrance and exit. For this purpose, we need to project the information obtained from M to estimate the likelihood of a specific subgroup of users in the transportation network being infected. We focus our analysis on the city of Bogotá, for which we have extremely fine-grained demographic information from census data, the daily mobility patterns of the population from public surveys and the spatial distribution of the Transmilenio network, the Bus Rapid Transit network of the city.
To aggregate the mobility flows into the transport network, we use geographical location data of every Transmilenio station and assume people often use the closest stations to their origin and destination patches, in case they are located within a radius of 800 m from their associated city blocks. Therefore, we assign a set of weights Wiα to every patch i, representing the fraction of residents there using a nearby station α to travel to their usual destination. Note that these weights are indistinctively used to map stations with patches for both the origin and destination of each trip.
Oftentimes, every person from a patch i has the same nearest transport station α, i.e. Wiα = 1. Nonetheless, there are also scenarios, as the one visualized in Fig. 5b, for which patches are surrounded by different nearby stations, which are chosen disparately by the residents across the city blocks of those areas. In that case, weights are assigned as the proportion of residents who choose either of the stations.
Assuming that there is no correlation between the origin and destination stations, the number of individuals traveling from node i to j using the transportation line from station α to γ is:
which works for the number of infected agents in the same way:
Adding the populations of all the nodes that use a particular pair of stations gives us the projection of the mobility network onto the transport network. Therefore, we can compute the fraction of the population infected at the onset of the outbreak and using the transportation route connecting stations α and γ, ϵαγ, as
where nαγ (Iαγ) represents the total number of (infectious) users with origin at station α and destination at γ. Note that the proposed projection loses some accuracy in the localization of critical mobility flows because it can group people from different links in the same transport line. Nonetheless, as argued above, it represents a realistic approach that is very useful in diagnosing and tackling the progression of an emerging epidemic wave. The results shown in the main text using this criterion were obtained in the same way as previously described: ranking the transport lines according to their risk εαγ and targeting the most vulnerable ones when distributing the tests.
Control strategies on transport stations
To highlight the advantages of the control policies devised from the mixing matrix, other public transport-based strategies are also considered and compared to the main selection criteria from the study. These use information from the transport network to assign a certain value of centrality using different metrics in order to rank the transport lines and distribute the tests accordingly.
The most straightforward metric is focusing on the transit of transport stations, ({n}_{gamma }^{eff}), which represents the total number of public transport users arriving in a transport station γ each day. Namely,
This quantity is assumed to be equivalent for all users arriving in that station, i.e. ({n}_{alpha gamma }^{eff}equiv {n}_{gamma }^{eff}).
Another strategy here considered is leveraging the betweenness centrality of the transport stations. The betweenness centrality of a station (node) γ can be calculated with the number of shortest paths, between any pair of nodes (α,δ) in the network) that go through said node (σαδ(γ)) in relation to the number of shortest paths (σαδ) that connect them. This can be expressed as
where the distance network used to estimate the shortest path between nodes is defined as dαγ = 1/nαγ. This allows us to rank the transportation lines by the betweenness centrality of their destination as bαγ ≡ bγ.
Lastly, we also consider the eigenvector centrality pγ of the different transportation stations γ in the transportation network, as it measures the transitive influence of nodes in a network and is used as an estimation of importance in many epidemic scenarios. Note that this eigenvector centrality is computed over the network whose weights correspond to nαγ, i.e. the number of transportation users with origin at station α and destination at γ. We can rank the different transportation lines according to the eigenvector centrality of their destination as pαγ ≡ pγ.


Responses