Affective polarization and dynamics of information spread in online networks

Introduction
Democrats and Republicans in the United States not only disagree on many economic, political and cultural issues but have also grown less tolerant of opposing viewpoints, with members of each party disliking and distrusting those affiliated with the opposing party. The emotional divide—dubbed affective polarization by political scientists1,2—has become a destabilizing force in a democracy, reducing cooperation across party lines, stoking hostility towards out-group members3,4,5,6 and eroding trust in experts and institutions. For example, the polarized response to the COVID-19 pandemic led individuals affiliated with one political party to distrust recommendations from public health experts if they were supported by the opposing party, hindering effective response to the health crisis7,8,9.
Research shows that affective polarization is driven by factors including the news media, political elites, and demographics2,4,10. Although scholars disagree on how much social media contributes to partisan animosity11, many see it as an important amplifier12. Social media discourse tends to promote inflammatory language and moral outrage directed at the out-group13,14,15. Moreover, social media echo chambers, which segregate users within communities of like-minded others, may amplify political polarization by exposing users to extreme and divisive content16. Beyond echo-chambers, exposure to out-party views exists17 and may worsen political polarization18.
This paper describes an empirical study that makes a three-fold contribution to this body of research: we propose an instrument to quantify affective polarization in social media, establish an empirical relationship between emotions and structure of online networks, and characterize partisan differences in the dynamics of information spread on them. In contrast to existing research, which measures affective polarization by looking at how people talk about out-group members15,19,20,21, we focus on how they talk to them. We leverage state-of-the-art language models to measure emotions and toxicity of online interactions between social media users and demonstrate they exhibit the hallmarks of affective polarization1, namely in-group favoritism–out-group animosity. Moreover, these emotions vary with distance between interacting users in a social network, demonstrating an association between affective polarization and the structure of online networks. This idea is illustrated in Fig. 1: when replying to people closer to them in a network (e.g., a retweet network), users express more positive emotions, but when replying to those who are farther away, they express more negative emotions and toxicity. These findings are consistent across datasets of discussions about the COVID-19 pandemic22 and abortion23 on Twitter. Finally, we analyze the spread of information and show that discussions of contentious issues within partisan groups exhibit different dynamics. Some issues show random bursts of re-sharing, consistent with being driven by the news cycle, while others persist over longer periods of time, reflecting how their emotional salience to ideological divisions helps focus attention of polarized groups.

People express warmer feelings when replying to those closer to them in a social network; when replying to those farther away, they express more negativity.
Our study sheds light on the complex dynamics of affective polarization in the digital age, offering insights into the emotional foundations of political discourse on social media and the interaction of emotions with network structure and information diffusion.
Results
We study two massive datasets of online discussions on Twitter: tweets about the COVID-19 pandemic in the US and tweets about the overturning of the Roe v Wade decision that legalized abortion in US in 1973. We classify users’ ideology as liberal or conservative based on the text of their tweets, and use transformer-based language models to detect emotions and toxic language in their replies (see Methods). Finally, we identify contentious issues in online discussions and study dynamics of re-sharing by each ideological group. Table 1 summarizes statistics of the two datasets.
Emotions of In-group vs Out-group Interactions
We measure affective polarization by quantifying emotions expressed in reply interactions between users with a known ideology. In-group interactions are replies between same-ideology users: liberal replying to a liberal, etc. Out-group interactions are replies between opposite-ideology users: liberal replying to a conservative or vice versa. Figure 2 shows the distribution of emotion confidence scores of replies in the abortion dataset. Anger, disgust and toxicity scores of out-group replies are substantially higher than for in-group replies, consistent with out-group animosity. Similarly, in-group replies have higher scores for joy, consistent with in-group favoritism. We observe similar trends in the COVID-19 data (Supplementary Fig. 1). All differences are statistically significant. The differences between in-group and out-group interactions remain after disaggregating replies by ideology across both datasets (Supplementary Fig. 2 and Supplementary Fig. 3).
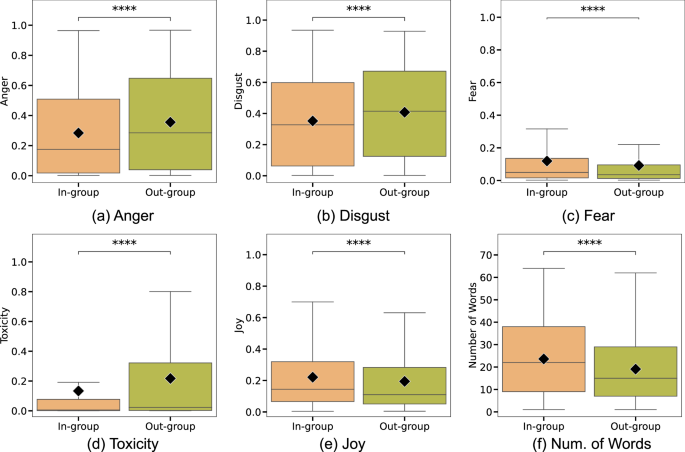
Boxplots show confidence scores of emotions expressed in replies interactions in the abortion discussions between same-ideology users (in-group) and opposite-ideology users (out-group). Out-group interactions show more a anger, b disgust, and use more c toxic language, but also slightly less d joy and e fear, and are generally f shorter in length (as measured by the number of characters divided by the maximum allowed length, 280 characters). The boxes span the first to third quartiles, with whiskers extending 1.5 times the interquartile range. The horizontal line inside the box represents the median, and diamond symbol marks the mean. Differences in means were tested for statistical significance using a two-sided Mann-Whitney U Test with the Bonferroni correction: * indicates significance at p < 0.05, ** – p < 0.01, *** – p < 0.001, **** – p < 0.0001 and, ns not-significant.
Our empirical analysis yields additional insights. We did not find significant differences in love, sadness or optimism. Out-group interactions are more emotional but shorter. Additionally, fear does not behave like other negative emotions in that it is higher for in-group interactions. This may reflect the role of fear as an agent of social cohesion. By identifying a common threat (see folktales and legends24,25), fear creates solidarity, which unites the group.
Figure 3 summarizes these results for both datasets by showing the difference between the mean emotion confidence of out-group and in-group replies. There exists a consistent emotion gap: interactions across ideological lines exhibit more negativity and toxicity, and less joy. Surprisingly, out-group replies are significantly shorter: in the Roe_v_Wade data, out-group replies are on average 17 characters shorter, while in the COVID-19 data, they are 8 characters shorter. Together with the finding that out-group interactions are more emotional, this suggests that people communicate across party lines not to convey information but rather to express animosity and to troll.
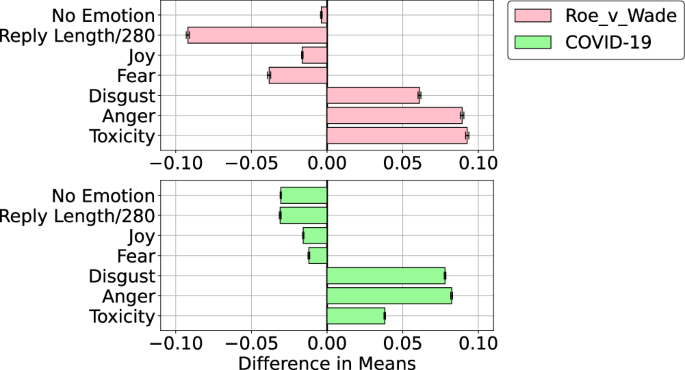
Difference between the mean emotion confidence scores of out-group and in-group interactions in the Roe_v_Wade and COVID-19 datasets. Error bars show standard errors.
Emotions and network distance
Next, we explore the interplay between emotions and network structure, using retweet networks to represent the online social networks (see Methods). Due to their large size, we use an embedding technique LargeVis26 to visualize the networks. Figure 4 shows the heatmap of these embeddings, with bright spots corresponding to dense clusters of users who frequently retweet one another.
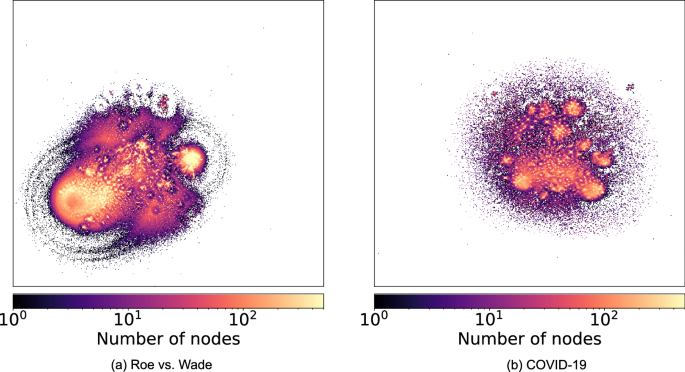
Each network was constructed by linking users who retweeted each other in online discussions about a) the 2022 overturning of Roe_v_Wade and b) the COVID-19 pandemic. The massive retweet networks were embedded in a lower-dimensional space using a graph embedding method. The heatmap of the embedding shows bright spots of densely-linked communities of users who frequently retweet one another. The retweet network of abortion discussions a shows two overaching polarized communities, while the network of the pandemic discussions b has a multi-focal structure.
The retweet network of the discussions in the Roe_v_Wade data (Fig. 4a) shows two main clusters with additional substructure near the larger cluster. The coarse-grained structure reflects the polarized nature of the abortion debate: most of the liberals are in the larger cluster and the conservatives are in the smaller one. The retweet network of the COVID-19 discussions (Fig. 4b) contains many small clusters. Although these discussions did grow to be polarized, during the first months of the pandemic covered by our dataset, these divisions do not appear entrenched.
We measure network distance between two users in the retweet network embedding space (see Methods). Figure 5 shows confidence scores of emotions in reply interactions as a function of network distance between interacting users in the Roe_v_Wade data. We divide the distances into four equal-statistics bins, or quartiles. The first quartile (Q1) represents the 25% of the closest pairs of interacting users, while Q4 represents the 25% of the most distant pairs. There are systematic differences in emotions: when users reply to those farther away in the retweet network, they tend to express more anger and disgust, and use more toxic language; while they tend to express more joy and fear in replies to closer users and also use more words. All differences between the quartiles are statistically significant.
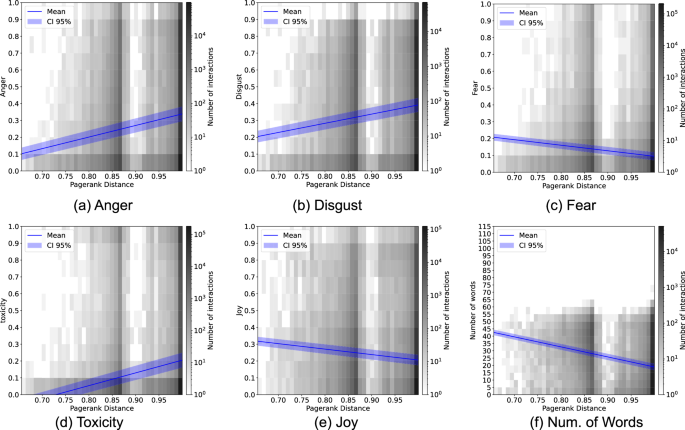
Each plot shows emotions in reply interactions as a function of network distance between interacting users. Network distance is calculated in the network embedding space and then divided into quartiles, with Q1 showing the 25% of closest interactions and Q4 showing the 25% of the most distant interactions. Emotions a anger, b disgust and c toxicity increase with distance between users in the network embedding space, while d joy and e fear decrease with distance, as does f reply length. The boxes span the first to third quartiles, with whiskers extending 1.5 times the interquartile range. The horizontal line inside the box represents the median, and diamond symbol marks the mean. Differences in means were tested for statistical significance using a two-sided Mann-Whitney U Test with the Bonferroni correction: * indicates significance at p < 0.05, ** – p < 0.01, *** – p < 0.001, **** – p < 0.0001 and, ns – not-significant.
To measure these trends, we perform linear regression on emotion confidence scores using network embedding distance as the independent variable (see Supplementary Figs. 4 and 5). Figure 6 brings together all regression coefficients across both datasets, showing similar trends across datasets, in agreement with Fig. 3. Refer to Supplementary Table 1 and Supplementary Table l for detailed regressions results. The relationship between emotional expression and network distance holds separately for in-group and out-group interactions and after disaggregating by ideology (Supplementary Figs. 7, 8). These results show that we can measure affective polarization even in the absence of partisan labels that define the out-group. Emotions and networks interact so that users feel warmer towards those who are closer to them and colder towards those who are farther away, regardless of group affiliation.
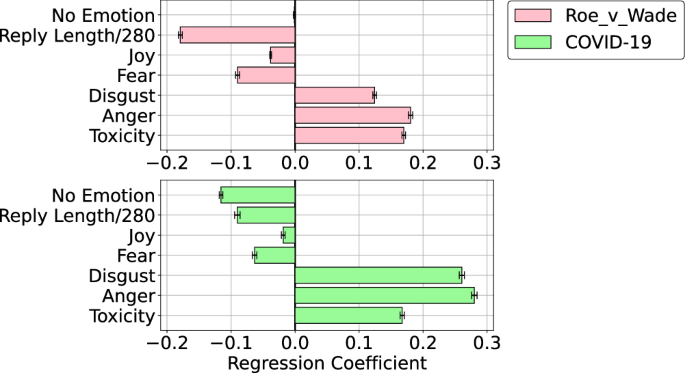
The bars represent the value of the regression coefficient of the emotion or toxicity of replies as a function of normalized distance between interacting users in the network embedding space. Distance was normalized by rescaling distances in the embedding space to unit interval. Error bars show 95% confidence interval.
For robustness, we calculate the shortest path length between pairs of nodes in the retweet network as an alternate measure of network distance. We find that the trends do not depend on how we measure network distance, with results largely remaining the same when using either metric (Supplementary Fig. 8), even after disaggregating by ideology (Supplementary Figs. 9 and 10).
Information spread in affectively polarized populations
Users interact across diverse network distances, seeing information shared by allies and foes alike. Their emotional reactions modulate attention to contentious issues, affecting how those issues spread through the network.
Roughly half of the tweets in the COVID-19 corpus discuss at least one contentious issue, such as vaccines, education, masking, lockdowns, or origins of the virus (see Methods). Attention to issues waxes and vanes as events drive partisan interest and the diffusion of tweets. Figure 7 (top row) plots the daily number of retweets of each issue by liberals and conservatives at different periods of the pandemic. The absolute number of retweets varies greatly due to difference in the size of the partisan groups. To address the imbalance we standardize the number of retweets within each group using z-score normalization.
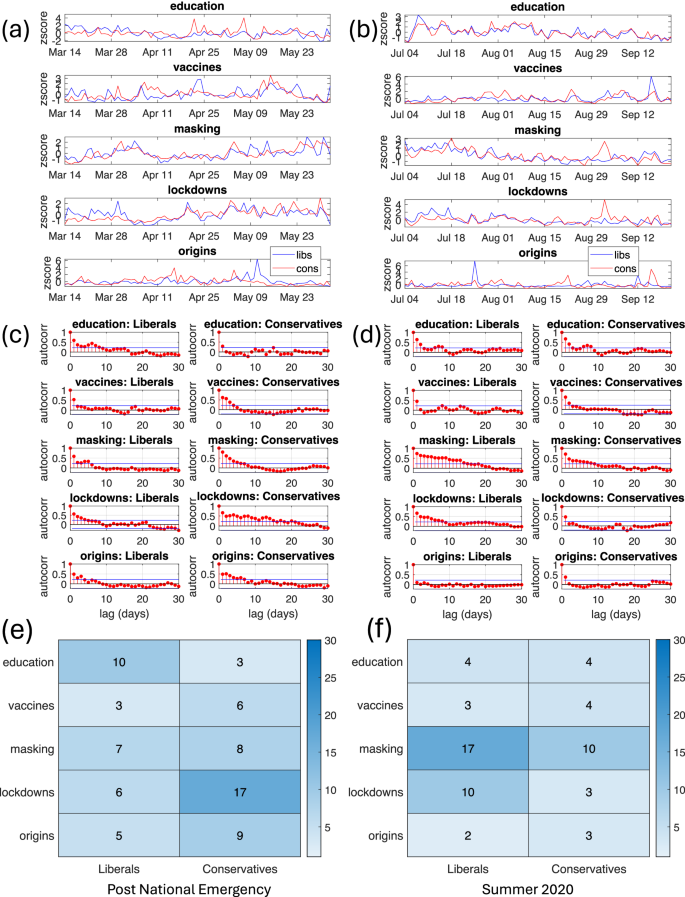
The figures (a, b) show the time series of the volume of retweets on each issue made by liberals and conservatives, (c, d) show the autocorrelation function of each time series, and (e, f) show the longest significant time lag, in days, of the autocorrelation function. Each column represents a different 80 day time period. The column on left highlights dynamics post declaration of National Emergency and the column on right highlights dynamics after the July 4th holiday weekend. The rows represent pandemic-related issues: education and online learning, vaccines, masking, lockdo wnsandsocial distancing, and origins of the coronavirus.
Each time series in Fig. 7 represents the complex dynamics of information diffusion within a group. To characterize these dynamics, we calculate the autocorrelation function (ACF), which measures the correlation of different points in the same time series, separated by time lags. The middle row of Fig. 7 shows ACF along with confidence intervals (blue lines). Some ACF plots show weekly patterns in the volume of retweets with peaks at 7, 14, etc. days. However, others show a rapid or gradual decay of ACF to non-significant values. The former trend is consistent with short-lived spikes in retweets occurring at random times, while the latter trend is indicative of persistent attention. The bottom row of Fig. 7 shows the time lags at which the ACF drops below the confidence interval. The early pandemic (post-President Trump’s declaration of national emergency, left column of Fig. 7) was characterized by school closures and challenges of online learning, a topic favored by liberals. Ending lockdowns and reopening the economy became an important issue for conservatives, culminating in protests at state capitals in April 2020. Consistently, discussions about education were persistent among liberals, while discussions about lockdowns were more persistent among conservatives. The summer of 2020 (right column of Fig. 7) saw mass protests for racial justice, sparked by the murder of George Floyd, in which many liberals participated. Since demonstrations required violating social distancing measures enacted to limit the spread of the virus (lockdowns issue), liberals promoted masking to stay safe, which made masking an important issue among both liberals and conservatives.
In June 2022, the Supreme Court reversed federal guarantees on abortion access made by the 1973 Roe v Wade decision. The decision, as well as the leak of its draft in May 2022, sparked debates on all abortion issues: women’s health, bodily autonomy, exceptions to abortion bans, religion, and fetal rights. The difference in the nature of information spread is evident in Fig. 8, which compares the autocorrelation function of the time series of the daily volume of retweets in the 80-day period before the leak and after the decision. Before the leak (left column of Fig. 8), the irregular bursts of retweets, triggered by events, which brought short-lived spikes of attention to issues. After the overturning of Roe v Wade, dynamics of information spread among conservatives changed, with issues related to religion, fetal rights and exceptions to abortion ban reverberating among this group.
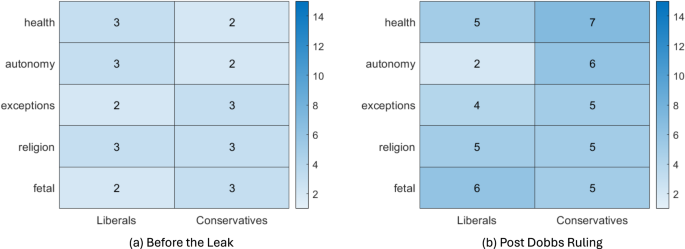
The figures (a, b) show the longest significant time lag, in days, of the autocorrelation function. Each column represents a different 80 day time period, (a) before the leak of the Dobbs decision, (b) after after SCOTUS’s Dobbs decision. The rows represent abortion issues, such as women’s health, bodily autonomy, exceptions to abortion bans, religion, and fetal rights.
Discussion
We investigated the emotional dimension of political polarization in online networks and the interplay between emotions, network structure, partisanship and dynamics of information spread. Analyzing emotions expressed in online discussions about abortion and the COVID-19 pandemic, we found that users expressed more emotions in their replies to opposite-ideology users and their valence had the hallmarks of affective polarization, namely “in-group favoritism, out-group animosity”1. Importantly, we showed that affective polarization generalizes beyond the in-group/out-group dichotomy. When accounting for network distance between interacting users in the retweet network, a proxy of the follower graph, anger, disgust and toxicity increased with distance, while joy largely decreased. These findings generalized across datasets and measures of network distance confirming robustness of findings.
Our findings shed more light on affective polarization. Only a subset of emotion and toxicity categories we measured displayed group differences: anger, disgust, fear, joy, toxic language and obscenities. Our study also revealed that like joy, fear is usually higher within in-group replies. This stands in contrast to previous studies27, but highlights the complex role of fear in social interactions. Studies of folklore and mythology suggest that fear helps social cohesion: by making threats salient, fear increases in-group solidarity24,26. In-group replies also tend to be longer, supporting the notion that they serve to share information within the group on how to negotiate threats.
One implication of this finding is that information may spread differently among interacting groups within the same population based on its emotional salience to each group. We saw some evidence for this in how liberal and conservative users shared various issues during the COVID-19 pandemic. Conservatives paid more attention to lockdowns during the early phase of the COVID-19 pandemic, as demonstrated by the persistence of retweets about lockdowns. During this period of time conservatives protested lockdowns, suggesting the emotional importance of this issue in differentiating them from liberals. At other times the lockdowns issue attracted short bursts of attention, triggered by events in the news. Similar patterns in our data point to the complex interplay between emotions, partisanship and dynamics of information spread within a polarized population.
Our results also highlight important differences between reply and retweet interactions. While researchers sometimes conflate them when building social networks, our findings suggest that these interactions serve a very different purpose and that combining them may obfuscate important features of network structure.
Like any study of social media, ours has limitations that tamper conclusions. By necessity, our datasets represented a small sample of online discussions, even when controlling for the topic. Replication of results in more representative samples of online discussions could help verify the generalizability of findings. Beyond biases introduced by keyword-centered tweet collection, not observing all interactions may have limited the range of emotions we observed. Similarly, retweets are a biased sample of the follower relationships28, which may have impacted our conclusions. Errors in partisanship detection, emotion and toxicity classification, may have further affected our findings. While we cannot discount all of these biases, the consistency of our results across datasets and scenarios gives us confidence about our conclusions.
Our study does not disentangle the directionality of the relationship between network distance and emotive expression, limiting its theoretical contributions. Despite this limitation, we believe that the descriptive analysis of the interplay between emotions and network structure is still valuable.
Another thing to consider is that our results could be explained by some confounder, rather than group polarization or network structure. For example, emotionally charged content is retweeted more frequently13, adding emotional texture to retweet networks. Moreover, Twitter’s personalization algorithm may highlight emotionally charged content, thereby driving engagement14, while rapid information spread within communities29 may also distort emotions. Although we cannot discount all confounders, the consistency of our findings across different datasets is encouraging.
Despite potential limitations like incomplete observability and data bias, the consistency of results across datasets and methods provides confidence in the conclusions of our study about the interplay between emotions, network structure and the dynamics of information spread across and within groups. Understanding these mechanisms is crucial for addressing challenges related to misinformation, polarization, and the health of public discourse in the digital age.
Methods
Data
We used a public corpus of tweets about the COVID-19 pandemic22, focusing on tweets posted between January 21, 2020 and April 22, 2020 in the analysis of polarization. Our second dataset is a public corpus of tweets about abortion rights collected between January 1, 2022 to January 6, 202323. The tweets contain keywords and hashtags that reflect both sides of the abortion rights debate in US during the period that Roe v Wade was overturned.
For both datasets, Carmen30, a geo-location tool for Twitter data, was used to link tweets to locations within US. Carmen relies on metadata in tweets, such as “place” and “coordinates” objects that encode location, as well as mentions of locations in a user’s bio, to infer their location. We used this approach to filter out users whose home location is not one of US states.
To study dynamics of emotional polarization and information spread, we focus on interpersonal interactions in online social networks. On platforms like Twitter, these engagements predominantly manifest through retweets and replies. Each retweet or reply post typically refers back to an original tweet, hereinafter referred to as the parent tweet. Furthermore, every retweet or reply record includes the ID of its author as well as the ID of the author of the parent tweet. We analyze all retweets and replies where both the author and the referenced tweet’s author are situated in the United States and discard the rest. Table 1 shows statistics of the resulting datasets.
Emotions & toxicity detection
Emotions represent feelings, which are often expressed through language. Early attempts to automate emotion recognition from text relied on emotion lexicons—curated collections of words categorized by their emotional content, e.g., LIWC31, EmoLex32, and WKB33. The advent of transformers has revolutionized emotion detection, which could now benefit from contextual cues.
To measure emotions we use an open-source library Demux34. This model was shown to outperform competing methods on the SemEval 2018 Task 1 e-c benchmark35. Demux assigns none, one or more emotions to input text, along with a scalar value representing its confidence score. The confidence score is the likelihood the tweet expresses that emotion. Demux can recognize a range of emotions in multi-lingual text, including anger, disgust, fear, sadness, joy, love, trust, pessimism and optimism.
To measure toxicity, we use an open-source classifier Detoxify (https://github.com/unitaryai/detoxify). The model is trained on the multilabel toxic comment classification task to recognize toxicity levels of tweets. The model outputs a score, a scalar value that captures the likelihood the tweet expresses toxicity, severe toxicity, obscenity, a threat, or an insult. In this study, we only use toxicity scores.
Ideology classification
To estimate the ideology of social media users, studies have relied on follower relationships36, mention and retweet interactions37,38, and URL sharing16,39,40,41. Here we use a method described in41 to classify individual Twitter users as liberal or conservative based on the text of the messages they share. The classifier leverages political bias scores assigned to well over 6K online sources by Media Bias-Fact Check (MBFC)42. Based on these scores, training data is created by assigning each user a score that is a weighted average of the political bias scores of the URLs they share. After training a text embedding-based model on this data, the classifier achieves state-of-the-art performance on recognizing user ideology.
Issue detection
Contentious issues that emerged during the pandemic include (1) the origins of the virus, involving debates over bats, wet-markets, lab leak and the gain of function research; (2) the implementation of lockdown measures via quarantines, business closures, social distancing and bans on mass congregation; (3) masking mandates and face mask shortages; (4) the impact of the pandemic on education with school closures and shift to online learning; and (5) vaccine-related discussions43,44,45,46,47.
The issues central to the abortion debate in the US48,49 include (1) religion and faith-based arguments against abortion; (2) views promoting primacy of fetal rights; (3) framing abortion as a bodily autonomy issue and freedom to choose; (4) abortion as a women’s health issue; and (5) the question of exceptions to abortion restrictions, for example, to save a woman’s life or in the case of rape or incest.
We leverage a method developed and validated in previous works to detect these issues. The method harvests relevant keywords and phrases from Wikipedia pages discussing specific issues, labels a subset of tweets using these terms and trains a transformer-based model on this data. The trained models were shown to achieve state-of-the-art performance recognizing pandemic and abortion-related issues in these datasets50,51. A tweet could discuss multiple issues or no issue at all.
Network construction
Studies of online social networks differ in how they represent edges between users. Some researchers16,52 use follower relations to capture the attention users pay to others. However, collecting follower links is highly impractical due to API limitations. Instead, researchers rely on retweets, which can be more easily extracted from the tweets metadata, to construct the social graph28. Retweet networks are foundational to social media analysis and have been used in studies of information spread53, virality prediction29, fake news54, online echo chambers16,55, political polarization37,56, and online discussions57,58. Following this practice, we construct a retweet-based social network for each dataset. Retweets are evidence that both the author of the original tweet and the author of the retweet were, at least on one occasion, exposed to the same information. Therefore, we model retweet networks as undirected, unweighted graphs whose nodes represent users and edges represent the existence of at least one retweet between them (in either direction).
We measure distance in networks in two ways. The first one uses the shortest path between two nodes in the retweet network. The second one measures Euclidean distance between nodes in the embedding space (Fig. 4) generated by the LargeVis model.
Reporting summary
Further information on research design is available in the Nature Research Reporting Summary linked to this article.

Responses