Virtual melting and cyclic transformations between amorphous Si, Si I, and Si IV in a shear band at room temperature

Introduction
The phenomenon of the virtual melting (VM) much below the melting temperature Tm as the mechanism of crystal-crystal and crystal-amorphous phase transformations (PTs) via intermediate melt was suggested in1,2. It was justified using simple thermodynamic estimates under zero1 and constant2 pressure and applied to organic crystals, geological materials, Si, etc. During thermally-induced β − δ PT in HMX organic energetic crystal, large internal stresses are accumulated at β − δ phase interface1. Since other stress relaxation mechanisms (such as generation and motion of dislocations and twinning) are suppressed, melting occurs within a few nanometer size layer within β − δ interface, at temperature 120 K below the thermodynamic melting temperature Tm, completely relaxing internal stresses. Simple estimates show that the additional thermodynamic driving force due to the complete relaxation of the energy of internal stresses is sufficient to reduce the melting temperature by 120 K. Since melt is unstable at stress-free conditions, it solidifies during a short time; that is why it is called virtual melt. In2 the VM was caused by crossing metastable continuation of the melting line to low temperature for materials with reducing melting temperature with growing pressure, like in ice3,4, quartz5, and Si6 (Fig. 1). For Al and Cu, melting temperature strongly grows with increasing hydrostatic pressure and reaches, e.g., 5434 K for Cu at 204 GPa7. The thermodynamic theory under uniaxial compression predicted that the thermodynamic melting temperature for the uniaxial stress in the range of 100-200 GPa is lower than the melting temperature under the same hydrostatic pressure by 8000–10,000 K (see Table S1 in7). It was found using molecular dynamic (MD) simulations7 under uniaxial compression of < 111 > Cu single crystal up to 204.9 GPa with a maximum strain rate of 4.3/ps that melting occurs at 300 K, i.e., at 5134 K below the melting temperature at the same hydrostatic pressure. A similar order of magnitude reduction in melting temperature was calculated for Al. Such a high strain rate is not necessary for melting itself but to suppress alternative mechanisms of stress relaxation, like dislocations and twinning. After completing the melting and reaching the hydrostatic state, crystallization occurs because the relaxation of nonhydrostatic stresses eliminates the thermodynamic driving force for melting. In this case, the virtual melt serves as the mechanism of plastic flow and relaxation of applied nonhydrostatic stresses. The virtual melt differs from the virtual or metastable amorphous solid by complete relaxation of nonhydrostatic stresses. A much smaller reduction in melting temperature was observed in MD simulations for Cu single crystal in the shock wave in8,9,10. A nonequilibrium but stable disordered phase was obtained in MD simulations near the friction surfaces under high normal stress in Si and diamond11,12,13,14,15,16. It differs from the VM or virtual amorphous phase because it does not disappear while sliding is continued.

a Experimental phase diagram reproduced with permission from56. b Phase diagram including the metastable continuation of the melting lines to low temperature for bulk and nanocrystals. Reproduced with permission from6. Increasing pressure at room temperature, if it does not cause Si I to Si II transformation and after crossing the melting line, may lead to melting followed by amorphization (see ref. 2). c Melting curves of Si I obtained by MD simulations (black dashed line with squares) and thermodynamic calculations (blue line). Reproduced with permission from57.
There are numerous experiments on melting/amorphization in shear bands in Si under static uniaxial compression17, scratching18,19, and dynamic loadings20,21,22,23. In17, amorphization occurred due to the accumulation of defects, which also was the case in MD simulations24. In20, VM melting was considered as the main amorphization mechanism; it was treated using a thermodynamic approach1 extended by the concept of the modified transformation work25,26. Besides silicon, many materials, particularly NiTi shape memory alloys27, multicomponent alloys21, brittle ceramics (e.g., silicon nitride), and geological materials (e.g., quartz, feldspar), can have shear-induced amorphous bands, and amorphization within shear bands is considered a mechanism of plastic deformations28.
Our focus here is on Si, the phase transformation under pressure in which is an intriguing phenomenon that has been studied extensively due to its relevance in fundamental materials science and planetary science, as well as applied fields such as semiconductor technology. When subjected to high pressure, silicon undergoes multiple phase transitions, significantly altering its crystal structure, electronic properties, and other physical characteristics. Pressure-temperature phase diagram of Si under hydrostatic loading up 18 GPa is shown in Fig. 1. At ambient conditions, silicon adopts the diamond cubic (Si I) structure, a semiconductor with a well-defined band gap. However, as pressure increases, silicon transitions through several distinct crystal structures. Si I first transforms into the metallic tetragonal β-Sn Si II phase in the pressure range from 11 to 13 GPa. With further increasing pressure, the Si II phase transforms into metallic orthorhombic Si XI (Imma) phase between 13 and 16.2 GPa, which then transforms into metallic Si V with a simple hexagonal structure in the pressure range from 16.2 to 37.6 GPa. However, upon unloading, silicon does not transform directly back to Si I phase. Instead, different metastable phases like semiconducting BC8 Si III and rhombohedral R8 Si XII are formed at slow unloading or amorphous phase at fast unloading. Semiconducting Si IV can be obtained from Si III or amorphous Si by annealing.
The important point for Si I is that its melting temperature reduces with increasing pressure (Fig. 1). At normal pressure, the melting temperature is Tm = 1, 683 K. Various options–experimental, MD, and thermodynamic calculations–give different melting curves, but all intersect the pressure axis at room temperature. Consequently, under hydrostatic loading at room temperature, if Si I to Si II phase transformation is suppressed, vitrification (amorphization) occurs. Such pressure-induced amorphization in Si I was claimed in6 for compression of nanocrystalline and nanoporous Si. In2, amorphization for materials with decreasing melting temperature was split into the VM (because the melting line is crossed) followed by amorphization (since the melting occurs below the glass formation temperature), and the corresponding thermodynamic and kinetic estimates were given.
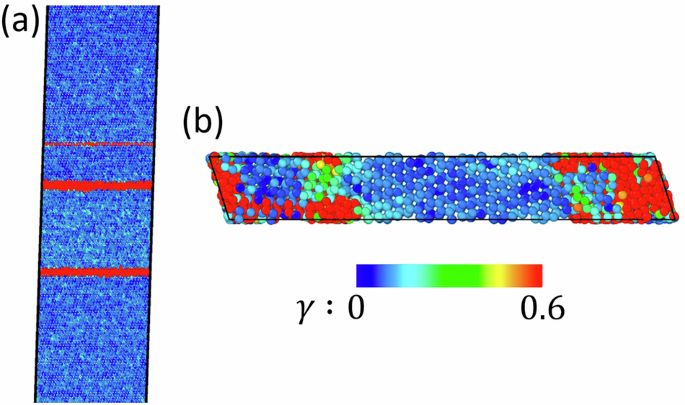
Nonhydrostatic stresses and plastic straining bring further complexity. Uniaxial compression of < 111 > Si I nanopillar leads to the transformation of Si I into Si IV in a shear band17, and, after accumulation of large density of dislocations, Si IV transforms to the amorphous band (Fig. 2). Amorphization, in addition to the thermodynamic driving due to the elimination of the energy of dislocations, also serves as an additional carrier for plastic deformation28.
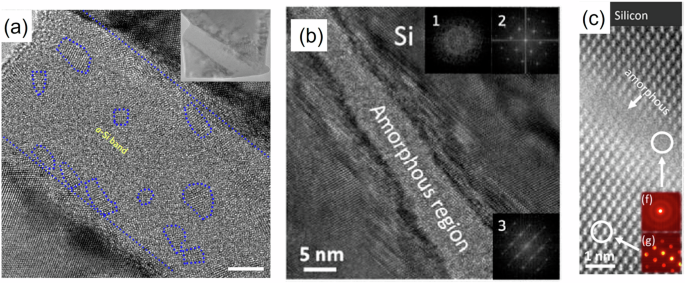
a Amorphous band obtained within larger Si IV band after its appearance in Si I 〈111〉 nanopillar under uniaxial compression. The scale bar is 5 nm. Residual nanosized Si IV clusters are marked by dotted blue circles. Reproduced with permission from17. b, c Amorphous shear bands in Si I shocked using a high energy laser. Reproduced with permission from58 and23, respectively.
The general phase diagram under nonhydrostatic loading and plastic straining is unknown, and data from different papers differ significantly due to different loading modes and precursor material, e.g., single or polycrystal, with different grain or particle sizes, etc. In addition to the reduction in phase transformation pressure for different phases, the transformation path can be changed29. Thus, Si I transforms to Si III under compression and shear at 0.6 GPa, while under hydrostatic loading it appears during unloading only. The coexistence of four phases, Si I, Si II, Si III, and Si XI, is found. Under some loading paths, Si II was quenched at normal pressure or transformed back to Si I, which does not happen under hydrostatic loading.
In addition to phase equilibrium or transformation diagrams, lattice instability diagrams for ideal crystals, leading to the barrierless appearance of an alternative phase, are also considered. Under general stress tensor, they are known for the PT from Si I to Si II only25,26.
To summarize, while shear-induced amorphization of Si under high pressure was observed in experiments and MD simulations, there is no proof that it occurs via VM. Reasons for shear-induced VM and amorphization, like elastic or phonon instability or thermodynamic melting, are unclear. To eliminate the promoting effect of pressure on melting, we will not apply pressure and consider simple shear loading. A strict thermodynamic approach, which utilizes constant applied stresses, is not applicable because melting in a shear band occurs under drastically reduced shear stresses. With the classical thermodynamic approaches30,31, reduction in the melting temperature of the stress-free solid caused by deviatoric stresses was estimated to be 1 K only. Here, we utilize MD and develop a new thermodynamic approach to reveal the main atomistic features and criteria for the simple shear-induced VM under normal pressure at 300 K. We also revealed and rationalized the transformation of the VM to the mixture of low-density amorphous a-Si, Si I, and Si IV with cyclic PTs between these three phases.
Vectors and tensors are denoted in boldface type; ({boldsymbol{m}}{boldsymbol{n}}=({m}_{i},{n}_{j})) is the dyadic products of the vectors m and n; ({boldsymbol{A}},{{cdot }},{boldsymbol{B}},=,({A}_{ij},{B}_{jk}),) and A : B = Aij Bji are the contraction of tensors over one and two nearest indices. Superscripts − 1 and T denote inverse operation and transposition, respectively. Averaged over the volume parameters are designated with the bar, i.e., for averaged shear stress (bar{tau }) and strain (bar{gamma }).
Results and discussion
MD simulations
MD simulations of the behavior of the perfect single Si I crystal under the shear displacement u along 〈110〉 direction on {111} plane at constant width h and average over the entire system temperature 300 K were performed. Effects of the free surfaces on the formation of the shear band were excluded by employing periodic boundary conditions along all three cubic directions. No external stresses were applied to avoid reduction of the melting temperature of Si Tm = 1683 K due to pressure. However, due to periodic constraints and h = const, internal normal stress appeared. Local temperature after the appearance of the shear band also varied, which was monitored. The sample width h has been varied from 1.8 to 160 nm in different problems. The averaged true (Cauchy) stress-shear strain (bar{gamma }=u/h) curves and the local shear strain and true stress fields in the sample are presented in Fig. 3. The averaged shear strain rate is (dot{bar{gamma }}=1{0}^{9}/s) before the shear band appears. With increasing shear up to point b, deformation represents uniform, simple elastic shear for any sample width. While the largest stress is the shear stress τyz, normal stresses are also essential, with large tensile σyy (in the vertical direction) and compressive out-of-plane σxx; stress σzz is small. Resultant tensile pressure should suppress melting. For all sample widths, instability leading to a disordered band starts at the same peak shear stress and corresponding strain for any sample thickness. Since the shear modulus at the peak shear stress is not zero, this is not elastic instability. Through the calculation of the Hessian matrix of the strained sample just before the instability point32, the instability mode is found to be that two atoms inside one primitive cell of Si move towards each other, which corresponds to the phonon instability of Si I33. The elastic stress-strain curve and the instability stress and strain are independent of the sample size (Fig. 3a). The entire process of the shear band formation occurs at almost constant averaged shear strain within 10 ps with a drastic drop of all stresses down to zero. For comparison, the VM in Cu under uniaxial loading completes within 1 ps7. This is a clear signature of the VM because amorphous solid supports shear and normal deviatoric stresses (see below).
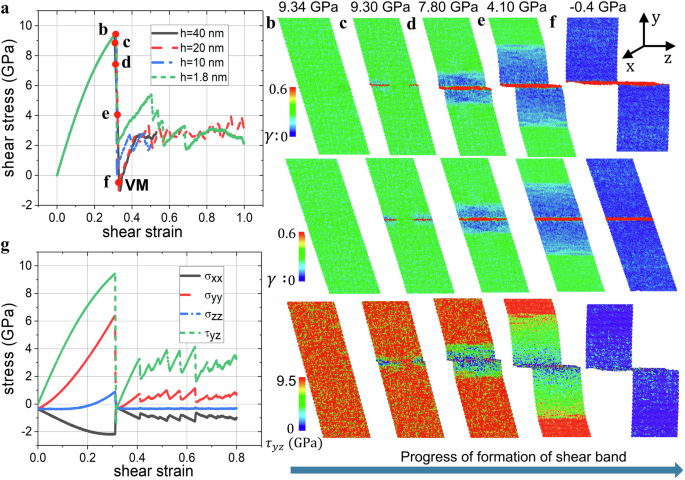
a Averaged shear stress-strain relations for constant strain rate (dot{bar{gamma }}=1{0}^{9}/s) and different sample widths. The red dots indicate the selected loading state for presenting the shear strain and stress snapshots. For widths h higher than 40 nm, shear stress-strain curves do not change. b–f The shear strain γ and stress τyz snapshots for corresponding states marked with the red dots in (a) for h = 20 nm. The shear stain γ is presented both in the actual configuration corresponding to the Lagrangian description of the initial rectangular box (top) and the wrapped configuration corresponding to the Eulerian box in the space coinciding with the actual configuration in (b) (middle). g Stress tensor components versus shear strain for the sample width of 20 nm.
Two atomic-thin disordered bands appear at different ends of the sample and propagate to each other until they coalesce into a single band. At this stage, shear elastic strain and stresses drop almost to zero in the band and this drop propagates as a wave toward the upper and lower end of the sample. When the wave reaches the ends of the sample, shear stresses and elastic strain in the entire sample are practically absent. Some overshot to small negative averaged shear stress is caused by dynamic process and viscosity of the melt. The width of the shear band is 0.9 nm, similar to that in shock experiments23 (Fig. 2c).
After complete stress relaxation, the VM is unstable. Since 300 K is below the glass formation temperature for Si, melt transforms to amorphous solid a-Si, as well as to stable Si I and metastable Si IV, with increasing of all stresses during the prescribed shear strain increment 0.1 within 100 ps. For comparison, the VM in Cu under uniaxial compression recrystallizes in ps time scale7. The amorphous phase is identified with radial distribution function (RDF) and bond angle distribution (Fig. 4). For RDF distributions, a non-disappearing value for a range up to 15 Å confirms that there is no long-range order in the amorphous phase. Compared with the different amorphous phases of silicon, our RDF confirms that our amorphous phase is the low-density amorphous phase34. A single prominent peak around 109o in its bond angle distribution function further proves the low-density amorphous phase35. For the virtual melt, RDF is the same as for amorphous phase.
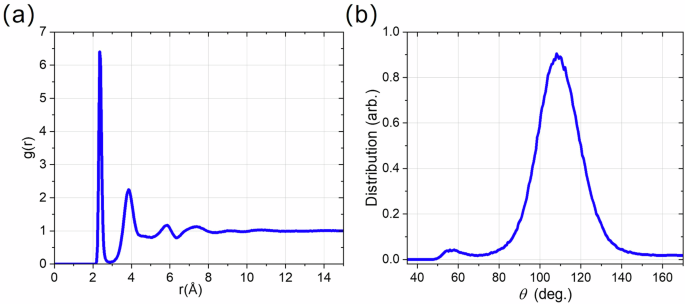
a Radial distribution function g(r) and (b) bond angle distribution function within the amorphous shear band formed in Fig. 3.
One may assume that the essential tensile stress σyy may potentially break bonds at the boundary between crystal and the disordered shear band and lead to drop of all stresses to zero, instead of VM. While bond breaking was not observed, to exclude the effect of normal stresses, simulations for shear with zero normal stress are carried out using the newly implemented command in LAMMPS: fix deform/pressure32. A sample with a height of 20 nm under the prescribed constant strain rate (dot{bar{gamma }}=1{0}^{9}/s) was studied. Shear stress τyz increased to 7.6 GPa with shear strain increased to 0.248 (Fig. 5a). After the maximum shear stress is reached, instability starts, and shear stress τyz drops to zero (Fig. 3) during the formation of the shear band with the VM (Fig. 5b). Then, shear stress increased during the transformation of the VM to an amorphous band. Thus, the processes are the same as in Fig. 3 for nonzero normal stresses. Consequently, bond braking due to tensile stress σyy cannot be the reason for the drop of all stresses to zero. This demonstrated that the formation of the VM is independent of the applied normal stresses, which is consistent with the thermodynamic treatment below. However, the lattice instability stress and strain reduce without normal stresses.
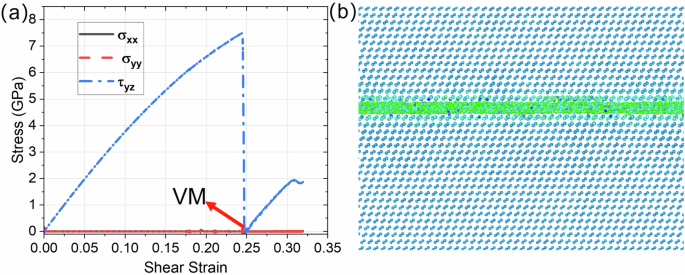
a Stress-strain relationships. b The shear band with VM formed immediately after the shear stress dropped to zero in (a).
Shear displacement was increased step by step, and within each step, the whole sample was relaxed within 100 ps, which is sufficient time to get an equilibrium state. The strain increment of each step of 0.002 was applied using the “jump” command in LAMMPS. When the shear strain reached 0.316, the same shear band and VM formation process happened, as in Fig. 3. Consequently, this process is independent of the loading strain rate.
The kinetic energy of each atom during the formation of the amorphous shear band is outputted from LAMMPS32. The kinetic energy is related to the temperature through the formula
in which Ekin is the total kinetic energy of the random motion of the group of atoms with respect to center of mass of this group, NDOF is the number of degrees of freedom of the group of atoms and kB is the Boltzmann constant. Calculation with Eq. (1) gives a temperature of 300 K for the kinetic energy of 0.04 eV and a temperature of 500 K for the kinetic energy of 0.07 eV, which corresponds to the two limits of the color bar in Fig. 6. For each layer in the xy plane, the bulk velocity of center of mass is calculated and then subtracted. Therefore, only the random motion of atoms for each layer is included for the calculation of temperature.
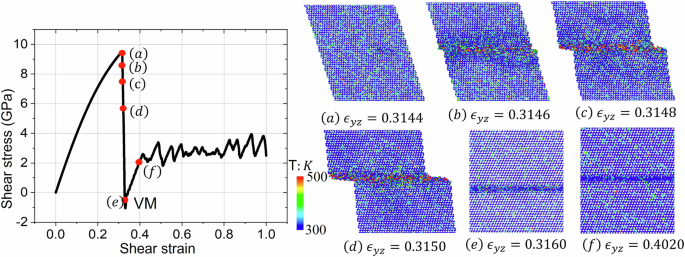
a Light increase in the kinetic energy of the atoms at the nucleation site. b–d During the formation of the shear band, the kinetic energy increases up to 0.07 eV equal to 500 K. e, f After the formation of the shear band with VM, the kinetic energy within the shear band drops to below 0.04 eV equal to 300 K.
Before the formation of the disordered shear band, the temperature of the whole sample was 300 K. With the nucleation of the shear VM band, the temperature at the local nucleation sites began to increase (Fig. 6a). During the formation of the VM band, temperature within the shear band rises up to 500 K in some regions (Fig. 6b–d). After the VM band has completely formed, the temperature within it cools down to 300 K. Therefore, during the formation of the VM band, the local temperature within the band does not exceed 500 K, which indicates that VM happened at a temperature much lower than the melting temperature of siliconTm = 1683 K. After the amorphous shear band formed, the temperature within the shear band reduces to the averaged temperature of 300 K. Thus, due to very thin amorphous band, plastic flow in it does not increase temperature, which is consistent with analytical estimates in36.
Size-dependent thermodynamic criterion for shear-induced virtual melting
Based on these results, a large-strain thermodynamic framework and criterion for shear-induced melting in a shear band is developed. The only work where melting under non-hydrostatic loading was considered a thermodynamic process rather than the equilibrium across a solid-melt interface is7. However, melting in7 occurred continuously and uniformly during uniaxial compression within some strain increment with the same axial stress at the beginning and completion of the melting. Since shear-induced melting occurs heterogeneously at (bar{gamma }=const) and stresses drop to zero, development of a different thermodynamic formulation is required.
The thermodynamic criterion for a PT in a volume V0 of the entire sample bounded by the surface S0 in the reference configuration is determined by utilizing methods that we developed for the PTs in solids37,38,39,40
Here (bar{X}) is the total dissipation increment during the PT, ψe is the elastic energy per unit undeformed volume, Δψθ(T) is the change in the thermal part of the Helmholtz free energy per unit undeformed volume as a function of temperature T, Γ0 is the interfacial energy per unit undeformed area, Σ0 is the interface, the indices 1 and 2 indicates the values before and after the PT. Eq. (2) combines the second law of thermodynamics and the assumption that the entire dissipation occurs due to melting only, neglecting plastic dissipation in the disordered phase during the PT process. Indeed, there is no dislocational or twinning plasticity within the crystal, and plastic flow occurs after sufficient disordering is developed, i.e., at the later stage and after the PT. We neglect this plasticity. The PT starts at the peak of the true stress and ends at the lowest stress; if the lowest stress is zero (or slightly negative), melting occurs; otherwise, PT represents amorphization. An increase in temperature from 300 K to 500 K during the VM process can be taken into via effective temperature, equal to the semisum of the initial and final temperature37,38, i.e., 400 K. We will neglect this temperature increase, slightly underestimating the driving force for melting.
The convenience of application of the criterion (2) to the entire sample rather than to any part that includes shear is because the PT occurs at the fixed displacements u at the surface and the first integral in Eq. (2) disappears. Then (bar{X}) depends on the initial (at the peak stress) and final (at the lowest stress for the same γ) states only and is independent of the disordering process. For melting, we assume that elastic stresses and energy disappear at each point, i.e., ({psi }_{2}^{e}=0); this increases the driving force in comparison with amorphization. Also, the crystal-amorphous interface has energy on the order of magnitude of the incoherent grain boundary, i.e., 1 J/m2, while the solid-melt interface has energy (0.01−0.1) J/m2. Thus, for comparable Δψθ, the VM process is much more thermodynamically favorable than the amorphization.
For a slab with the width h and width of the shear band hb, utilizing the homogeneity of all parameters within crystal and disordered phases before and after completing disordering, the dissipation increment per unit band surface can be obtained from Eq. (2):
Let us evaluate ({psi }_{1}^{e}) at the peak stress. The first Piola-Kirchhoff stress P is related to the Cauchy stress σ by equation P = J−1σ ⋅ FT−1, where F is the deformation gradient and J = detF = dV/dV0 is the Jacobian determinant describing the ratio of elemental volumes in the actual and undeformed configurations. For simple shear with the magnitude γ in direction m along the plane with the normal n, F = I + γmn, J = detF = 1, and F−1 = I − γmn. Then P = σ ⋅ FT−1 = σ ⋅ (I − γnm). In particular, for a shear component of P, Pmn ≔ m ⋅ P ⋅ n = m ⋅ σ ⋅ n = σmn = τ (we took into account orthogonality of m and n), i.e., the first Piola-Kirchhoff and the Cauchy shear stresses in the direction of shear m along the plane with normal n are the same. The elemental stress work per unit undeformed volume P: dFT = σ ⋅ (I − γnm): dγnm = σ: dγnm = σmndγ = τdγ. Since for elastic deformation before the instability strain γin, P: dFT = dψ = τdγ, then ({psi }_{1}^{e}=mathop{int}nolimits_{0}^{{gamma }_{in}}tau dgamma), i.e., it is equal to the area below τ − γ curve in Fig. 3a. Thus, despite the presence of normal stresses (see Fig. 3g), they do not produce mechanical work due to simple shear deformation and do not contribute to the thermodynamic driving force for shear-induced melting.
Dividing Eq. (3) by h and setting for melting ({psi }_{2}^{e}=0), we obtain for the dissipation increment per unit undeformed volume
Eq. (4) represents a size-dependent thermodynamic criterion for the VM in a shear band. Note that this is not a condition for the appearance of a critical nucleus because disordering occurs due to loss of stability and is, therefore, barrierless. This is a condition that disordering, which appeared due to material instability, could be transformed into the liquid within the shear band. For the melting below thermodynamic melting temperature Δψθ > 0, i.e., elastic energy release should exceed the size-dependent threshold due to changes in thermal energy and surface energy. While it looks like for a large enough sample width h this criterion can be satisfied for any material, this is not straightforward. For large h, multiple bands may appear (Fig. 7a), i.e., h is approximately the distance between shear bands. Also, the VM may be completed before the stress relief wave from the shear band reaches the top and bottom of the sample, namely when the fully unloaded part covers width h1 < h. Then, the same thermodynamic procedure results in Eq. (4) with h1 instead of h.
a Multiple shear bands formed for a sample width of 80 nm under simple shear. b For a sample width of 1.8 nm (i.e., smaller than the critical width of 2.1 nm), no shear band formation is found; discrete amorphous (red) regions are observed.
Change in the thermal energy during melting can be approximated as Δψθ(T) = Δψθ(300K)(1 − (T − 300)/(T − Tm)) with Δψθ(300K) = 41 kJ/mol = 3.39 × 10⁹ J/m3 20 (we took into account the molar volume of Si of 1.21 × 10⁻⁵ m3/mol) and Tm = 1, 683 K. In our simulations ({psi }_{1}^{e}=1.472times 1{0}^{9},J/{m}^{3}), hb = 0.9 nm, and Δψθhb = 3.051 J/m2. Assuming Γ0 = 0.1 J/m2, Eq. (4) at 300 K takes a form
For 0 K, Δψθ = 4.13 × 10⁹ J/m3 and keeping the same other parameters, we obtain h≥2.59 nm = 2.88hb.
To check this prediction, simulations with samples of several small h are carried out. When sample width is reduced to h = 1.8 nm = 2hb, shear stress dropped to 2 GPa only (Fig. 3a), and no shear band was formed (Fig. 7b). This is consistent with the prediction in Eq. (5).
Since for melting the surface energy of 0.1 J/m2 is 30 times smaller than Δψhb, it is negligible, and Eq. (4) reduces to
At the same time, for amorphization, the surface energy of 1 J/m2 is 3 times smaller only than Δψhb and is essential.
Thus, thermodynamic justification of VM versus amorphization (in addition to zero shear stresses) consists of 3 points: (a) bulk driving force for melting is larger; (b) crystal-melt interfacial energy is much lower than the crystal-amorphous interfacial energy, and (c) melting does not occur when the derived thermodynamic criterion Eq. (5) is violated.
Alternative mechanisms to the VM, like dislocation motion and twinning, were not observed because the initial crystal was defect-free. To nucleate dislocation or twin, stresses need to reach lattice instability. However, after reaching lattice instability, the VM occurs, as a thermodynamically admissible process. It is followed by amorphization and cyclic PTs between a-Si, Si I, and Si IV as processes that better accommodate prescribed shear strain than dislocation and twin nucleation and motion. As discussed in the literature17,18,19,20,21,22,23,28, amorphization is a well-documented mechanism of plastic deformation competing with other mechanisms.
Cyclic a-Si ↔ Si I, a-Si ↔ Si IV, and Si I ↔ Si IV phase transformations
After the formation of the shear band, the entire inelastic shear deformation is concentrated within the shear band, while the rest of the sample is in an elastic state. Figures 8 and 9 present evolution of the nanostructure (Fig. 8A–G), volume fraction of phases (Fig. 9a), shear stress distribution at the selected time instant (Fig. 8F), and shear stress-strain curves for each phase (Fig. 9b) and (with larger strain steps) mixture (Fig. 8H). Several PTs occur within the shear band. Since melt is unstable at zero (or small) shear stresses and the system is below the glass formation temperature, melt transforms fast into an amorphous solid capable of supporting the shear stress. Based on a specific volume of a-Si and angular distribution function, this low-density a-Si is identical to that obtained by quenching at zero pressure from the melt. Simultaneously, Si IV and (in smaller amounts) Si I nanocrystals nucleate stochastically and, in most cases, uniformly within the entire volume of the amorphous band instead of their heterogeneous nucleation at the boundary between a-Si and the initial Si I crystal or continuous growth of Si I crystal. This is one more essential difference between traditional and shear-driven PTs. Si I mostly appears at the boundary between Si IV and a-Si, but there are also Si I clusters within Si IV and a-Si. While the change in volume fraction of phases is monotonous for 0.31 < γ < 0.41, stress oscillates and drops in the first cycle from 1 to 0 GPa, i.e., amorphous phase fluctuationally transforms for a very short time to VM. Stresses are the same in each phase for γ < 0.35, implying that crystals are within the disordered phase, which is a transitional state between VM and the amorphous phase. For 0.41 < γ < 0.42, i.e., between points C and D, the next small increase and then large decrease in volume fraction of a-Si occurs along with an increase in volume fraction of Si I by 0.22 and decrease in volume fraction of Si IV by 0.11. This process is accompanied by a drastic change in the morphology of phases, coarsening of Si I and Si IV crystals, and finally, formation at point E of a layered structure including two continuous a-Si and Si I bands. Stress in a-Si drops to 1 GPa, which along with the formation of continuous a-Si bands leads to stress drop in crystalline phases and mixture. Between points C and E, all possible PTs, a-Si ↔ Si I, a-Si ↔ Si IV, and Si I ↔ Si IV, occur in both directions in different regions, including nucleation and continuous growth. Such PTs include Si I ↔ Si IV PT via intermediate a-Si. PT from stable at normal conditions Si I to the metastable Si IV during plastic deformation experiment is reported in the literature17,41,42,43.
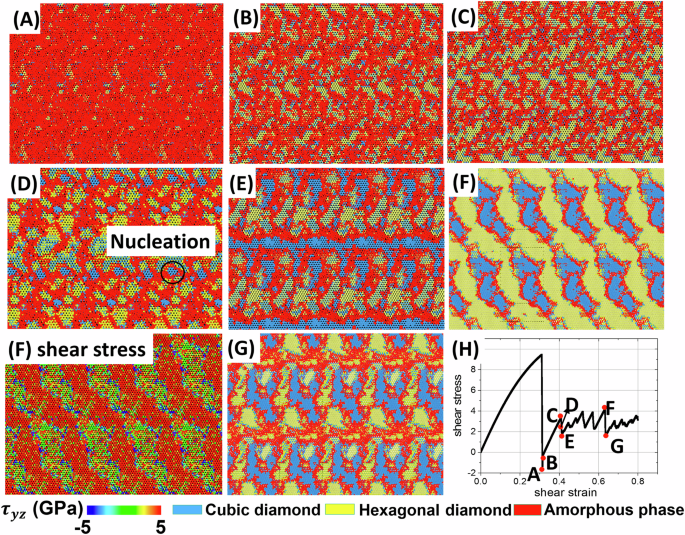
Snapshots of cubic diamond, hexagonal diamond, and amorphous phases are presented in (A–G), corresponding to the points in the shear stress-strain curve in (H). For point F in (H), the stress distribution is also presented.
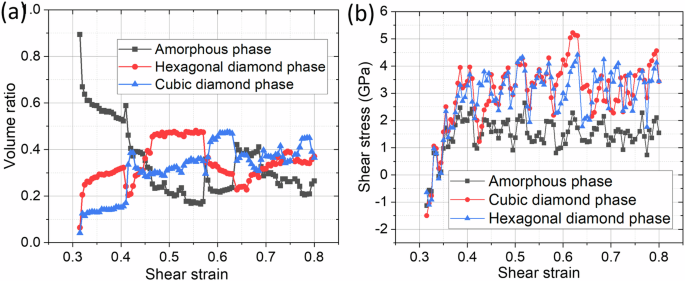
a Evolution of volume fractions of each phase inside the shear band with increasing shear strain. b Evolution of average shear stress over each phase inside the shear band with increasing shear strain.
Atomic structures of Si I and Si IV are shown in Fig. 10. Cubic diamond structures have three different stacking layers, while hexagonal diamond structures have two different stacking layers, as shown in Fig. 10. Si I and IV have the same atomic volume. Hexagonal diamond structures can be formed by the motion of partial dislocations that produce different stacking sequences in silicon44, similar to twining. This is the main reason for the appearance of a metastable Si IV: to accommodate prescribed compression strain and relax stresses, like twinning does.
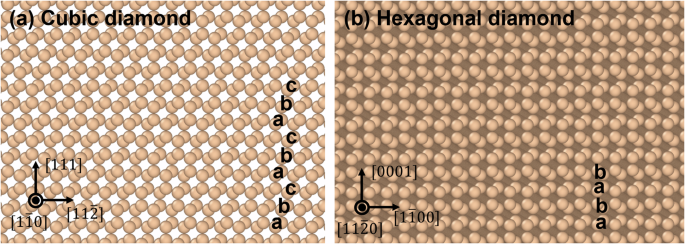
a Cubic diamond and (b) hexagonal diamond.
The volumetric strain of 7.5%6 during amorphization/crystalization of Si I and IV within the shear band creates internal normal stresses. Based on the solution in36, they produce large transformation-induced plasticity (TRIP), which was used to quantitatively explain the large PT-induced shears during deep-focus earthquakes. Note that TRIP strain is independent of the sign of the volumetric strain, i.e., it occurs in the direction of shear stresses for both direct and reverse PTs. TRIP paradoxical result: despite the PT from weaker a-Si to stronger crystalline phases, shear stress relaxes. At the atomistic level, TRIP cannot be distinguished from traditional plasticity because both are caused by local shear stresses.
With further straining, cyclic PTs between three Si phases occur without any specific repeating morphological patterns and patterns in volume fraction evolutions. Oscillations in stresses in phases are much more frequent than in volume fractions of phases, caused by the elemental act of plastic deformation in amorphous materials related to a series of irreversible rearrangements in small shear transformation zones45,46. These rearrangements are similar to thermal fluctuations, which give numerous chances for PT to the stable or metastable crystalline phases to occur under prescribed shear. Other reasons for oscillations and non-repeatable patterns are caused by changes in crystal orientations and morphology of phases. Shear stress in a-Si cycles mostly between ~ 1 and 2 GPa, and in crystalline Si, mostly between ~2 and 4 GPa, with some outliers. The volume fractions of phases cycle mostly between 0.2 and 0.4, with some outliers. At point F, Si IV dominates over Si I with a small amount of a-Si at the interfaces between Si I and IV and grain boundaries. Shear stress in Si I exceeds 5 GPa. However, such a system is unstable because it cannot accommodate large plastic shear. That is why both Si I and IV partially transform to a-Si with a large stress drop caused by TRIP, producing two bands of mostly a-Si as a carrier for further plastic straining.
After the release of shear stresses, the shear band and volume fraction of a-Si, Si I, and Si IV remain unchanged, i.e., they are recoverable and can be compared to known experiments. In experiment17, Si I within the shear band transforms to Si IV and, after accumulation of significant dislocation density, to a-Si. The experiment in17 involves compression of < 111 > pillar, which explains the difference in the processes and an order of magnitude larger width of the shear band than here (Fig. 2a). However, the final structure in17 consists of a mixture of a-Si and Si IV, like here (excluding Si I). After shock loading in20, nanocrystallization of amorphous Si occurs.
Theoretical kinetic equation for strain-induced PTs between three phases47 has a stationary solution for large plastic strains under constant stresses. Here, we have cyclic stochastic direct-reverse PTs between a-Si, Si I, and Si IV, which challenge the existing theory and will be addressed in the future.
To summarize, VM as an alternative deformation and stress relaxation mechanism to dislocation and twinning plasticity is directly validated by MD simulations for the simple shear of single crystal Si I at a temperature 1,383 K below the melting temperature. MD results are shown to be independent of the applied shear strain rate. Since pressure was not applied, we did not utilize a reduction in melting temperature with pressure, in contrast to previous papers6. Si I lattice loses its stability due to phonon instability, forming a nano-meter thick disordered shear band. The advanced thermodynamic criterion for VM as a deformation-transformation process, which depends on the ratio of the sample to shear band widths, h/hb, is derived analytically and confirmed by MD simulations. The main driving force for the VM is the reduction of elastic energy in the entire sample down to zero, which is utilized to overcome barrier due to the change in thermal and surface energy within the shear band; this is the reason for the dependence of the criterion on h/hb. Thermodynamic justification of VM versus amorphization consists of 3 points: (a) bulk driving force for melting is larger; (b) crystal-melt interfacial energy is much smaller than the crystal-amorphous interfacial energy, and (c) melting does not occur when the derived thermodynamic criterion Eq. (5) is not met. In addition, all stresses drop to zero, while for the amorphous phase, they are finite. MD simulation of VM, when all normal stresses are released, excludes the possibility of the stress drop due to bond breaking.
With further shear, the VM immediately transforms to a mixture of low-density amorphous a-Si, Si I, and IV, which undergo cyclic transformations a-Si ↔ Si I, a-Si ↔ Si IV, and Si I ↔ Si IV with volume fraction of phases mostly between 0.2 and 0.4 and non-repeatable nanostructure evolution. Such PTs include Si I ↔ Si IV PT via intermediate a-Si. Surprisingly, Si IV and Si I nanocrystals nucleate stochastically and, in most cases, homogeneously within the entire volume of the amorphous band instead of their heterogeneous nucleation at the boundary between a-Si and the initial Si I crystal or continuous growth of Si I crystal. Such a crystallization is plastic strain-induced. The atomic rearrangements in the small shear zones of amorphous material, as the primary mechanism of plastic deformation in them, are similar to thermal fluctuations, which give numerous chances for PT to the crystalline phases to occur under a prescribed shear. However, when the total volume fraction of crystalline phases exceeds 0.8, this suppresses plastic flow in a-Si, shear stress grows and causes jump-like transformation to a-Si and Si I ↔ Si IV PTs in different regions of the band. Si I ↔ Si IV PTs produce shear transformation strain through the propagation of the partial dislocations, creating an additional mechanism for plastic accommodation of prescribed shear strain and stress relaxation. Cyclic stochastic direct-reverse PTs between a-Si, Si I, and Si IV challenge the existing theory for strain-induced PTs. Release of shear stress quenches the shear band and volume fraction of a-Si, Si I, and Si IV. The shear band width of 0.9 nm is in agreement with that in shock experiments23 (Fig. 2c). A retained mixture of a-Si and Si IV (but without Si I) is observed in17 (Fig. 2a). Nanocrystallization from amorphous Si after shock loading was also found in20.
Similar phenomena under shear may occur in various strong crystals, like Ge, superhard cubic and hexagonal diamonds and BN, and SiC during friction and wear, surface treatment (polishing, turning, scratching, etc.), intense dynamic loading, and shock waves. Due to the transient character of the VM and high frequency of cycling, these phenomena may be missed in experiments and also in simulations.
Methods
Molecular dynamics simulations
In this work, classical molecular dynamics simulations were performed using the LAMMPS package32. The temperature was controlled with a Nosé-Hoover thermostat (i.e., NVT ensemble) to dissipate excess thermal energy. The employed interatomic force field for the interactions between Si atoms was from the Stillinger-Weber (SW) potential48. This potential has been demonstrated to successfully describe the crystal and amorphous phases of silicon and their mutual transformation49,50. The latest machine learning potential51 was also employed; the results are the same as with the SW potential. Here, the virial stress for each atom is considered equivalent to the Cauchy stress52. The atomistic configurations were visualized and analyzed by the OVITO software53. The x, y and z directions of the simulation box are〈112〉, 〈111〉 and 〈110〉. The common simulation dimensions are 15.4, 37.6, and 13.3 nm along x, y, and z directions, which contain 38, 400 atoms. The height along the y direction, h, is varied from 1.8 to 160 nm in order to check how the amorphous shear band changes with the variation of the simulation height.
Identifying crystalline structures
The crystalline phases of silicon are identified mainly through the following two methods. The first is the command: Identify Diamond Structure in OVITO software53, which utilizes the second nearest neighbors to discriminate the cubic and hexagonal diamond structure54. The second method is the neural network phase recognition method55, which identifies cubic diamond (Si I), hexagonal diamond (Si IV), R8 (Si XII), BC8 (Si III), β-Sn (Si II), sh (Si V), BCT5 and ST12 (Si XI) structures with the accuracy above 95%. Unidentified disordered structures are considered amorphous. Both recognition methods generate the same distribution of cubic diamond, hexagonal diamond, and amorphous phases.


Responses