Exploring high-performance viscosity index improver polymers via high-throughput molecular dynamics and explainable AI
Introduction
The development of high-performance materials often brings revolutionary advancements to human production and life. However, the traditional Edisonian process, which relies heavily on expert experience and trial-and-error synthesis, significantly hinders the progress of new material development. In 2011, the Materials Genome Initiative (MGI)1 was proposed as a new paradigm for material research and development, aiming to significantly enhance efficiency through high-throughput computation, experimentation, and big data technologies. In recent years, machine learning (ML) has made remarkable progress, transitioning from theoretical research to market applications in fields such as natural language processing2, computer vision3, and computer-aided drug design4. These advancements have opened new opportunities for the MGI-endorsed paradigm, fostering the emergence of materials informatics (MI)5, an interdisciplinary field that integrates ML and materials science to achieve material optimization, prediction, and design.
The performance of ML models is determined by both algorithms and data, with data being the critical bottleneck in current ML applications to MI6,7. Experimental data often suffers from poor quality due to differences in synthesis and testing standards, while theoretical computational studies typically focus on a limited number of features, resulting in a scarcity of data. This scarcity of high-quality, large-scale data has caused the development of ML algorithms to outpace their application in MI. Consequently, ML algorithms used in MI primarily involve traditional methods suitable for small datasets, such as random forest, multilayer perceptron, support vector machine, and Gaussian process regression8. Advanced ML algorithms for large models, such as Transformers, Generative Adversarial Networks (GANs), and various deep learning algorithms, require vast amounts of data for reliability. For instance, Merchant et al.8 demonstrated that a deep learning model’s accuracy and generalization significantly improved as the data volume increased from 104 to 107. Similarly, our previously proposed GAN-based framework, “Lubrication Brain”, utilized 100,000 data points labeled by a pre-trained feedforward neural network to generate high flash point ester9. Therefore, the efficient and cost-effective production of high-quality data is crucial for achieving ML-driven material innovation.
Density Functional Theory (DFT) has demonstrated significant potential for high-throughput computing, whether in the establishment of material databases or the prediction and screening of high-performance molecules10,11. DFT has made important contributions to the creation of databases for inorganic materials and lightweight organic molecules, including the Materials Project12 (~140,000 inorganic compounds), AFLOW13 (~300,000 inorganic compounds), and QM914 (~134,000 organic molecules). However, for a broad category of soft condensed matter, such as polymers, liquid crystals, surfactants, colloids, and biomolecules, DFT faces challenges due to the difficulties in the system size (or computational cost) constraints. These fields often rely on researchers’ experience with a limited number of compounds and manual feature combinations, resulting in high-quality datasets that are typically in the thousands or even fewer15.
Molecular dynamics (MD) has been leveraged for its efficiency in computing various physicochemical properties at the million-atom scale, driving research in the innovative design of high-performance conductive16,17, thermal18,19, and organic optical20,21 materials. Currently, MD primarily serves as a tool for mechanism analysis and result validation in the application of ML to materials prediction and screening studies. Research directly using data from high-throughput MD as a source dataset is still in its early stages. Yang et al.22 constructed multitask ML models based on small datasets from experiments and MD data, successfully screening thousands of high-performance polymer materials for gas separation membranes (778 data points). Using typical polymer molecular structure features as descriptors, Alesadi et al.23 developed a polymer prediction model for superior thermodynamic properties using an ordinary least squares multiple linear regression algorithm (145 data points). Their study utilized MD to reveal the effects of molecular structure on glass transition temperature and local mobility, offering potential solutions for further improving solar cell performance. In these studies, MD has been employed to validate screening results, showing good consistency. Additionally, in the virtual screening and feature analysis of high-performance thermal conductivity polymers, Huang et al.19 constructed a dataset of ~1200 entries using non-equilibrium MD calculations. By incorporating physical descriptors, they effectively improved the predictive performance of machine learning algorithms, such as XGBoost and MLP, for polymer thermal conductivity. However, the dataset primarily consists of polymers with a low degree of polymerization (<10), which limits the model’s ability to predict the thermal conductivity of high molecular-weight polymers. Compared with experimental data, these advancements demonstrate that MD offers both accuracy and atomic-scale physical insights while enabling the efficient production of high-quality data. Although high-throughput MD simulations entail significant computational costs, they are acceptable for initiating ML-assisted material innovation cycles, particularly in data-scarce fields such as soft condensed matter (e.g., polymers).
Liquid lubricants, which address issues of friction, wear, and energy consumption (accounting for about a quarter of global energy use24), are a prime example. This includes viscosity index improvers (VII), a crucial class of polymer additives in lubricants25. VII is typically blended with base oils, utilizing the adaptive regulation of polymer chain configurations and intermolecular forces with temperature to mitigate the thinning effect (viscosity reduction) caused by heating. The viscosity index (VI) is used to quantitatively measure the change in viscosity with temperature.
Shear viscosity, as a fundamental transport property of fluids, has been the focus of several studies aimed at developing viscosity prediction models and improving viscosity calculation methods using ML combined with MD. These studies include applications to base oils26,27,28, ionic liquids29, biofuels30, extractant31, and binary liquid mixtures32. However, the viscosity datasets in these studies are primarily collected through manual experimental testing, which is inconsistent with the new material research paradigm advocated by the MGI. Additionally, these studies focus on small molecules, making the data unsuitable for VII predictions. To date, research on VII has been limited to a few polymers: polyisobutylene (PIB), polymethacrylate (PMA), olefin copolymers (OCP), and hydrogenated styrene-diene copolymer (HSD)25. Experimental studies have shown that the regulation of viscosity-temperature performance by these VIIs is related to the chemical structure, molecular weight, concentration of the VII polymers, and base oil33,34,35. However, due to the sparse data, it is challenging to use ML in this context.
Therefore, high-throughput MD shows promising prospects for initiating data-driven material innovation cycles in soft condensed matter like VII, where data are extremely sparse. Current challenges for high-throughput MD applications in soft condensed matter (such as VII) include: 1) technical issues in high-throughput computing processes; 2) correction of systematic errors in MD; and 3) computational cost issues. Hayashi et al.36 developed the RadonPy open-source library for high-throughput MD-driven polymer innovation design, which can automatically batch compute 15 properties of amorphous polymers, including thermal conductivity, specific heat capacity, and density. However, it does not include viscosity, and modeling of mixed systems (such as VII and base oil lubricant) remains to be expanded.
Universal and accurate equations that serve as the foundations of science, such as Newton’s laws and the Schrödinger equation, can be viewed as highly generalizable models of key physicochemical features to target properties. Similarly, in MI, we are exploring the quantitative structure-property relationships (QSPR) from molecular structures to target properties. The selection of key features with clear physical meaning is essential for accurately establishing QSPR, but this process requires researchers to have substantial physical insights. Automated molecular feature engineering can effectively mitigate the limitations of domain knowledge on data-driven material design37. Furthermore, good interpretability is one of the key goals in the development of machine learning algorithms, especially when applied to fields such as physics, chemistry, and materials science. Transparent algorithmic decision processes can provide researchers with insights of physicochemical significance, potentially fostering the establishment of new scientific frameworks38. Symbolic regression in ML has been widely applied in physics due to its superior interpretability, such as in the Hamiltonians of simple harmonic oscillators and double pendulum systems39, control equations of gas turbine engines under multiple constraints40, and the effects of temperature and pressure on hydrogen viscosity41. It has also been extensively used in finance and psychology42. Although its application in chemistry and materials science is still in its early stages, this method shows great potential for revealing QSPR in the vast chemical space due to its interpretability and ability to uncover complex multidimensional nonlinear functions.
To tackle two significant challenges in applying machine learning to materials science—data scarcity and model interpretability—this study presents a case study focused on VII, illustrated in Fig. 1a. We constructed an automated curation pipeline that integrates data production (high-throughput MD), feature engineering, virtual screening, and mechanistic model development. This approach is generally applicable to data-sparse fields in materials science, particularly soft condensed matter, as illustrated in Fig. 1b.
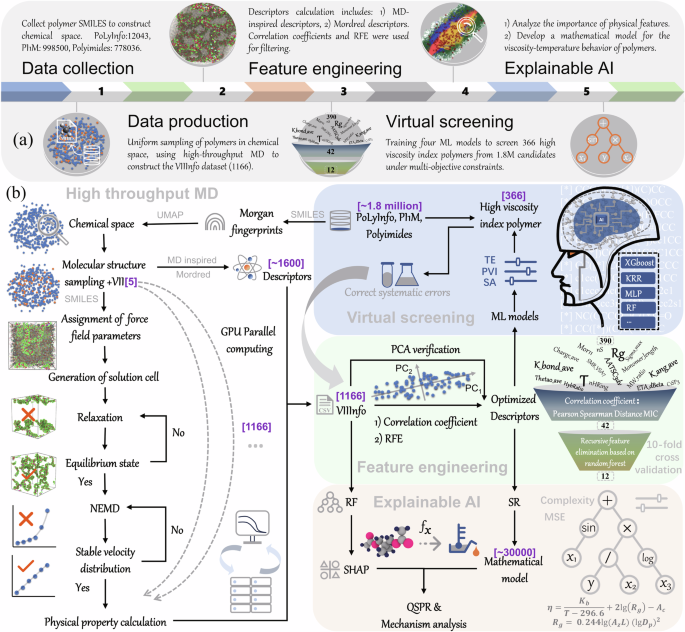
a Overview of the workflow, including data collection and generation, feature engineering, virtual screening, and explainable AI; b Detailed technical pathway: The VIIInfo dataset was generated through automated high-throughput MD. Descriptor selection was performed using correlation coefficients and Recursive Feature Elimination (RFE). High-throughput virtual screening under multiple constraints was conducted using accurate algorithms (XGBoost, KRR, MLP, RF). Finally, quantitative structure–property relationships (QSPR) were developed and analyzed using interpretable SHAP and symbolic regression (SR).
During the data collection and production phase (High-throughput NEMD viscosity calculation), high-throughput MD require only a Simplified Molecular Input Line Entry System (SMILES) for automating the computational workflow, which includes force field configuration, job batching, anomaly monitoring, and data aggregation. To address the limited variety of molecules (e.g., only five types of VII), a database uniform sampling strategy was employed for data augmentation (see Table S1). In the feature engineering phase (Descriptors filtering and ML model training), for the polymer lubricant dataset VIIInfo, a dual descriptor selection was implemented: initial statistical filtering based on correlation coefficients, followed by machine learning optimization using Recursive Feature Elimination (RFE), and validated against Principal Component Analysis (PCA). Subsequently, in “Feature analysis” and “QSPR mathematical model construction”, the optimized descriptor set facilitated high interpretability analysis of feature importance and mathematical model development, combining SHapley Additive exPlanations (SHAP)43 and symbolic regression (SR)44. Meanwhile, “Discovery of high-performance VII” employed complex machine learning models with high precision but lower interpretability for multi-objective constrained virtual screening.
Our contributions can be summarized as follows: 1) Novel automated pipeline: We developed a versatile and comprehensive automated pipeline for materials innovation, suitable for data-sparse fields. 2) The largest polymer VI dataset created: The largest dataset of polymer VI to date (1166 data points) was established by high-throughput MD. 3) High throughput screening of potential polymers: Through multi-objective constrained screening, we identified 366 potential high VI polymers from only five types of VII. 4) Innovative modeling and analysis: We constructed the first mathematical model for VII viscosity-temperature performance and conducted an unbiased QSPR analysis, revealing new mechanistic insights. These advancements significantly promote efficient and cost-effective material innovation in data-sparse fields, particularly for widely used lubricants.
Results
High-throughput NEMD viscosity calculation
To address technical issues in high-throughput MD computation, Fig. 1b presents a general automated pipeline tailored for data-sparse materials fields, particularly in the lubricants sector. In the high-throughput viscosity calculations for VII, the pipeline automates force field assignment, simulation box construction, relaxation, non-equilibrium molecular dynamics (NEMD) simulations, and data collection by simply inputting the polymer’s degree of polymerization (DP), the monomer’s SMILES, and the sampling number in the chemical space. It also includes automated anomaly detection for relaxation time and velocity distribution. This high-throughput, automated MD computation pipeline significantly enhances data production efficiency.
Building on the high-throughput MD computational pipeline, we used NEMD simulations to construct the first dataset for VII—Viscosity Index Improver Information (VIIInfo). This dataset contains 1166 viscosity data points, which are normally distributed across different temperatures (Fig. S1, indicating no need for data transformation). VIIInfo encompasses polymer monomer molecular structures (180 types), temperatures (313 K and 373 K), and degrees of polymerization (ranging from 20 to 1300), covering common commercial VIIs (PIB, OCP, MSC, HSD, PMA), with molecular structures shown in Fig. S2. As illustrated in Fig. 2a, the 180 polymer monomer structures selected for the VIIInfo dataset are evenly distributed within the chemical space (~1.8 million polymers). This ensures that ML models trained on this dataset will have strong predictive capabilities, enhancing the reliability of subsequent screening and prediction of high viscosity-temperature performance polymer molecular structures. Additionally, compared to the candidate dataset’s chemical space, existing commercial VII molecular structures are fewer and more concentrated.
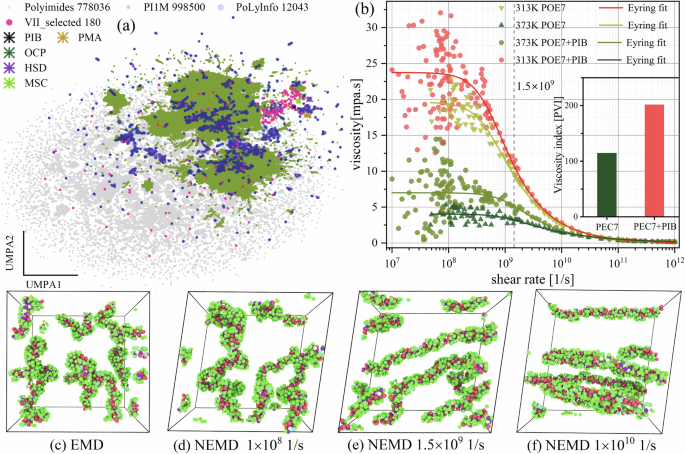
a Visualization of data distribution in 2D space via Uniform Manifold Approximation and Projection (UMAP). For dataset details see Table S1, including PoLyInfo, PI1M, and Polyimides. VIIInfo contains 180 polymer monomers. Morgan fingerprints (radius 3, dimension 1024) were calculated from SMILES and reduced to 2D (UMAP1, UMAP2) using UMAP. b Effect of shear rate on the viscosity of PIB solutions and PEC7 base oil during NEMD, Shear rates ((1.5times {10}^{9}1/s)) for high-throughput computations were indicated by dashed lines. c Equilibrium molecular dynamics (EMD) snapshot of PIB conformation. d–f NEMD snapshots of PIB conformation at different shear rates. PEC7 is rendered transparently in snapshots.
Computational cost is a key limitation in data production and accumulation via high-throughput computation, particularly when constructing viscosity datasets for VII polymers using MD. For example, compared to small molecules like PEC7, the relaxation time required for lubricant systems containing PIB is significantly longer (Fig. S3a)45. This is because the diffusion of long-chain polymers in base oils to reach equilibrium is a slow process (Fig. S3b–e), with relaxation times ranging from 5 ns to 60 ns depending on the DP. Comparing different viscosity calculation methods in MD, NEMD, which introduces external fields such as shear, can quickly converge to a steady state. This method is more efficient and better suited for high-viscosity VII lubricant systems compared to ensemble-averaged equilibrium molecular dynamics (EMD)46 methods like Green-Kubo and the improved transient time correlation function47.
However, in NEMD, while the strong shear field effectively reduces viscosity fluctuations, it also causes the system to enter the nonlinear response region. For example, as shown in Fig. 2b, the PIB solution and PEC7 base oil (Fig. S2) transition from Newtonian fluid (plateau region) to non-Newtonian fluid (viscosity reduction region) as the shear rate increases, following the Eyring model48 (Eq. S6). This shear thinning phenomenon occurs because the increased shear rate causes the polymer chains to align in the shear direction (Fig. 2c–f), reducing intermolecular friction and ultimately decreasing viscosity. In Fig. 2b, NEMD reproduces the effect of PIB on enhancing the proportional viscosity index (PVI) of the base oil. The addition of PIB to the PEC7 base oil effectively slows the rate of viscosity decrease due to the “cage structure” formed by long-chain polymers in the base oil (Fig. S3e), which effectively resists changes in molecular configuration at high shear rates.
However, the signal-to-noise ratio of viscosity decreases as the shear rate decreases, resulting in significant fluctuations in viscosity within the Newtonian fluid region and a marked reduction in the non-Newtonian fluid region (Fig. 2b). This occurs because viscosity in NEMD is determined using the SLLOD equations49, where viscosity (η) is the response of momentum flux (({p}_{i})) to the applied shear rate ((dot{gamma })({rm{eta }}=-{p}_{i}/dot{gamma })). Consequently, when the shear rate is below a critical value, the momentum flux response is weak, making it challenging for NEMD to accurately calculate the Newtonian viscosity of the fluid.
A total of 174 NEMD simulations were performed to examine the effects of shear rate on the radius of gyration, selecting a shear rate of 1.5 × 10⁹ 1/s for high-throughput calculations. This shear rate corresponds to the turning point (see “QSPR mathematical model construction”), where the radius of gyration of the PIB polymer begins to increase rapidly. The reasons for this choice are: 1) For most systems in the dataset (DP is 20–1300), this shear rate closely approximates Newtonian viscosity, despite slight underestimation; 2) The study emphasizes the viscosity index, which measures the relative change in viscosity with temperature, rather than absolute viscosity; 3) At this shear rate, the high signal-to-noise ratio for momentum flux (viscosity) enhances accuracy while reducing computational costs, which is critical for high-throughput calculations.
Sufficient relaxation time is crucial for accurate viscosity calculation, particularly for lubricant systems containing long-chain VII polymers. As shown in Fig. S3a, increasing the amount of VII at a fixed concentration extends the relaxation time required to reach steady-state viscosity, thereby increasing computational cost. This aligns with the Pure Reptation Theory50, where enhanced polymer chain entanglement hinders chain diffusion. In concentrated polymer solutions, when the polymer molecular weight exceeds the entanglement molecular weight, the relationship between viscosity and molecular weight shifts from linear ((eta propto M)) to exponential ((eta propto {M}^{3.5})) due to stronger chain entanglement51. As shown in Fig. S4a–c, the viscosities of three typical VIIs significantly increase with molecular weight, as their DP exceed the entanglement molecular weight at a DP of 200. As the number of polymers (system size) increases, inter-chain entanglement becomes more pronounced, resulting in a slight increase in viscosity for high molecular weight polymer systems. Although adding more VIIs accounts for inter-chain entanglement more comprehensively, even a slight increase significantly raises computational cost (see the discussion in Fig. S4a–c), and statistical descriptions of entanglement effects remain limited.
Therefore, in high-throughput calculations, we adopted the Rouse model52 by setting the number of VIIs in the box to one (excluding inter-chain entanglement). The pros and cons of this approach include: 1) Consistency and fundamental basis: The single-polymer model is consistent with existing theories and experimental data, providing a foundation for complex model studies; 2) Significant reduction in computational cost; 3) Risk of underestimating viscosity: There is a potential for underestimating viscosity in high molecular weight polymer systems, but this can be corrected through experimental relationships (e.g., (eta propto {M}^{3.5}))53. Overall, this choice strikes a reasonable balance between computational cost and simulation accuracy while meeting the primary research objectives.
Additionally, the density and Newtonian viscosity (fitted by the Eyring model) of PEC7 were consistent with experimental values48 (Fig. S5a). Additionally, the comparison with experimental viscosities of different ester-based oils confirms the applicability of NEMD to higher viscosity systems (Fig. S5d). These conclusions demonstrate the accuracy of using NEMD for viscosity calculations in VII systems. As the VII concentration increases, the denser “cage-like” network formed by the polymer chains (Fig. S3e) imposes greater constraints on the base oil, resulting in increased viscosity and viscosity index (Fig. S5b). Based on the actual additive ratios in lubricant formulations (0 wt% to 30 wt%)54, the molar mass ratio of different VII types in the model is set to ~9.6 wt%.
Descriptors filtering and ML model training
The purpose of descriptor selection based on a specific dataset is to find a set of independent variables that maximize the accuracy and generalization capability of ML models. Effective descriptor selection reduces the risk of overfitting and improves the predictive ability of the model19.
As shown in Fig. 3a, the feature engineering process includes descriptor calculation and optimization, utilizing a combination of statistical methods and ML techniques for descriptor selection. The effective descriptors consist of 355 traditional descriptors based on SMILES and 35 MD-inspired descriptors, detailed in Table S2. These descriptors cover polymer topology, elemental composition, charge information, and dynamics in a solvent (ester base oil). Statistical methods were then used to eliminate descriptors with poor correlation to the target property and those with high inter-descriptor correlations. Descriptors with low variance were considered to have minimal influence on the target property (viscosity). Figure 3a shows that statistical methods were used to eliminate variables with low correlation to the target property and those with high inter-correlation. Descriptors with minimal variance were excluded as they have negligible impact. Pearson, Spearman, and Distance correlation coefficients were applied to assess linear and nonlinear relationships, while the Maximal Information Coefficient (MIC) evaluated correlations from an information-theoretic perspective. This screening reduced the number of descriptors from 390 to 42.
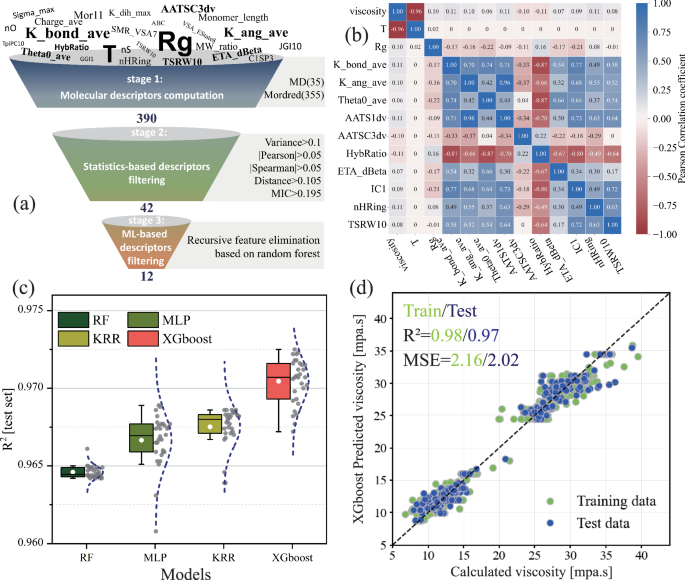
a Process of descriptor down-selection, The thresholds for variance, Pearson, Spearman, Distance correlation coefficients and the maximum information coefficient (MIC) were 0.1, 0.05, 0.05, 0.105, and 0.195, respectively; b Pearson correlation coefficient heatmap matrix between optimized descriptors and target viscosity property; c R2 scores from 30 independent training runs of four different ML algorithms based on optimized descriptors; d Accuracy assessment of the XGBoost model trained on optimized descriptors.
Finally, based on Bayesian hyperparameter optimization, features were selected using Recursive Feature Elimination (RFE) with random forest regression. During model training, tenfold cross-validation was employed, resulting in 12 optimized descriptors (see Table S3 for descriptor names and meanings). As shown in Fig. S5a, when the number of descriptors was 12, the RFE model’s R2 (0.98) and MSE (1.5) stabilized. To verify the accuracy of this process, Principal Component Analysis (PCA) was used to perform dimensionality reduction on the statistically optimized descriptors. When the cumulative variance reached 0.95, the number of principal components was also 12 (Fig. S6b), consistent with the RFE results.
Figure 3b shows the Pearson correlation coefficients between the ML-optimized descriptors and the target property (viscosity). Most descriptors exhibit a positive correlation with each other and with viscosity, though the absolute values of the correlation coefficients are relatively small. The complete heat map of correlation coefficient matrix as functions of the number of descriptors is shown in Fig. S7. The results indicate effective screening of low-correlation descriptors.
Using the ML-selected descriptors, four models (Random Forest (RF), Kernel Ridge Regression (KRR), Multi-Layer Perceptron (MLP), and eXtreme Gradient Boosting (XGBoost)) were independently trained 30 times. The mean and median R2 values on the test set were ranked as XGBoost > KRR > MLP > RF (Fig. 3c). In Fig. S8a–d, the XGBoost model also showed superior performance in terms of MSE and R2 score on the training set. Specifically, the R2 scores for the XGBoost model were 0.98 for the training set and 0.97 for the test set, with MSE values of 2.16 and 2.02, respectively (Fig. 3d). Notably, while the RF model had the worst R2 score and MSE, it exhibited the smallest standard deviation for these performance parameters in repeated training. XGBoost, an ensemble learning algorithm based on gradient-boosted decision trees, optimizes model performance by learning nonlinear relationships and complex interaction patterns in the data. This advantage often results in superior performance. RF constructs multiple decision trees by randomly selecting features and data subsets, which enhances model robustness.
Additionally, after ruling out the risk of overfitting (Fig. S9), we validated the effectiveness of using statistical methods combined with RFE for descriptor selection (i.e., dimensionality reduction) by comparing the performance of four ML models following PCA-based dimensionality reduction (Fig. S6). Given that descriptors have higher interpretability than principal components, all models trained on both sets achieved similarly high R2 scores (R2 > 0.96, Fig. S10a–h). However, the MLP and XGBoost models based on PCA principal components showed a slight reduction in MSE. This indicates that compared to PCA, the statistical method combined with RFE causes minimal information loss, but this loss is acceptable to maintain high interpretability. Compared to similar works on using ML for viscosity prediction (Table S4), the XGBoost model demonstrates a high R² but a larger MSE. This can be attributed to the wide distribution of viscosity data in the VIIInfo dataset, which is caused by significant variations in molecular structure and DP.
Feature Analysis
The Shapley Additive Explanations (SHAP) method, based on game theory, addresses the model “black box” issue by calculating SHAP values to quantify each descriptor’s contribution to the outcome (viscosity). The SHAP value magnitude indicates the significance of each descriptor’s impact. The optimized descriptors obtained from RFE cover aspects such as the topology of polymer molecules, sigma electrons, configurations in solvents, bond strength, and bond angles. Figure 4a shows the feature importance ranking of the optimized descriptors (see Table S3 for descriptor meanings). Among the top eight descriptors with the highest average SHAP values, five are derived from dynamic processes. This suggests that traditional descriptors based solely on SMILES may not fully capture all important features related to the target property, and MD-inspired descriptors provide a valuable supplement. While most descriptors directly related to molecular structure are positively correlated with viscosity, except for T, AATSC3dv, and HybRatio, which are negatively correlated (Fig. S10), Fig. 4a indicates that temperature (descriptor T) has a much greater impact on viscosity than other optimized descriptors. Therefore, the approach of controlling and designing VII polymer molecular structures to significantly improve the viscosity index presents both opportunities and challenges.
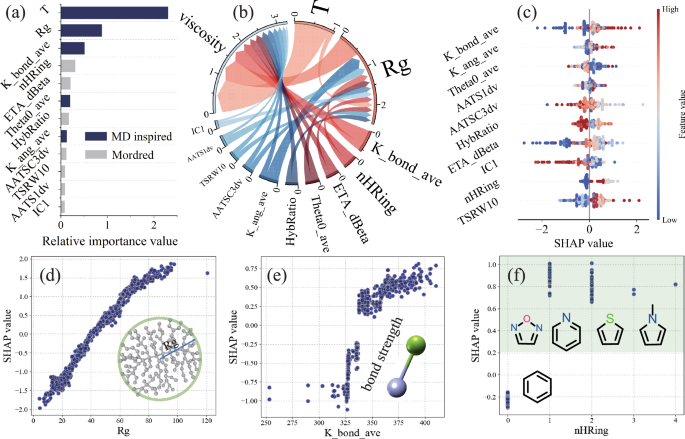
a Ranking of feature importance (mean |SHAP value|) for optimized descriptors; b Chordal graph showing the relationship between optimized descriptors and viscosity (target property), based on a normalized weight matrix; c SHAP beeswarm diagram for optimized descriptors; Influence of (d) ({R}_{g}), e K_bond_ave, and f nHRing value changes on SHAP values. ({R}_{g}) is the radius of gyration, K_bond_ave represents the average bond force constant, and nHRing indicates the number of heterocyclic rings (rings composed of atoms other than C, such as N, O, or S).
Notably, Fig. 4b indicates that the contribution of temperature to viscosity consists of two parts: 1) the increase in momentum with rising temperature, which reduces long-range forces (van der Waals) as atomic distances increase, leading to decreased viscosity; 2) temperature affects the interaction between polymer chains and base oil molecules by altering the radius of gyration (({R}_{g})), thereby influencing viscosity. Between 313 K and 373 K, the former effect is greater than the latter. Within this temperature range, the variation in ({R}_{g}) with temperature is not consistent (both increases and decreases are observed), depending on the type of polymer molecules in the solvent45. Besides T and ({R}_{g}), other descriptors in the optimized set also influence viscosity by affecting ({R}_{g}). This is due to factors such as bond strength (K_bond_ave, HybRatio), bond angles (K_ang_ave, Theta0_ave), valence electrons (ETA_dBeta, AATSC3dv, AATSC1dv), molecular topology (TSRW10, IC1), and elemental composition (nHRing), all of which impact the polymer chain configuration in the synthetic ester base oil. Figure S11 shows a correlation between ({R}_{g}) and other optimized descriptors (excluding T). This is further validated by the minimal impact on model accuracy when ({R}_{g}) descriptors are removed during model training (Fig. S10a–d).
Apart from T and ({R}_{g}), the other optimized descriptors can be quickly obtained using only SMILES, making them crucial parameters for evaluating whether new polymer molecules meet the expected viscosity (viscosity index). Figure 4c presents a beeswarm diagram of the SHAP values for these descriptors (see Fig. S12 for the beeswarm diagram of all optimized descriptors). Except for AATSC3dv and HybRatio, which are negatively correlated with viscosity, all other descriptors are positively correlated. The overall trend shows data points gradually decreasing on both sides of SHAP value 0, with the top-ranked descriptors displaying a wider SHAP value distribution.
Figures 4d-f and S10a-l illustrate the impact of optimized descriptor value changes on viscosity contributions (SHAP values). Interestingly, descriptors that show a positive correlation with viscosity within the 313–373 K temperature range almost always exhibit a “benefit threshold” (plateau region), suggesting that merely adjusting the polymer molecular structure cannot infinitely enhance the viscosity and VI. In Fig. 4d, an increase in the radius of gyration corresponds to a greater contribution to viscosity, but an excessively large radius of gyration diminishes this effect, likely due to shear thinning. The presence of double bonds and conjugated π bonds in polymers enhances the stability of chain configurations, thereby increasing interactions between VII and base oil molecules. Consequently, Fig. 4e shows that an increase in high-bond-strength linkages in polymer molecules benefits viscosity enhancement. Compared to polymer monomers with only benzene rings, the inclusion of heterocycles significantly boosts viscosity contributions; however, the number of heterocycles in monomers has a negligible effect on viscosity (Fig. 4f). The enhanced viscosity is attributed to heterocycles, which stabilize chain structures and increase van der Waals forces between heteroatoms (O, N, S) and the ester groups in ester base oils.
Increasing the proportion of rigid structures within a polymer does not always enhance viscosity. The descriptor HybRatio, which represents the ratio of hybrid orbitals, indicates that an excessively high proportion of rigid structures (corresponding to a high ratio of hybrid orbitals) can reduce viscosity (Fig. S10g). This occurs because a high proportion of rigid structures reduces the coil expansion capability of polymer chains in the base oil. Figure S10e shows a sharp increase in viscosity contribution with the increase of ETA_dBeta values, caused by the rise in sigma bonds, which increases the contribution to the valence electron mobile count55. In Fig. S10f, h, the descriptors K_ang_ave and Theta0_ave indicate that an increase in the rigidity of polymer bond angles can lead to a sudden increase in viscosity. The descriptor TSRW10 represents the number of possible non-repetitive paths that return to the starting atom after passing through ten consecutive atoms. An increase in TSRW10 implies more branching structures within the polymer molecule. As shown in Fig. S10j, SHAP values increase with TSRW10, indicating that an increase in polymer side chains enhances viscosity. These conclusions and mechanistic analyses provide significant guidance for experimental synthesis.
QSPR mathematical model construction
Symbolic regression uncovers relationships among high-dimensional variables through concise and highly interpretable formulas, making it particularly suitable for analyzing small-scale MD datasets with consistent accuracy56. As a type of genetic algorithm, the number of features in SR significantly impacts the efficiency and accuracy of searching the Pareto front during training. Therefore, the feature count was further reduced based on the frequency ranking of different descriptors in the test results.
Using the optimized descriptors, supplemented by expert-selected descriptors (MW_ratio, Monomer_length, Mass_max, DP, see Table S3), we conducted 2000 iterations and statistically analyzed the frequency of descriptors in approximately 4800 formulas. The normalized rankings are shown in Fig. 5a, and the top seven descriptors were used for SR training. As shown in Fig. 5b, the Pareto front was determined using the Latin hypercube sampling approach57, indicating that model error (MSE) is inversely proportional to formula complexity (formula length). The blue shaded area represents formulas that exclude T (temperature), resulting in higher model error, consistent with the conclusion in Fig. 5a that temperature is a significant feature. The formula marked in green on the Pareto front in Fig. 5b has an RMSE of ~1.3 mPa s, a complexity of 14, and an R2 of 0.95 on the test set. The specific expression is as follows:
Here, η represents viscosity, T represents temperature, and ({K}_{b}) and ({A}_{c}) are the descriptors K_bond_ave (average value of bond force constants) and AATSC3dv (averaged Moreau-Broto autocorrelation58 of lag 3 weighted by valence electrons), respectively.
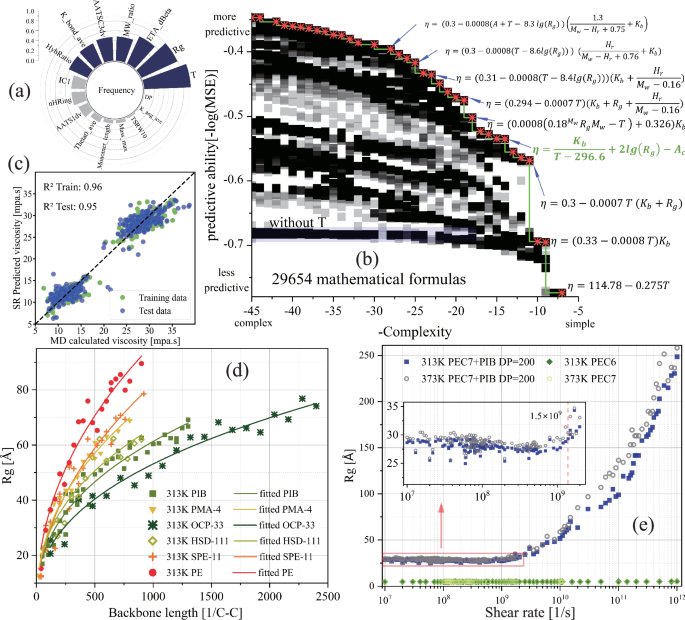
For viscosity as the target property, a frequency of different descriptors appearing in formulas (normalized) at 2000 iterations; b error (MSE) of formulas versus complexity; c comparison between MD-calculated viscosity and SR (Formula 1) predicted viscosity. Symbol-descriptor correspondence: viscosity (η), K_bond_ave (({K}_{b})), AATSC3dv (({A}_{c})), MW_ratio (({M}_{w})), HybRatio (({H}_{r})), see Table S3 for specific meanings. At a concentration of 9.66 wt%, d radius of gyration of VII in PEC7 versus main chain length (main chain length in units of reciprocal C-C bond length); e effect of shear rate on PIB radius of gyration, and shear rate (1.5times {10}^{9}1/s) corresponds to the turning point where the radius of gyration starts to increase rapidly. PIB, PMA, OCP, HSD, PE, and MSC are viscosity index improver polymers, PEC7 is ester base oil, and their structural formulas are shown in Fig. S2.
The radius of gyration (({R}_{g})), as a variable derived from dynamic processes, serves as a crucial bridge in establishing QSPR between viscosity and VII molecular structure (Fig. 4b). Using ({R}_{g}) as the target property, we repeated the descriptor selection and SR model training process similar to that used for viscosity. As shown in Fig. S13b, the frequency of each descriptor selected in the SR model was relatively similar, and the top 8 descriptors were chosen for model training. A formula marked in green in Fig. S13a (with a complexity of 13 and an RMSE of ~10 Å) was selected based on the trade-off between error (MSE) and formula complexity. The R2 on the test set was 0.75 (Fig. S13c). The expression is as follows:
Here, ({A}_{z}) represents the descriptor ATS0Z (Moreau-Broto autocorrelation of lag 0 weighted by atomic number), L denotes the polymer monomer length (Monomer_length), and ({D}_{p}) indicates the degree of polymerization. This equation is applicable within the temperature range of 313 K to 373 K.
Extending the traditional viscosity index to the concept of the viscosity-temperature ratio, a descriptor to measure the change in polymer viscosity with temperature is proposed here:
The above equations establish, for the first time, a comprehensive mathematical model for evaluating the viscosity and viscosity-temperature performance of VII in ester base oils. This model allows for the quick determination of viscosity and VI using only molecular structure. The model balances complexity and accuracy. In fact, by combining the equations on the Pareto front in Fig. 5b and S13a, the model’s complexity and accuracy can be dynamically adjusted, with up to 108 possible formula combinations. The development of this model is analogous to the processes through which Kepler’s third law and Planck’s law were derived via data regression. This model has the potential to be extended to the rapid evaluation of polymer solution viscosity and viscosity-temperature performance.
The QSPR model for VII molecular structure and viscosity (Eqs. 1 and 2) encompasses the polymer molecule’s topology, bond strength, and valence electron information (e.g., electronegativity, polarizability). With a fixed VII concentration (~9.6 wt%) and monomer structure (L, Dp, Az), increasing the DP (or molecular weight) has a diminishing effect on the radius of gyration (Eq. 2). Figure 5d confirms this, showing that as the main chain length increases, the growth of the radius of gyration slows down. This is due to the crossover and confinement of long flexible polymer chains. In Fig. 5d, the rate of slowing (the slope of different curves) reflects the coil expansion capacity, which is related to the corresponding polymer monomer structure, described by the variable ({A}_{z}) in Eq. 2. Polymers containing polar oxygen atoms and long side chains enhance their swelling capacity by increasing interactions with PEC7 (e.g., van der Waals forces).
The effect of temperature on the radius of gyration for different types of polymers is highly complex and solvent-dependent. For example, in mineral-based oil, the radius of gyration of OCP increases with temperature, while PMA shows the opposite trend. It is important to note that temperature is not included as a variable in Eq. 2. This omission is due to the dataset only containing two typical lubricant viscosity evaluation temperatures (313 K and 373 K). Within this range, the impact of temperature on the radius of gyration is negligible compared to other features, and the sparse temperature data cannot capture the complex variations in the radius of gyration for hundreds of polymers. As shown with PIB in Fig. 5e, the radius of gyration significantly increases in the non-Newtonian fluid region with increasing shear rate (critical shear rate ~5 × 10⁸ 1/s), but the effect of temperature (313–373 K) is minimal, with a change of about 2 Å at a shear rate of 1.5 × 10⁹ 1/s. Therefore, the poor R2 of Eq. 2 may be due to the omission of shear rate as a critical feature (Fig. S13c).
When adapting high-performance VII for PEC7 base oil, polymers with strong bonding interactions (({K}_{b})) and valence electron atoms (inversely proportional to ({A}_{c})) are expected to enhance viscosity and viscosity-temperature performance (Eqs. 1 and 3). This enhancement is achieved by increasing chain rigidity and van der Waals forces between the polymer and the ester groups of the base oil, although there may be an upper limit to these gains (Fig. S10c, i). The radius of gyration, a significant feature affecting viscosity (Fig. 4a), has a logarithmic relationship with viscosity in Eq. 1, indicating that an excessively large radius of gyration of VII in the base oil gradually weakens its ability to enhance interactions with PEC7. The VI depends on the sensitivity of interactions between VII and base oil molecules to temperature, which is mainly related to the specific molecular structure (({K}_{b}) in Eq. 3). During the heating process, polymers with rigid main chain structures and strong van der Waals forces with the base oil molecules effectively mitigate the reduction in intermolecular forces caused by increased system kinetic energy, thereby improving the VI. However, this increase in intermolecular forces inevitably leads to intensified thickening (i.e., increased viscosity or thickening efficiency, see “Discovery of high-performance VII”).
Additionally, while increasing the DP at the same concentration generally enhances viscosity, there is a weak correlation between DP and viscosity index within the temperature range of 313 K to 373 K. As shown in Fig. S14, changes in the backbone length of various commercial VII (proportional to DP and molecular weight) have almost no effect on PVI (with a linear fit slope close to zero). The influence of polymerization degree on viscosity is realized by altering the radius of gyration. An increase in the molecular chain length promotes an increase in the polymer’s radius of gyration in the base oil, thus enhancing viscosity. However, since the radius of gyration of various polymers changes very little within the 313 K to 373 K temperature range, it shows a weak correlation with temperature. As a parameter for evaluating viscosity-temperature performance, the VI is weakly correlated with polymerization degree because the radius of gyration is weakly correlated with temperature within this range. Therefore, while increasing the DP (or molecular weight) aids in thickening, it does not improve viscosity-temperature performance. This conclusion is consistent with the experimental findings of Bhattacharya et al.59, who used dynamic light scattering and small-angle neutron scattering under similar conditions. However, compared to the MD data presented here, the experimental data in that study is relatively sparse.
Discovery of high-performance VII
Using four pre-trained ML models (XGBoost, KRR, MLP, RF), we conducted high-throughput virtual screening for high viscosity-temperature performance polymers on the PoLyInfo, PI1M, and Polyimides datasets (~1.8 million polymers). As shown in Fig. 6a, compared to tree-based models (XGBoost, RF) and the kernel ridge regression model (KRR), the multilayer perceptron (MLP) demonstrated better extrapolation capability on the VIIInfo dataset, albeit with a risk of overfitting. In Fig. S10a-d, the MLP model’s R2 was similar to the other models, but its MSE was significantly higher. Similar conclusions were drawn in studies on high thermal conductivity polymers19 and gas separation membranes22. Considering the anti-overfitting capabilities of XGBoost, RF, and KRR, along with the extrapolation capability of MLP, we assigned equal weights (0.25 each) to the viscosity predictions of the four models to obtain a single prediction. This simple ensemble approach improves model reliability60, as validated by the subsequent screening results.
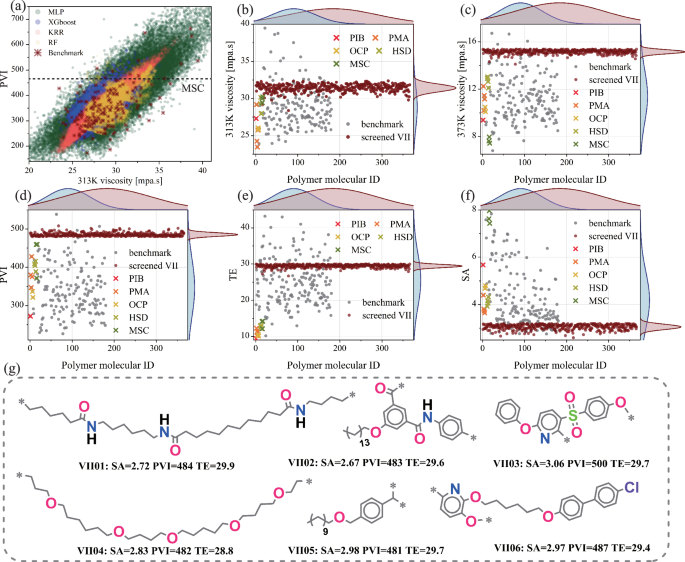
a Comparison of polymer PVI distributions among different ML models (XGBoost, KRR, MLP, RF) using datasets PoLyInfo, PI1M, Polyimides, and the VIIInfo dataset. Screening criteria: synthetic accessibility score (SA) < 3.2, proportional viscosity index (PVI) > 480, and thickening efficiency (TE) < 30. Comparative analysis of selected polymers for b viscosity at 313 K, c viscosity at 373 K, d PVI, e TE, and f SA. g Typical molecular structures of the selected high-performance polymers. PIB, PMA, OCP, HSD, and MSC are viscosity index improver polymers, and their structural formulas are shown in Fig. S2.
Multi-objective optimization is essential for ensuring the efficiency and quality of screening results. For screening high viscosity-temperature performance polymers, we considered three evaluation metrics: proportional viscosity index (PVI), thickening efficiency (TE), and synthetic accessibility score (SA). As an improvement over the VI (see Eqs. S1 and S2), PVI allows for the evaluation of a lubricant’s viscosity-temperature performance using viscosities at just 313 K and 373 K. In designing base oils with the desired viscosity, additives should not significantly alter the viscosity, which can be quantified through TE. Additionally, considering the challenge of synthesizing the candidates identified in virtual screening19, the ease of synthesis should be included in the evaluation. Under the screening criteria of SA < 3.2, PVI > 480, and TE < 30, we identified 366 VII candidate polymer molecules with expected performance (molecular structures shown in Fig. S15).
As shown in Fig. 6d, the normal distribution mean of the PVI for the selected polymer molecules is greater than that of the VIIInfo dataset, and all PVI values exceed those of commercial VII. Compared to VIIInfo, these selected polymers exhibit higher viscosities at both 313 K and 373 K (Fig. 6b, c), with a more pronounced effect at the higher temperature of 373 K. This indicates that while enhancing intermolecular forces to improve viscosity-temperature performance, an inevitable increase in thickening occurs. Although the TE values of the selected polymers are higher than those of commercial VII, they are comparable to the mean values of the VIIInfo dataset (Fig. 6e). Additionally, as shown in Fig. 6f, the selected polymers show lower SA values overall, similar to both commercial VII and the VIIInfo dataset. These findings suggest that the 366 selected polymer molecules possess excellent viscosity-temperature performance while maintaining low thickening efficiency and ease of synthesis.
Based on the 366 selected polymer molecules (Fig. S15), Fig. 6g displays six representative candidate VII molecules along with their corresponding performance parameters (SA, PVI, TE). The selected polymer molecules exhibit the following trends: 1) Compared to commercial VII, the molecular structures contain more electronegative atoms (O, N, S, Cl); 2) Polymers with flexible long side chains tend to have rigid structures (e.g., benzene rings) in the main chain; 3) Linear polymers typically have longer monomer chains and fewer rigid structures. Polar groups or strongly electronegative atoms increase van der Waals forces between VII and base oils, especially synthetic ester base oils with ester groups. Flexible polymer chains exhibit good diffusivity and coil expansion with temperature changes in base oil solvents, while rigid polymer chains provide structural strength to the polymer network (Fig. S3e), enhancing shear resistance. These advantages increase intermolecular friction, compensating for the viscosity drop due to temperature rise.
Finally, NEMD simulations validated the predicted viscosity and performance parameters (PVI, TE) of six polymers. As shown in Fig. S16, the MLP model showed significant deviations from NEMD, likely due to overfitting (highest MSE). In contrast, the XGBoost model’s predictions closely matched the NEMD results, and the average of all four models reduced the error further.
Discussion
In summary, an automated pipeline driven by MD to power ML for materials design has been proposed, with particular applicability to soft condensed matter, which often involves large systems and sparse data. This pipeline integrates data production, feature engineering, QSPR modeling, and virtual screening. The automated process enhances material design efficiency while maintaining interpretability. Using this pipeline, a dataset containing 1166 data points was constructed for only five types VII, identifying 366 potential polymers characterized by high VI, low thickening efficiency, and ease of synthesis. Alongside a mathematical model for rapid assessment of VII viscosity-temperature properties, the QSPR analysis revealed key principles and mechanisms: (1) the impact of increasing the degree of polymerization (or molecular weight) on the VI is negligible; (2) the viscosity index can be regulated by enhancing van der Waals forces and the structural strength of polymer chains, such as incorporating polar groups, rigid backbones, and long flexible side chains; (3) the smaller the variation of intermolecular forces with temperature, the higher the viscosity index.
As the automated materials design pipeline operates, the accumulation of high-quality MD data will enhance the reliability of virtual screening results and improve the accuracy and generalizability of mathematical models. Moreover, by synthesizing and testing screened molecules and feeding the results back into the computations, systematic errors in the MD data can be effectively corrected. In summary, this pipeline offers significant potential for advancing material innovation. The presented case study demonstrates its applicability in establishing theoretical frameworks in fields with initially no available data, highlighting the efficiency of ML in facilitating these processes.
Methods
Lubricant modeling
VII, as a polymer additive in lubricating oils, is typically used in combination with base oils. The polymer monomer to chain and the packing with PEC7 base oil were achieved using an embedded Moltemplate61 Python pipeline. Open Babel62 was used to convert the input polymer monomer SMILES into a coordinate file, and Moltemplate’s force field files were employed to automate the assignment of atom types and charges. The monomers were concatenated at the star-marked positions in the polymer SMILES to achieve the desired DP, with methyl groups as the end caps. All atomic interactions were described using the LOPLS-AA force field63, an optimized version of the OPLS-AA force field for long-chain alkanes, alcohols, and esters, providing accurate descriptions for the high molecular weight polymers and pentaerythritol ester mixtures in this study. Based on the specified polymer additive concentration (9.6 wt%), the number of PEC7 was calculated with one fixed polymer molecule, and a simulation box was generated through molecular packing (Fig. S3f).
NEMD-based viscosity calculation
The molecular dynamics calculations for lubricant viscosity were performed using LAMMPS64, with job batch submission and error management handled through the LAMMPS Python interface. Python was used to linearly fit the velocity distribution results from the LAMMPS NEMD process to determine whether a stable distribution was achieved. By testing the relaxation times required for the systems with the maximum and minimum number of atoms, a simple linear relationship between relaxation time and the number of atoms was established, allowing relaxation times to be specified for all systems based on their atom counts. The simulation box had periodic boundary conditions, and the atomic positions and velocities were iteratively updated using a Nose/Hoover thermostat65 with a timestep of 1 fs. As shown in Fig. S3f, relaxation was performed during the EMD process. First, the system was compressed to 1 atm using the NPT ensemble at the target temperature, followed by relaxation in the NVT ensemble for 5 ns to 60 ns. Maintaining the NVT ensemble, the process then transitioned to NEMD (SLLOD equations49), where a shear rate of (1.5times {10}^{9}) 1/s was applied for 5 ns to achieve a stable velocity distribution. The final 2 ns were averaged to obtain viscosity, radius of gyration, and number density. To manage computational costs, we initially performed five independent calculations for all systems. We then manually reviewed 72 cases with anomalous viscosity values and conducted five additional independent calculations for these cases. The high-throughput computations lasted ~14 months and consumed about 5 million core hours. The hardware used included Supercomputer A: 12 nodes, each with two Intel(R) Xeon(R) Silver 4210R CPUs, and Supercomputer B: 13 nodes, each with two Intel(R) Xeon(R) Silver 4314 CPUs and two NVIDIA GeForce RTX 4090 GPUs.
Descriptors calculation and ML model training
The descriptors include both traditional descriptors and MD-inspired descriptors, obtained using Mordred55 and RadonPy36 tools, respectively. Although Mordred can calculate approximately 1600 descriptors, only 355 effective descriptors were obtained due to the presence of asterisks (polymerization sites) in the polymer SMILES. As shown in Eq. S7, the MD-inspired descriptors are derived from MD force field parameters. The dataset was randomly split into 80% for training and 20% for validation and testing. The following measures were implemented in this study to effectively prevent data leakage and avoid overestimating the model’s performance: 1) All model training used the initially split fixed dataset to ensure the independence of the training and test sets; 2) During K-Fold Cross-Validation, hyperparameter tuning was performed only on the training data from each split and did not involve any test data; 3) There were no duplicate polymer samples in the dataset, and all polymers (solvents) in the binary liquid mixtures model with PEC7 as the solution were significantly different. The calculation of Morgan fingerprints and the training of the four models (XGBoost, KRR, MLP, RF) were performed using Scikit-learn66, with Bayesian global hyperparameter optimization conducted before model training. Symbolic regression model training was carried out using the PySR44 tool, with hyperparameter settings detailed in Table S3.
Responses