New mouse models for exploring renal tumor extension into the inferior vena cava
Introduction
Locally advanced renal tumors with inferior vena cava (IVC) thrombi represent a dilemma regarding clinical treatment in the urological field. Surgical treatment is challenged by high rates of perioperative morbidity and mortality1,2, while the efficacy of systemic treatments involving combined immune checkpoint inhibitors and anti-angiogenic therapy, remains far from satisfactory3. Moreover, the lack of robust in vivo models hampers the elucidation of its pathogenesis, identification of therapeutic targets, and screening for effective drugs, thus preventing successful translational preclinical studies.
Recently, we have endeavored to perform minimally invasive surgery and comprehensive treatment to reduce severe complications and improve cancer-specific survival4,5,6,7,8,9,10. To study the hemodynamic changes and establish a collateral circulation due to IVC tumor thrombus (TT) obstruction, a chronic IVC obstruction model was established11, which was in accordance with clinical observations4,12. However, it failed to demonstrate distal thrombus formation, a common phenomenon in IVCTT obstruction11. Another study constructed a mouse model of complete stasis of IVCTT by ligating the IVC13. However, although these models could simulate the IVC obstruction, they did not incorporate actual tumor factors. To simulate the tumor microenvironment of renal tumors with IVC thrombus (RT-IVCT) formation and progression, patient-derived xenografts and in vitro organoids were considered; however, the former did not form IVC thrombi easily, and the latter lacked vascular structures, both failing to replicate the immune microenvironment14. Therefore, in vivo, models mimicking the tumor microenvironment of RT-IVCT that can help elucidate the development of these thrombi and drug resistance are urgently needed.
In this study, in vivo models with or without an immune system were created, offering valuable tools for replicating the progression of IVCTT and identifying novel therapeutic targets.
Results
The IVCTT model was established in immunocompetent mice
The Renca cell line derived from BALB/c mice is highly malignant, demonstrating strong tumorigenicity in vivo; however, previous efforts to establish an orthotopic renal cell carcinoma (RCC) model using the Renca cell line resulted in pulmonary metastasis without the development of IVCTT15.
To establish an IVCTT model, we orthotopically inoculated the kidneys of BALB/c mice with Renca cells through the renal vein (Fig. 1). Some mice succumbed to emboli induced by the injected cells (Table 1). Three weeks post-inoculation, visible TT was observed expanding into the renal vein and IVC clinically and on ultrasonography (Fig. 2A, B). There was a 65% incidence of TT in BALB/c mice (13/20): 38.5% with renal vein TT (RVTT) and 61.5% with IVCTT (Table 1). No level 4 TT was observed. There was no significant correlation between in situ tumor size and TT level. We examined other organ metastases in a subset of these mice and found lung metastases in some (Table S1, Supplementary Fig. 1), but no distant metastases in other organs.
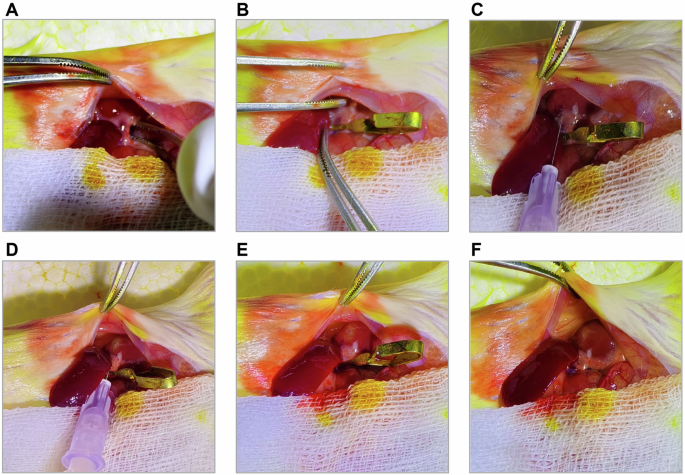
A Expose the left kidney and dissect the renal pedicle to expose the renal vessels. B Clamp the renal vessels using a nontraumatic vascular clamp. C Insert the micro-needle into the renal parenchyma along the renal vein at an angle of approximately 20° relative to the renal blood vessels. D Inject 50 µl of the tumor cell suspension within 3–5 s at a constant speed. E Observe the injection site for about 60 s after completely withdrawing the micro-needle. F. Remove the nontraumatic vascular clamp.

A Representative sonogram of BALB/c mouse. IVC = inferior vena cava; IVCTT = inferior vena cava tumor thrombus. B Representative gross anatomy diagram of BALB/c mouse. VTT = venous tumor thrombus. C Representative hematoxylin and eosin (HE) staining figures (up) and immunohistochemistry (IHC) staining figures of CD31 (bottom) from BALB/c mouse; scale bars, 200 µm. D Representative multiplex immunohistochemistry (mIHC) staining figures of panCK and CD31 from BALB/c mouse; scale bars, 50 µm.
Histological examination revealed that the TT was located within the vascular lumen with a necrotic core. Immunohistochemistry (IHC) for CD31 and multiplex immunohistochemistry (mIHC) for both CD31 and panCK confirmed the localization of the TT (Fig. 2C, D).
TT in immunocompetent mice had pathological features similar to humans
A comprehensive analysis was conducted to ascertain the analogy between TT in immunocompetent mice and humans. Firstly, we performed hematoxylin–eosin (HE) and Masson staining of the TT from mouse and human samples, which revealed distinct cytological atypia in tumor cells compared to adjacent renal tissues. The primary renal tumor and TT from human samples displayed a higher level of tumor cell heterogeneity than in mice, although necrotic regions were observed in both (Fig. 3A). Notably, some TT contained bland thrombus components (TT + BT) (5/13), similar to the composition of certain human thrombi (Fig. 3A). Masson staining indicated a fibrotic component within the human adjacent renal tissue (ART), primary tumor (PT), TT, and TT + BT, in contrast to almost no fibrotic components in mice (Fig. 3B). IHC staining for α-SMA indicated a significant presence of fibroblasts in human ART, PT and TT, compared to limited fibroblasts in mice (Fig. 3C, Supplementary Fig. 2A). Furthermore, Ki67 staining showed that both human and mouse PT and TT contained similar proportions of proliferative cells (Fig. 3D, Supplementary Fig. 2B).

A Representative HE staining figures in human and BALB/c mouse tissue sections. B Representative Masson staining figures in human and Renca BALB/c mouse tissue sections. C Representative IHC staining figures of α-SMA in human and BALB/c mouse tissue sections. D Representative IHC staining figures of Ki67 in human and BALB/c mouse tissue sections. Data are represented as mean ± SD (n = 3, Unpaired t test with Welch’s correction, *p < 0.05, ns = no significance). ART = adjacent renal tissues; PT = primary tumor; TT = tumor thrombus; TT + BT= tumor thrombus with bland thrombus; scale bars, 50 µm.
TT in immunocompetent mice had a similar microenvironment to humans
We conducted IHC analyses to confirm the expression of immune cell markers in the TT. Both mouse and human TT contained macrophages, as indicated by mIHC for CD68 and CD163 in human tissues and immunofluorescence for F4/80 in mouse tissues (Fig. 4A, Supplementary Fig. 3A). Analysis of CD15 in human tissues and Ly6G in mouse tissues revealed a limited presence of neutrophils in the ART and PT, with higher concentrations in the necrotic areas or BT of TT (Fig. 4B, Supplementary Fig. 3B). IHC analysis for CD11c revealed the sporadic presence of dendritic cells (DCs) in both mouse and human PT and TT (Fig. 4C, Supplementary Fig. 3C). These findings suggest a degree of similarity between mice and humans. The biggest difference between the two samples was the presence of lymphocytes. IHC results for CD20 in human tissues or CD19 in mouse tissues, and mIHC for CD4/CD3 and CD8/CD3 revealed sparse B cells and T cells in mouse TT, with minimal presence in the ART and PT. In contrast, human PT and TT cells exhibited a significant influx of T cells and a moderate presence of B cells (Supplementary Fig. 4A, B).

A Representative mIHC staining figures of CD68 and CD163 in human tissue sections and immunofluorescence staining figures of F4/80 in BALB/c mouse tissue sections. B Representative immunohistochemistry staining figures of CD15 in human tissue sections and Ly6G in BALB/c mouse tissue sections. C Representative IHC staining figures of CD11c in human tissue sections and in BALB/c mouse tissue sections. Data are represented as mean ± SD (n = 3, Unpaired t test with Welch’s correction, *p < 0.05, ns = no significance). ART = adjacent renal tissues; PT = primary tumor; TT = tumor thrombus; scale bars, 50 µm.
The immune system demonstrated an inhibitory effect on TT growth
To investigate the role of the immune system in the development of TT, we used Renca cells to construct an animal model of TT in nude mice. The results indicated a 78% (7/9) incidence of TT in nude mice as early as 3 weeks post-inoculation, which was higher than that in BALB/c mice (Table 1). Except for one mouse with RVTT, all mice had IVCTT. The TT had larger diameters, suggesting that the immune system could partially inhibit thrombus progression (Table 1). Additionally, the blood vessel lumen was almost occluded, with significant thinning of the vessel walls (Fig. 5A). HE staining and CD31 IHC confirmed the presence of TT in the blood vessels (Fig. 5B). Furthermore, HE staining revealed necrotic regions within the TT (Fig. 5C). Vascular structures were observed within the TT, indicating angiogenesis. Some TT contained BT components, similar to the composition in immunocompetent mice (Fig. 5C). Masson staining indicated a fibrotic component in the TT and TT + BT groups, with almost no fibrosis in the ART and PT groups (Fig. 5C). IHC staining for α-SMA indicated some fibroblasts in nude mouse PT, TT, and TT + BT, in contrast with limited fibroblasts in immunocompetent mice (Fig. 5C, Supplementary Fig. 5). In a subset of these mice, we observed lung metastases in some cases. The overall pulmonary metastatic burden was comparable to that observed in immunocompetent mice (Table S1, Supplementary Fig. 1). To further analyze the disparities between tumor emboli in nude and immunocompetent mice, we conducted scRNA-seq analysis of the TT. After filtration, 15,408 cells were analyzed (Fig. 6A). We identified and visualized 10 major cell types based on the expression of canonical gene markers: renal tumor cells, monocytes, neutrophils, macrophages, epithelial–mesenchymal transition (EMT) cells, DCs, cycling monocytes and macrophages, fibroblasts, B cells, and T cells (Fig. 6B, C). These findings echo previous reports on human TT, albeit in varying proportions16. Immunocompetent mice exhibited a notable absence of EMT cells and a lower proportion of fibroblasts, neutrophils, and B cells than nude mice (Fig. 6D, E). Conversely, the percentages of monocytes, macrophages, DCs, and T cells in immunocompetent mice surpassed those in nude mice (Fig. 6D, E). We subsequently verified the differences in T cells, B cells, macrophages, DCs, neutrophils, and EMT cells between TT in immunocompetent mice and immunodeficient mice using IHC or mIHC (Supplementary Fig. 6). We performed an exhaustive analysis of the tumor cells, classifying them into four distinct categories. Both single-cell RNA sequencing and mIHC analyses confirmed the exclusive localization of EMT cells within the TT formed in nude mouse models (Fig. 6A, Supplementary Fig. 6A, Supplementary Fig. 7A). Analysis of enriched signaling pathways in tumor cells revealed significant activation of cell adhesion-related pathways in immunodeficient mice (Supplementary Fig. 7B). These pathways play a crucial role in promoting the formation of the extracellular matrix (ECM) network, which further facilitates the growth of TT. Cell communication analysis unveiled an intricate interplay among the diverse cell clusters, highlighting the complex network of interactions within the cellular microenvironment (Supplementary Fig. 7C, D). Pseudo-time and copy number variation analyses indicated that the EMT cells originated from renal tumor cells, suggesting that some fibroblasts may have partially undergone a transformation from tumor cells (Fig. 6F, G; Supplementary Fig. 7E, F).

A Representative gross anatomy diagram from BALB/c mouse (left) and BALB/c-nu/nu mouse (right). B Representative HE staining figures and IHC staining figures of CD31 in BALB/c-nu/nu mouse tissue section. C Representative HE staining figures (top), Masson staining figures (middle) and IHC staining figures of α-SMA (bottom) in and BALB/c-nu/nu mouse tissue sections. ART = adjacent renal tissues; PT = primary tumor; TT = tumor thrombus; scale bars, 50 µm.

A UMAP plot depicting the distribution of cells for Renca BALB/c and Renca BALB/c-nu/nu mice. B UMAP showing different cell subsets for Renca BALB/c and Renca BALB/c-nu/nu mice. C Expression of marker genes in different cell subsets. D Pie charts indicating the cell composition for Renca BALB/c mice (left) and Renca BALB/c-nu/nu mice (right). E Bar charts representing the proportion difference of different cell types between Renca BALB/c mice and Renca BALB/c-nu/nu mice. F Monocle pseudotime trajectory showing the progression of renal cells, epithelial–mesenchymal transition (EMT) cells, and fibroblasts. G Using monocytes and macrophages as reference, inferCNV was used to analyze the copy number variation in renal cells, EMT cells, and fibroblasts. In the figure, the horizontal axis is the mean of the meanSquare of each cluster, and the vertical axis is the correlation coefficient.
A TT model of human RCC in mice
Next, we assessed the feasibility of using a human RCC cell line to establish a TT model in BALB/c-nu/nu (SN12-BALB/c-nu/nu) mice. Three weeks later, TT was harvested. The results demonstrated a 100% incidence of TT (9/9), 22.2% (2/9) with RVTT and 77.8% (7/9) with IVCTT (Table 1), characterized by a substantial size and severe obstruction of the IVC (Fig. 7A).

A Representative gross anatomy diagram (left), HE staining figures (middle), and IHC staining figures of CD31 and α-SMA (right) from SN12-BALB/c-nu/nu mouse. B Representative HE staining figures (top), Masson staining figures (middle), and IHC staining figures of α-SMA (bottom) in SN12-BALB/c-nu/nu mouse tissue sections. ART = adjacent renal tissues; PT = primary tumor; TT = tumor thrombus; TT + BT= tumor thrombus with bland thrombus; scale bars, 50 µm.
HE staining revealed necrotic regions within the TT (Fig. 7A). Additionally, a tumor embolus structure accompanied by a BT was observed, mirroring the findings of the Renca TT (Fig. 7B). Masson staining indicated a fibrotic component within the PT, TT, and TT + BT groups, with no fibrotic component in the ART group (Fig. 7B). IHC staining for α-SMA indicated some fibroblasts in the PT, TT, and TT + BT groups, in contrast to the limited number of fibroblasts in immunocompetent mice (Fig. 7B, Supplementary Fig. 8). In a subset of these mice, no metastases were found in any organs, including the lungs (Table S1, Supplementary Fig. 1).
Discussion
Renal tumors in situ can breach the renal vein and proliferate along it, extending into the IVC and potentially reaching the right atrium. Pathological examination has revealed continuity between the metastatic and primary tumor sites, with the mutational profile of the TT closely resembling that of the original tumor17. Extensive research has substantiated a strong correlation between the presence of TT and unfavorable prognosis outcomes. Specifically, individuals diagnosed with TT demonstrate a notably poorer prognosis in comparison to those without such conditions18,19,20. Furthermore, the prognostic outlook for patients presenting with IVCTT is significantly more adverse than for those with renal vein involvement18. Due to the lack of in vivo models replicating RT-IVCT development, translational studies have not been reported. Multi-omics studies, including scRNA-seq and spatial transcriptomics, and molecular mechanism studies, have attempted to reveal the mechanism of TT16,17,21,22,23,24,25,26; however, the lack of animal models has prevented the clinical translation of these findings. A previously reported model using VX2 tumor tissue implanted into the IVC aimed to evaluate the therapeutic effects of iodine-125 seeds27. Since TTs are not independently suspended in blood vessels but require an ECM network embedded with immune and stromal cells to promote their growth16, this model did not accurately simulate the natural development of TTs. Here, we generated three in vivo models of RT-IVCT, which have not been available to date, to determine its pathogenesis, identify therapeutic targets, and screen for effective drugs, thereby promoting translational studies in this field.
In the immunocompetent models, the pathological features and microenvironments closely resembled those observed in humans, although some of the cell clusters did differ from the human context in some respects. Therefore, this model is suitable for studying the immune mechanism involved in TT progression and for evaluating the effect of immunotherapy on TT treatment. RCC shows a favorable response to immune checkpoint inhibitors, despite having a moderate tumor mutational burden21. The immune microenvironment of RT-IVCT has been explored in a few studies, which revealed significant infiltration of CD8+ T cells, regulatory T cells, DCs, and programmed death-ligand 1 expressing cells in the TT as compared to the primary tumor16,21,25. In addition, several studies have confirmed that immune infiltration and inflammation were associated with a poor prognosis in patients with IVCTT28,29,30. It was reported that the formation of neutrophil extracellular traps (NETosis) and systemic lymphocyte perturbations were markers of tumor progression in patients with TT28. Therefore, the immune system likely plays a significant role in the progression of TT. In previous orthotopic and spontaneous tumorigenesis models, it was difficult to reproduce the tumor entering the blood vessel to form a TT and to simulate the blood environment surrounding a TT31,32. Three-dimensional organoids are less mature than actual tissues and lack the immune systems observed in animals or humans33,34. Therefore, these models cannot be used to evaluate the inhibitory effect of immunotherapy on a TT. Validation of immunocyte function and the underlying mechanisms in our immunocompetent TT model could provide new ideas for the immunotherapeutic treatment of RT-IVCT.
In our study, compared with the immunocompetent models, immunodeficient mice exhibited a significant increase in EMT cells derived from tumor cells and fibroblasts, suggesting that the immune system inhibits the invasive phenotype of tumor cells. Therefore, the immunodeficient model is appropriate for investigating the mechanisms underlying the transformation of tumor cells into cells with an aggressive phenotype, as well as for the development of potential therapeutic agents. Furthermore, we found that the blood vessel lumen was almost occluded in the immunodeficient model. Previously, we established a canine IVC obstruction model using an ameroid constrictor to block the IVC. This model was informative for the protection of the critical collateral circulation and non-tumor renal function11. However, mechanical obstruction did not simultaneously account for the effect of tumor progression. Therefore, our immunodeficient model is more suitable for evaluating the hemodynamic changes caused by renal TT obstruction. In addition, we observed neovascularization in the TT of the immunodeficient model, suggesting that the immune system may also suppress TT progression by inhibiting angiogenesis35,36,37. As a result, the nude TT model is potentially applicable for investigating angiogenesis in TT and the role of tyrosine kinase inhibitors in its treatment. Notably, vascular endothelial cells were not detected by scRNA-seq, possibly because of the low proportion of endothelial cells.
More importantly, we successfully created a TT model using a human tumor cell line in BALB/c nu/nu mice. The successful establishment of this model indicates that human-derived renal tumor cells can form TT in mice, laying the foundation for constructing of a patient-derived TT xenograft model for further drug screening. In basic research, this model can be used to reveal the influence of critical genes and signaling pathways on the TT for personalized precision treatment. It can also be used to study the role of stromal components associated with human tumor cells in the tumor microenvironment, which promote the generation, progression, metastasis, and development of drug resistance in solid tumors38,39. Previous studies have demonstrated that myofibroblasts in TTs exhibit heightened signatures of angiogenesis, ECM remodeling, and EMT pathways16. In our study, immunodeficient models exhibited a higher proportion of fibroblasts, likely due to the larger size and earlier necrosis of TTs, which may activate fibrosis-related processes. This underscores a potential immune-mediated regulatory role in fibrosis and angiogenesis, warranting further validation.
The current animal models have some limitations. Firstly, the immune systems of humans and mice differ; therefore, the RT-IVCT model of mouse-derived cells may not accurately represent the situation in humans. Secondly, in the RT-IVCT model of nude mice injected with human renal tumor cells, the full immune system required to represent a real-life scenario is lacking. Finally, our models can be used to study the mechanism of TT progression, but not the formation of TT, because the artificially generated needle tracts compromise the intrarenal vascular barrier.
To conclude, our newly established in vivo models mimic the tumor microenvironment and the process of renal tumors extending into the IVC. Using these models, we can potentially uncover the pathogenesis of this process and discover potential targets for inhibiting TT progression.
Methods
Ethical approval for human and animal subjects
Human kidney tumors and IVCTTs were collected at the Department of Urology of Chinese PLA General Hospital (Beijing, China) in accordance with the protocol approved by the Ethics Committee of Chinese PLA General Hospital (S2019-349-01). Written informed consent was obtained from all participants before sample collection. All ethical regulations relevant to human research participants were followed. Renca cells (CRL-2947) and SN12-PM6 cells (HTX2820) were purchased from the American Type Tissue Culture Collection (ATCC). All Renal cancer cell lines were confirmed within 6 months before use by using a short tandem repeat profiling and were confirmed negative for Mycoplasma contamination. Wild-type male BALB/c and BALB/c nu/nu mice (6 – 8 weeks), purchased from the Animal Center of the Chinese PLA General Hospital, were housed in a specific pathogen-free facility under a 12 h light/dark cycle with free access to food and water for 1–2 weeks. The animal research protocol was approved by the Institutional Animal Care and Use Committee (IACUC) of the Chinese People’s Liberation Army (PLA) General Hospital, adhering strictly to all pertinent ethical guidelines for animal research.
Preparation of tumor cells for injection
The tumor cells underwent at least three passages to amplify their population. Subsequently, they were diluted to a concentration of 5 × 10^5 cells per 25 µL and mixed with an equivalent volume of high-concentration Matrigel (Lablead, MG6248). The resultant tumor cell suspension was then chilled on ice prior to injection.
Establishment of IVCTT animal models
Mice were anesthetized via intraperitoneal injection of tribromoethanol (Sigma, T48402) (prepared as a 1.25% w/v solution in sterile saline, 20 μl/g body weight), with the solution freshly prepared before each use to ensure stability and effectiveness. Depth of anesthesia was confirmed by the absence of a pedal withdrawal reflex. A midline abdominal incision ( ~ 3 cm) was made under sterile conditions, and the left kidney and renal vessels were fully exposed. A microvascular clip was applied proximally to the heart to temporarily occlude the left renal vessels. Using a sterile syringe with a 30 G needle, 50 μL of tumor cell suspension was injected into the renal vein at a 10–20° angle under direct visualization. The injection was performed over 3–5 s, followed by a 30 s pause to allow the Matrigel to solidify. The needle was slowly withdrawn, and the injection site was monitored for 60 s to check for bleeding or leakage. The microvascular clip was then removed to restore blood flow, and the abdominal incision was sutured in two layers using 5-0 absorbable sutures. Mice were placed on a 37 °C warming plate to facilitate recovery from anesthesia and subsequently returned to their cages for further observation. Post-operative monitoring was conducted daily to assess general health, activity, and incision healing. Humane endpoints were defined as follows: (1) signs of distress, such as lethargy, rapid weight loss exceeding 15%, or inability to access food or water, (2) tumor size exceeding 2 cm in maximal diameter, or (3) significant abdominal swelling or signs of systemic illness. For the IVCTT, the upper size limit was defined as the inferior vena cava tumor thrombus not exceeding the diaphragm. Tumor growth was monitored every three days using ultrasound imaging during the modeling process and by caliper measurement after euthanasia. Tumor volume was calculated, and all tumors were confirmed to remain within the ethical limits. Four weeks after implantation, the mice were sacrificed by cervical dislocation under deep anesthesia induced by isoflurane inhalation, and kidney tumors as well as intravascular tumor thrombus (IVCTT) samples were harvested for further analysis. We have complied with all relevant ethical regulations for animal use.
Ultrasonic examination
The growth of tumor thrombus was detected using a portable mini ultrasonic probe (Zhiying, PA10U) after injecting tumor cells into the renal parenchyma for 3 weeks.
Morphological evaluation
Tumor kidneys and tumor thrombus tissues were paraffin-embedded, sectioned, and stained using Masson’s trichrome (Solarbio, G1340) and hematoxylin-eosin (HE) (Solarbio, G1120). The slides were scanned with the TissueFAXS PLUS system (TissueGnostics, Vienna, Austria). Histopathological evaluations were conducted by two independent renal pathologists blinded to the experimental conditions.
Immunohistochemical and multiplex Immunohistochemistry
Formalin-fixed, paraffin-embedded (FFPE) tissues were sectioned into 5 μm slides. Slides were deparaffinized in xylene for 30 min and sequentially rehydrated in absolute ethanol (5 min, twice), 95% ethanol (5 min), and 75% ethanol (2 min), followed by three washes in distilled water. Heat-induced epitope retrieval was performed by immersing slides in boiling EDTA buffer (ZLI-9079, Zsbio, Beijing, China) for 15 min using a microwave oven. Blocking was performed with Antibody Diluent/Block (Alpha X Bio).The IHC experiments were performed to evaluate CD19- (Servicebio, GB11061-1-50, 1:500), CD20- (Servicebio, GB115721-50, 1:500), CD31- (abcam, ab28364, 1:500), α-SMA- (abcam, ab7817, 1:750), Ki67- (Proteintech, 27309-1-AP, 1:750), CD15- (abcam, ab135377, 1:500), Ly6G- (abcam, ab238132, 1:2000), CD11c- (CST, 97585,1:300), and F4/80- (Proteintech, 28463-1-AP, 1:1000) positive cells. The mIHC experiments were performed by AlphaXPainter X30 (Alpha X Bio, Beijing, China) and analyzed according to three panels, in which primary antibodies were used as listed in below: CD3-(Selleck, F2049, 1:500), CD4- (Proteintech, 67786-1lg, 1:500), CD8- (CST, 98941 T, 1:500), CD68- (ZSGB-BIO, ZM-0060), CD163- (ZSGB-BIO, ZM-0428), F4/80- (Proteintech, 28463-1-AP, 1:1000), panCK- (Alpha X Bio, AXB3012-12), vimentin- (Proteintech, 10366-1-AP, 1:200). Primary antibodies were incubated on slides for 1 h at 37 °C, followed by a 10 min incubation with Alpha X Polymer HRP Ms+Rb (Alpha X Bio, Beijing, China) at 37 °C. Visualization was performed using the Alpha X 7-Color IHC Kit (AXT37100031, Alpha X Bio, Beijing, China). After each staining cycle, heat-induced epitope retrieval was used to remove all antibodies, including primary and secondary. Slides were counterstained with DAPI for 5 min and mounted with Antifade Mounting Medium (I0052, NobleRyder, Beijing, China). Images were scanned using the ZEISS AXIOSCAN 7 (ZEISS, Oberkochen, Germany) and analyzed with HALO software (v3.6; Indica Labs, USA).
Single-cell dissociation
Single-cell RNA-seq was conducted at the laboratory of NovelBio Bio-Pharm Technology Co., Ltd. Surgically excised tissues were stored in MACS Tissue Storage Solution (Miltenyi Biotec) until processing. Samples were washed with PBS, minced into ~1 mm³ pieces on ice, and digested enzymatically with 200 µL Enzyme H, 100 µL Enzyme R, and 25 µL Enzyme A at 37 °C for 30 min with agitation. Digested tissues were passed through a 70 µm cell strainer and centrifuged at 300 × g for 5 min. Pelleted cells were resuspended in red blood cell lysis buffer (Miltenyi Biotec) to remove erythrocytes, then washed and resuspended in PBS with 0.04% BSA. Cells were re-filtered through a 35 µm strainer and stained with AO/PI for viability assessment using the Countstar Fluorescence Cell Analyzer.
Single-cell RNA sequencing
scRNA-Seq libraries were prepared using the 10X Genomics Chromium Controller and Chromium Single Cell 3’ V3.1 Reagent Kits (10X Genomics, Pleasanton, CA). Cells were concentrated to ~1000 cells/μL and loaded into each channel to generate single-cell gel bead-in-emulsions (GEMs). After reverse transcription, GEMs were broken, and barcoded cDNA was purified, amplified, fragmented, A-tailed, adaptor-ligated, and PCR-indexed. Libraries were quantified using the Qubit High Sensitivity DNA assay (Thermo Fisher Scientific), and size distribution was assessed with a High Sensitivity DNA chip on a Bioanalyzer 2200 (Agilent). Sequencing was performed on an Illumina platform (Illumina, San Diego, CA) using a 150 bp paired-end run.
Single-cell RNA sequencing (scRNA-seq) analysis
scRNA-Seq data analysis was conducted by NovelBio Co. Ltd. using the NovelBrain Cloud Analysis Platform (www.novelbrain.com). Raw reads were filtered with fastp (default parameters) to remove adaptor sequences and low-quality reads, generating clean data. Feature-barcode matrices were obtained by aligning reads to the mouse genome (mm10, Ensembl version 100) using CellRanger v6.1.1. Barcoded reads per cell were down-sampled, and an aggregated matrix was generated. Cells with >200 expressed genes and mitochondrial unique molecular identifier (UMI) rates <20% passed quality filtering, and mitochondrial genes were removed from the expression table.
The Seurat package (v4.1.1, https://satijalab.org/seurat/) was used for normalization and regression based on UMI counts and mitochondrial percentage, producing scaled data. Principal component analysis (PCA) was performed on the top 2000 highly variable genes, with the top 10 principal components used for t-distributed Stochastic Neighbor Embedding (tSNE) and Uniform Manifold Approximation and Projection (UMAP). Unsupervised cell clusters were identified using a graph-based clustering method on the top 10 principal components. Marker genes were determined with the FindAllMarkers function using the Wilcoxon rank-sum test under the following criteria: 1) lnFC >0.25; 2) p-value < 0.05; 3) min.pct >0.1. Cell types were identified through re-tSNE, graph-based clustering, and marker analysis for specific clusters.
Pseudo-time analysis
Single-cell trajectory analysis was performed using Monocle2 (http://cole-trapnell-lab.github.io/monocle-release) with the DDR-Tree algorithm and default parameters. Marker genes from Seurat clustering results and raw expression counts of filtered cells were used as input. Pseudo-time analysis was conducted, followed by branch expression analysis modeling (BEAM) to identify branch fate-determining genes.
Cell communication analysis
Cell-cell communication analysis was conducted using CellPhoneDB, a public repository of ligands, receptors, and their interactions. Membrane, secreted, and peripheral proteins from clusters at different time points were annotated. Interaction significance and mean expression values were calculated using the normalized cell matrix from Seurat, with significant interactions identified at p-value < 0.05.
Copy number variation estimation
Endothelial cells were used as a reference to identify somatic copy number variations (CNVs) using the R package inferCNV (v0.8.2). The CNV signal for each cell was quantified as the mean of squares of CNV values across the genome.
Statistics and Reproducibility
All statistical analyses were performed using GraphPad Prism 9 (version 9.3.0). Results are expressed as mean ± standard deviation. The sample sizes (n = 3, where each sample represents one mouse, with five microscopic fields photographed and averaged per sample) are specified in the respective figure legends. The experiments were carried out once. Comparisons between two groups were conducted using the unpaired two-sided t-test with Welch’s correction. Statistical significance was defined as p ≤ 0.05 *, p ≤ 0.01 **, p ≤ 0.001 ***.
Responses