Synthesis and characterization of soquelitinib a selective ITK inhibitor that modulates tumor immunity
Introduction
ITK is a member of TEC family of kinases that is expressed in T, NK and mast cells1. ITK plays an important role in T cell receptor (TCR) signaling as well in the differentiation of thymocytes into mature T cells1. Following TCR stimulation, ITK is recruited to the membrane associated SLP 76/LAT adapter complex, where it is phosphorylated and activated by the src family kinase LCK2. Activated ITK then phosphorylates phospholipase C (PLC)γ1, leading to the mobilization of Ca2+ and to the activation of growth, survival, and differentiation pathways regulated by mitogen activated protein kinase (MAPK), nuclear factor kappa B (NFκB), SH2 containing protein tyrosine phosphatase-2 (SHP2)3, interferon regulatory factor (IRF4)4, and GATA-3 binding protein (GATA-3)5. Together, these pathways indicate that ITK plays important roles in TCR signaling, T cell proliferation, and differentiation of naïve CD4+ T cells.
ITK−/− knockout mice exhibit defects in T helper 2 (Th2) differentiation, while retaining the ability to differentiate into Th1 cells that secrete interferon gamma (IFNγ)6, a phenomenon known as Th1 skewing. Another TEC-family kinase, resting lymphocyte kinase (RLK/TXK), is also expressed in T cells and is similarly activated by TCR-driven phosphorylation by src-family kinases2. RLK interacts with many of the same signaling components as ITK7,8. Whereas ITK−/− CD4 + T cells in mice have impaired T cell activation and differentiation, ITK−/− RLK−/− double knockout T cells have a more substantial signaling defect, resulting in a profound loss of normal T cell function9. Thus, selective inhibition of ITK while sparing RLK should result in modulation of T cell responses without a marked effect on overall T-dependent immunity.
We hypothesized that selective pharmacologic inhibition of ITK with sparing of RLK would affect T cell differentiation leading to Th1 skewing, which could enhance anti-tumor immunity. Therefore, we have synthesized a novel, ITK selective, orally bioavailable ITK inhibitor, soquelitinib (SQL, known previously as CPI-818), that binds covalently to cysteine 442 of ITK and blocks its function.
Here we characterize the specificity of soquelitinib and report on the biologic effects of selective pharmacologic blockade of ITK. Our findings demonstrate effects on T cell differentiation including Th1 skewing, blockade of Th2 function and reduction of T cell exhaustion. In vivo studies in syngeneic tumor models reveal inhibition of tumor growth that is attributable to soquelitinib-mediated immune modulatory effects. These findings indicate that ITK is a potential novel target to enhance the immunotherapy of cancer.
Results
Chemical design and synthesis
Analysis of ligand bound ITK crystal structures in the Protein Data Bank (PDB) suggested the aminothiazole-based molecular scaffold (PDB entry 3MJ2) as a suitable starting point for structure-based drug design of ITK-selective covalent inhibitors. This ligand forms two hydrogen bonds with the Met-438 residue in the hinge region and a hydrophobic interaction with the gatekeeper residue Phe-435. A piperazine-acetamide fragment projects toward Cys-442, providing a useful vector for ligand modification with electrophilic substituents to engage Cys-442 in covalent bond formation. The benzylamine moiety was replaced with the less bulky and less polar cyclopropyl-substituent. Further optimization of ITK selectivity and potency was achieved with the introduction of the 7-membered 1,4-diazepane ring with the R-methyl group. Presumably, the chiral methyl acts as an anchor to stabilize one of the conformations of the 7-membered ring that directs the acrylamide fragment towards Cys-442 facilitating irreversible covalent bond formation between soquelitinib and ITK via a Michael addition reaction. The chemical structure of soquelitinib (M.W. = 514.66) and selective binding are shown in Fig. 1, Panels a and c.
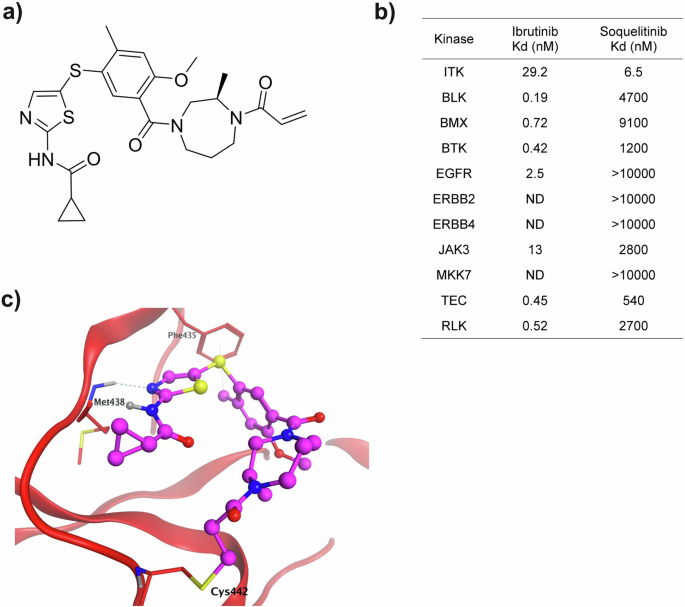
a Chemical structure of soquelitinib. b Eleven kinases with a cysteine located comparably to the cysteine at amino acid 442 of ITK were studied. The specificity of soquelitinib binding is compared to the specificity of ibrutinib binding. c Model (Molecular operating environment software platform, Chemical Computing Group, Montreal, Canada) (MOE) of Soquelitinib covalently bound to ITK. Molecular modeling predicts that the aminothiazole scaffold makes two hydrogen bonds to Met438 of the hinge residues of the ATP binding pocket. The 2-methyl makes a hydrophobic interaction with Phe435 and the methyldiazepane linker presents the acrylamide in a position accessible for covalent bond formation with Cys442.
Covalent irreversible inhibition of ITK by soquelitinib
A chymotryptic digest of soquelitinib -inhibited ITK was analyzed by liquid chromatography with tandem mass spectroscopy (LC MS/MS) to detect the presence of the covalently linked inhibitor to the enzyme. The digest generated 247 peptide fragments and their sequences were identified through deconvolution of the mass spectra. A set of three nested peptides were detected in the sample treated with soquelitinib that were absent from the untreated control sample (Supplementary Table 1). Each of the three peptides contained Cys-442 and their masses were shifted by the mass of soquelitinib when compared to the corresponding unmodified peptide sequence. The presence of the three unique peptide fragments generated by soquelitinib treatment is consistent with the inhibitor covalently labeling Cys-442. There were no other peptide fragments detected that were modified by soquelitinib. Collectively these data demonstrate that soquelitinib is a selective, irreversible, and covalent inhibitor of ITK.
Kinase selectivity of soquelitinib
The five members of the TEC kinase family and six other enzymes of the human kinome contain a cysteine in a position homologous to Cys-442 in ITK and could potentially be irreversibly inhibited by soquelitinib10. To investigate the selectivity against the 11 cysteine-containing kinases, Kd values for soquelitinib for each enzyme were obtained. Soquelitinib displayed a Kd = 6.5 nM for ITK and was at least 80-fold selective over the remaining cysteine-containing kinases (Fig. 1b). Profiling data for ibrutinib, a covalent BTK inhibitor, approved for treatment of B cell lymphomas also is shown for comparison. Soquelitinib was then profiled against the human kinome at the single concentration of 1.0 µM. Soquelitinib displayed a high degree of selectivity such that only eight kinases were inhibited ≥65% and only the targeted kinase, ITK, was inhibited by >95%. We evaluated the kinetics of covalent bond formation by measuring the kinact/Ki values for the two kinases, ITK and RLK, and found soquelitinib is 115-fold selective toward ITK over RLK (kinact/Ki = 1.71 µM−1s−1 for soquelitinib inactivation of ITK). Moreover, other kinases in the T cell receptor pathway were not inhibited by soquelitinib (kinase activity, percent control: Lck, 89; Fyn, 99; ZAP-70, 59; RLK, 70). Figure 1c illustrates how the structure of soquelitinib docks with the structure of ITK.
Soquelitinib inhibits TCR signaling downstream of ITK and blocks IL-2 production
Figure 2a summarizes the proposed signaling pathways of ITK. To investigate whether inhibition of ITK activity by soquelitinib modulates TCR signaling during activation, we measured phosphorylation of several proteins downstream of TCR signaling such as ZAP70, PLCγ1 in human H9 cells, and ERK and ribosomal protein S6 in human CD4+ T cells, respectively. As shown in Figs. 2b, c and Supplemental Fig. 3, soquelitinib inhibited the phosphorylation of PLCγ1, ERK and S6 protein and had a minimal impact on phosphorylation of a proximal kinase, ZAP70. Previous study from Wilcox’s group11 has shown that TCR-mediated activation of NF-κB and GATA-3 is ITK dependent. An ITK degrader similarly reduces the expression of NFkB and GATA-312. The Wilcox laboratory has also reported that CPI-818 (the previous designation for soquelitinib) reduces NFkB and GATA-3 expression in a T cell lymphoma cell line following TCR stimulation5. These results indicate that inhibition of ITK kinase activity by soquelitinib leads to inhibition of downstream TCR signaling events and GATA-3 expression. We next investigated the effect on IL-2 secretion, an early event in T cell activation. Soquelitinib suppressed IL-2 secretion in Jurkat cells in response to TCR stimulation with a mean IC50 of 136 nM (Fig. 2d). Given that IL-2 plays an essential role in T cell proliferation and survival, we evaluated the viability and proliferation of human T cells treated with a range of soquelitinib doses. As shown in Fig. 2e, our results revealed that at 10 μM concentrations of soquelitinib, cell viability was unaffected but total cell number was reduced, findings consistent with an antiproliferative effect seen only at the highest concentration. Viability and proliferation were not affected at lower concentrations of drug.
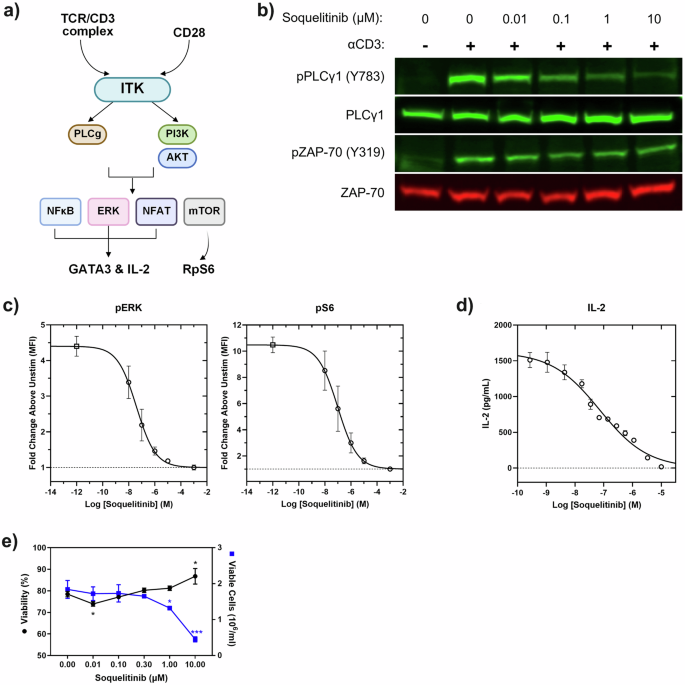
a Diagram illustrates pathways that activate ITK and the downstream effects of that activation. Drawing created using BioRender. b Western blot analysis of whole-cell lysates from H9 cells stimulated with anti-CD3 for 30 s in the presence of increasing concentration of soquelitinib. Blots were probed with specific antibodies to total and phosphorylated PLCγ1 and ZAP-70. c Soquelitinib inhibits ERK and S6 phosphorylation. ERK and S6 phosphorylation was measured by flow cytometry following anti-CD3/28-crosslinking in human T cells. Each data point displays mean of fold change from three donors. Error bars represent SEM. d Soquelitinib suppresses IL-2 secretion in Jurkat cells in response to TCR stimulation. A representative curve is shown from one experiment with the mean of technical duplicates plotted. e Soquelitinib (≥1 μM) reduced the total number of cells while maintaining cell viability after six days in culture. Cell viability and cell expansion rate of human primary T cells measured by the Vi-Cell XL Cell Viability Analyzer (Beckman Coulter) after TCR stimulation. Data are means ± SEM of technical triplicates within an experiment and are representative of 15 human donors. Fig. 2c, d, e were created using Graphpad Prism. PI3K phosphatidyl inositol-3 kinase, AKT protein kinase B, NFkB nuclear factor kappa B, NFAT nuclear factor of activated T cells, ERK extracellular signal regulated kinase, mTOR molecular target of rapamycin, GATA3 GATA binding protein 3, IL interleukin, RpS6 ribosomal protein 6. *p < 0.05, ***p < 0.001.
Soquelitinib suppresses Th2 associated cytokines and induces Th1 skewing in CD4 T cells
We evaluated the effect of soquelitinib on T effector cytokines following 3 days of TCR stimulation in purified CD4 T cells from either healthy donors (Fig. 3a) or Sezary cells from patients with cutaneous T cell lymphomas (CTCL), which express GATA-3 and have a Th2 phenotype5,11. When normal human T cells are incubated with increasing concentrations of soquelitinib, Th2 cytokine production (IL-4, IL-5 and IL-13) is reduced. The prototypical Th1 cytokine, IFNγ, is affected but only at the highest concentrations of soquelitinib which were tested. Interestingly, Sezary cells exhibited greater sensitivity to soquelitinib as soquelitinib inhibited production of Th2 associated cytokines to a greater extent in Sezary cells than in normal CD4 T cells. Again, their production of IFNγ can also be reduced, but only at the highest concentration of soquelitinib.
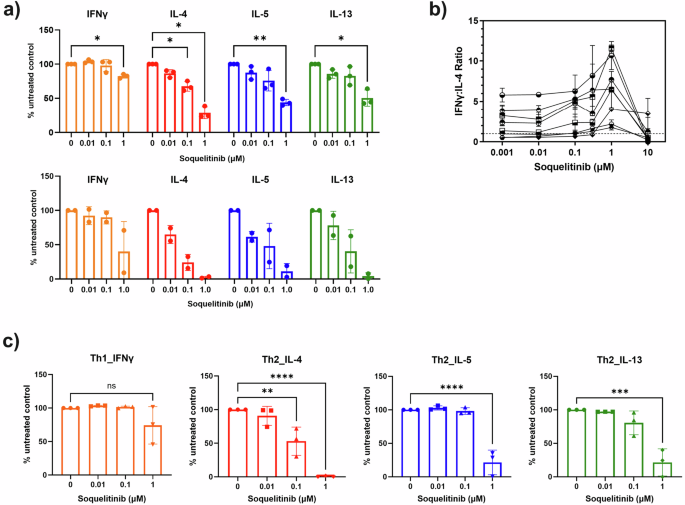
a Soquelitinib reduces TH2 effector cytokines in CD4 T cells from either healthy donors (n = 3, top panel) or Sezary cells from cutaneous T cell lymphoma (CTCL) patients (n = 2, bottom panel). Sorted CD4 + T cells from the blood of healthy donors and the CTCL patients were stimulated with the ImmunoCult human T cell activator for 3 days in the presence of soquelitinib or DMSO (dimethylsulphoxide) alone. Cytokines in culture supernatants collected on day 3 were quantified by MSD (Meso Scale Discovery cytokine panel). Data were reported as relative to DMSO-treated samples. b Soquelitinib has an effect on the ratio IFNγ/IL-4 in human CD4 T cells with a maximum effect at 1 μM. Human PBMCs (peripheral blood mononuclear cells) from multiple donors were pretreated with varying concentrations of soquelitinib for 1 h, followed by TCR (T cell receptor) stimulation. Stimulated cells were cultured for 6 days before restimulation with PMA (phorbol myristate acetate) and ionomycin for 4 additional hours. IFNγ and IL-4 production in human CD4 T cells was measured by intracellular cytokine staining. Percentage of IFNγ and IL-4 producing CD4+ cells was displayed as a ratio. c Polarized Th2 but not Th1 CD4+ cells showed greater sensitivity to soquelitinib. Naive CD4+ cells from three donors were first polarized in either Th1 or Th2 polarizing conditions for 6 days and then restimulated by anti-CD3/CD28 in the presence of varying concentrations of soquelitinib or DMSO for additional 2 days. Cytokines in culture supernatants collected after 48 h treatment and quantified by MSD. Figures were created using Graphpad Prism. NS, not significant, *p ≤ 0.05, **p ≤ 0.005, ***p ≤ 0.001 and ****p ≤ 0.0001. Tukey’s test for multiple comparisons after one-way ANOVA in Fig. 3a, top panel and Fig. 3c. Data displayed as means ± SEM.
We further validated the effect of soquelitinib on Th1 skewing of naïve CD4 T cells by enumerating the intracellular ratio of IFNγ to IL-4. Naive human CD4 T cells were activated in the presence of varying concentrations of soquelitinib for 6 days (Fig. 3b). Soquelitinib had a minimal effect on the ratio of IFNγ+ / CD4+ T cells at doses below 1 μM. As a result, at 1 μM concentration of soquelitinib, the ratio of IFNγ to IL-4 CD4+ T cells was increased by at least 2-fold (Fig. 3b). At a concentration of 10 μM, soquelitinib completely abolished production of either IL-4 or IFNγ in naïve CD4+ T cells, possibly due to its antiproliferative effects at high concentrations (Fig. 2e). Together, our results indicated that soquelitinib induced a Th1-skewing phenotype in naïve CD4 T cells in a non-polarizing culture condition.
Next, we evaluated the effect of ITK inhibition on polarized CD4 helper cells. Naïve CD4 cells were stimulated and differentiated under Th1 or Th2 polarizing conditions for 6 days before soquelitinib was introduced into the culture for an additional three days. Similar to ITK inhibition in naïve CD4 T cells, we found that soquelitinib inhibited the synthesis of Th2-associated cytokines such as IL-4, IL-5 and IL-13 in polarized Th2 cells, while IFNγ production by Th1 was minimally affected (Fig. 3c). Collectively, our results indicated that ITK inhibition by soquelitinib can skew the balance between Th1 and Th2 cells.
Comparison of soquelitinib with a non-selective ITK inhibitor
Next, we evaluated the effect of ITK inhibition on CD8+ cytotoxic T lymphocytes (CTLs). We compared soquelitinib to a non-selective covalent ITK inhibitor that binds to both ITK and RLK using ovalbumin (OVA)-stumulated and expaned OT-1 TCR+ CTLs (Fig. 4). The non-selective compound, which has a similar chemical structure to soquelitinib, exhibits an IC50 for enzymatic inactivation of ITK and RLK of 0.6 nM and 2.2 nM, respectively, compared to 0.5 nM and 261 nM for soquelitinib (approximately 100 fold more reactive to RLK). As shown in Fig. 4a–c, the non-selective ITK inhibitor reduced IL-2, IFNγ, and granzyme B production in OT-1 CTLs to a greater extent than seen with soquelitinib. Granzyme B was barely affected at dose up to 1 μM of soquelitinib. The results indicated that the non-selective ITK inhibitor behaves differently from soquelitinib, having a negative impact on cytotoxic T cell effector function consistent with the idea that ITK selectivity with sparing of RLK is a critical feature for ITK drug targeting.
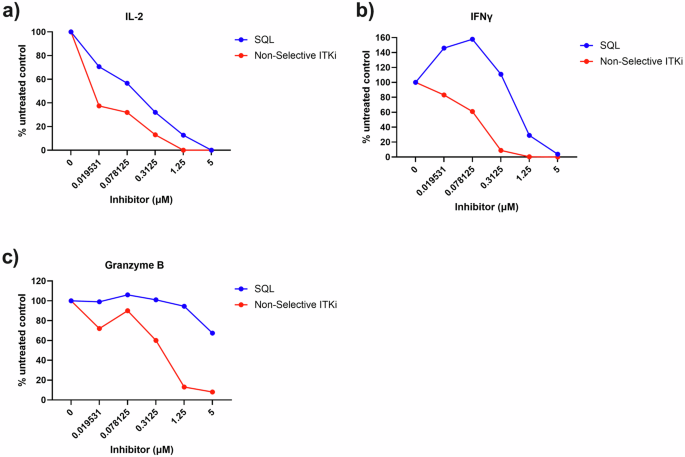
OT-1 CD8+ T cells were stimulated with OVA257–264 peptide and differentiated in vitro into CTLs for 7 days. Differentiated OT-1+ CTLs were restimulated with OVA peptide and treated with either DMSO or indicated concentrations of soquelitinib. Culture supernatants were collected after 48 h treatment and quantified by MSD. Amounts of IL-2 (a), IFNγ (b), and granzyme B (c) production was expressed as relative to DMSO-treated samples. Representative of two independent experiments is shown. Figures were created using Graphpad Prism.
Soquelitinib shows efficacy as a single agent in several murine tumor models
The safety of soquelitinib was evaluated in rats given 28 daily oral doses and revealed a no adverse effect level exceeding 1000 mg/kg/day. Using an immuno-electrochemilumiscence assay described previously13, we confirmed that soquelitinib treatment produced sustained ITK target occupancy in vivo in mice at an oral dose of 50 mg/kg. The safety of soquelitinib and its ability to reduce Th2 responses with relative sparing of Th1 responses prompted us to test the potential of soquelitinib as an immunotherapy for cancer. We first investigated the activity of soquelitinib on tumor growth on a range of murine syngeneic tumor models. These tumor models included CT26 colon adenocarcinoma, RENCA renal cell carcinoma, B16F10 OVA melanoma, A20 B cell lymphoma and EL4, an ITK expressing T cell lymphoma. As shown in Fig. 5a, administration of soquelitinib as a single agent at 10 mg/kg (B16F10 OVA, and RENCA), and 30 mg/kg (CT26, and EL4) in solution formulation or 130 mg SQL/kg chow in food formulation (A20 model) resulted in a significant inhibition of tumor growth in all five tumor models. To exclude the possibility that soquelitinib could be directly cytotoxic for some tumor cells, we studied the effect of soquelitinib in vitro on the growth and viability of CT26 and EL4 cells (Supplementary Fig. 4). We found no direct effects on cell viability or proliferation. The CT26 model was selected for further studies.
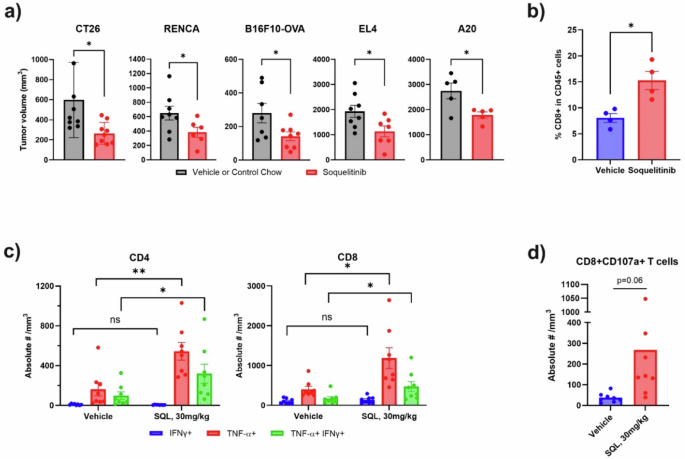
a Soquelitinib elicits anti-tumor activity in a range of murine syngeneic tumor models. Mice with established tumors indicated here were treated with vehicle/control chow or solution-formulated soquelitinib, 30 mg/kg (CT26 and EL4), 10 mg/kg (RENCA and B16F10-OVA) or soquelitinib chow, 130 mg/kg (A20) daily for 7–8 days (all tumors except A20) or for 13 days (A20). Tumor measurements were performed 2–3 days after last dosing. Results are representative of at least two independent experiments. n = 5–8/group. b Soquelitinib treatment increases intratumoral CD8 infiltration in the CT26 tumor model. Percentage of CD8+ TILs was determined by flow cytometry from isolated CT26 tumors treated with either vehicle or soquelitinib for 8 days. c Soquelitinib-treated animals showed increased production of inflammatory cytokines in tumor infiltrating lymphocytes (TILs) from the CT26 tumors. IFNγ- and/ or tumor necrosis factor (TNF)- producing T cells were assessed by intracellular cytokine staining after restimulation ex vivo with PMA+ionomycin for 4 h. (n = 8 per group). d Soquelitinib increases expression of CD107a on CD8 TILs. TILs purified from individual CT26 tumors were stimulated ex vivo with the plate-bound anti-CD3 and soluble anti-CD28 for 4 h. Degranulation of CD8+ TILs was measured by flow cytometry. Quantification of CD107a+ cells is expressed as the absolute numbers of CD107a + CD8 + T cells per mm3 of tumors. Representative of two independent experiments is shown. Graphs were created using Graphpad Prism. NS not significant, *p ≤ 0.05, and **p ≤ 0.005. Data displayed as means ± SEM. SQL soquelitinib.
Soquelitinib treatment enhances CD8 T cell infiltration and increases cytolytic capacity of tumor-infiltrating lymphocytes (TILs)
As shown in Fig. 5b, soquelitinib monotherapy induced significantly higher frequency of intra-tumoral CD8 T cells in the CT26 model. We assessed the cytolytic capacity of infiltrating T cells by measuring inflammatory cytokine production (Fig. 5c) and CD107a degranulation (Fig. 5d) in CD8 + T cells. We demonstrated that soquelitinib promoted production of IFNγ and TNFα by both CD8+ and CD4+ tumor infiltrating lymphocytes and enhanced cytotoxic capacity as determined by an increase in CD107a + CD8 cells from soquelitinib-treated CT26 tumors (Fig. 5d). Collectively, our results revealed that soquelitinib enhanced infiltration and effector function of TILs.
Soquelitinib enhances anti-PD1 and anti-CTLA4 efficacy in the CT26 tumor model
Given that soquelitinib showed activity as a single agent in several murine tumor models, we next asked whether soquelitinib could enhance the antitumor activity of anti-PD1 and anti-CTLA4 antibodies that target immune checkpoints. As shown in Fig. 6a, mice with established CT26 tumors were treated with either vehicle, soquelitinib alone, dual combination therapy with a suboptimal dose of anti-PD1 and anti-CTLA4 antibodies or triple combination therapy including soquelitinib. While soquelitinib or dual combination therapy with anti-PD1 and anti-CTLA4 resulted in substantial inhibition of tumor growth, combining soquelitinib with anti-PD1 and anti-CTLA4 further reduced tumor growth. Thus, soquelitinib augments the antitumor efficacy of immune checkpoint blockade.
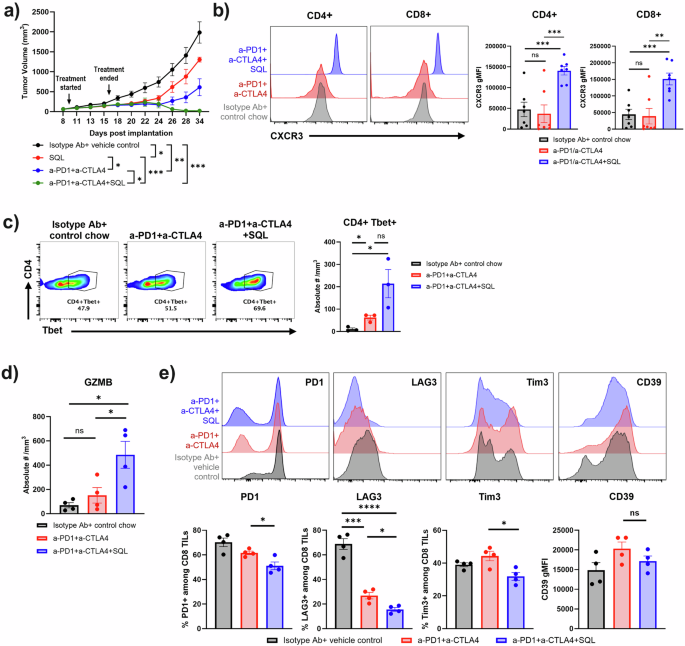
a Soquelitinib in combination with anti-programmed cell death receptor one (PD1) and anti-cytotoxic T lymphocyte antigen four (CTLA4) induces long-term anti-tumor immunity in the CT26 tumor model. Treatment with solution-formulated soquelitinib alone (30 mg/kg) or suboptimal dose of anti-PD1 (25 μg/mouse) and anti-CTLA4 (25 μg/mouse) resulted in an incomplete inhibition of tumor growth, whereas triple combination therapy exhibited durable anti-tumor response even after treatment was terminated for more than 2 weeks. n = 8 per group. Representative of two independent experiments is shown. b Soquelitinib treated T cells in blood display an increase in CXCR3 cell surface expression. Representative histogram overlays of CXCR3 expression on CD4+ and CD8+ T cells from blood samples (Left) and summary graphs of CXCR3 geometric mean fluorescence intensity (gMFI) in CD4+ and CD8+ T cells (Right). n = 7–8 per group. c In the presence of checkpoint inhibitors, soquelitinib induces an increase in Tbet+ CD4 T cells in the TME. Representative flow plot of Tbet-expressing CD4+ TILs (Left), and enumeration of CD4+Tbet+ cells after normalization for tumor size (Right). n = 3 per group. d Soquelitinib enhances granzyme (GZMB) production in CD8+ TILs. Granzyme B + CD8 T cells are expressed as the absolute numbers of granzyme B + CD8 + T cells per mm3 of tumors. n = 4 per group. Blood samples (b) or tumors (c, d) were collected from the CT26 tumor-bearing animals treated with either control chow, anti-PD1+anti-CTLA4 or triple combination therapy with soquelitinib chow (300 mg/kg/day) for 10 days and sacrificed one day after treatment. (e) Soquelitinib in combination with checkpoint blockade inhibitors reduces surface expression of exhaustion markers in the CT26 tumor model. Representative histogram overlays of indicated exhaustion marker expression in CD8+TILs from the CT26-tumor bearing mice treated with either isotype antibody plus vehicle control, dual combination, and triple combination are shown (Top). Treatment schedule was the same as shown in panel A. Tumors were harvested 8 days following the last dose of soquelitinib treatment. Summary graph of exhaustion marker expression is shown (Bottom). N = 4 per group. Graphs were drawn using Graphpad Prism. Histograms were created by Flowjo. NS not significant, *p ≤ 0.05, **p ≤ 0.005, and ***p ≤ 0.001. Data displayed as means ± SEM. Results are representative of two independent experiments. SQL soquelitinib.
Combination of soquelitinib with checkpoint inhibitor blockade promotes a Th1 skewed microenvironment
We next asked whether a soquelitinib -induced Th1 skewed phenotype plays a role in the therapeutic synergy between soquelitinib and checkpoint inhibitors. To track CD4 + Th1 cells in vivo, we compared CXCR3 expression, a surrogate marker for Th1 cells, in T cells from the blood of control, anti-PD1 and anti-CTLA4, or triple combination therapy groups. We found a marked upregulation of CXCR3 surface expression in both CD4+ and CD8 + T cells in the triple combination therapy group compared with either control or immune checkpoint dual treatment groups (Fig. 6b). Induction of CXCR3high-expressing CD4 + T cells supports the notion that combining soquelitinib with ICB enhances Th1 immunity. Surprisingly, soquelitinib treatment also induced higher levels of CXCR3 expression on CD8 T cells (Fig. 6b). In further support of increased Th1 immunity in the triple combination therapy, we found that expression of Tbet and the absolute number of Tbet positive CD4 cells (Fig. 6c, left and right panels, respectively), a lineage-defining transcription factor for Th1 CD4 T cells, were enhanced in tumors obtained from mice receiving triple combination therapy as compared with the dual combination or vehicle control groups.
It has been reported that CXCR3 expression on CD8 T cells is required for anti-PD1 mediated antitumor response14. We assessed whether the findings of Th1-favoring tumor microenvironment correlates with enhanced intra-tumoral CD8 T cell function by examining production of granzyme B on CD8 T cells (Fig. 6d). Indeed, the frequency of granzyme B-producing CD8+ T cells was the highest in the triple combination therapy group (Fig. 6d). Together, our results strengthened the concept that the Th1 skewing response triggered by soquelitinib might lead to improved CD8 function.
Soquelitinib treatment decreases expression of T cell exhaustion markers
Previous reports have shown that T cell exhaustion limits durability of antitumor response triggered by ICB15. We characterized markers associated with T cell exhaustion (PD1, Tim3, LAG3, and CD39) in CD8+ TILs purified from CT26 tumors from each treatment group by flow cytometry. As shown in Fig. 6e, we found a reduction in surface expression of several exhaustion markers in the triple combination group as compared to the dual combination without soquelitinib. We additionally characterized subsets of exhausted CD8 TILs using Ly108 and CD69 markers, which further categorize exhausted T cells into progenitor-exhausted and terminally-exhausted T cell populations (Supplementary Fig. 5). The path to T cell exhaustion was previously shown as progenitor 1 (Ly108 + CD69 + ), progenitor 2 (Ly108 + CD69 − ), intermediate (Ly108-CD69−), and terminal (Ly108-CD69 + ) as TIL hypo-responsiveness becomes irreversible at the last stage16. Although the percentage of terminal (Ly108-CD69 + ) population was significantly reduced in the anti-PD1 and anti-CTLA4 dual combination group, combining soquelitinib with ICB further shifted the proportions within CD8+TILs from the terminal (Ly108-CD69 + ) population to the intermediate (Ly108-CD69-) population. Increased frequency of the intermediate (Ly108 − CD69 − ) population correlated with increased granzyme B expression which was observed in the triple combination group (Fig. 6d).
Soquelitinib treatment reinvigorates T-cell function in vitro
To better characterize the effect of soquelitinib on T cell exhaustion, we adopted an in vitro culture system in which T cell exhaustion gradually progresses after repeated TCR stimulation17. OT-1 CD8+ T cells receiving multiple rounds of OVA peptide stimulation exhibited signs of T cell exhaustion as evidenced by upregulation of LAG3 and TIGIT markers (Fig. 7a). Increasing concentrations of soquelitinib added to the cultures 48 h after the first OVA stimulation resulted in a reduction in the expression of these markers. These results demonstrate that in the setting of continuous stimulation, the expression of exhaustion markers, LAG3 and TIGIT, are reduced by soquelitinib.
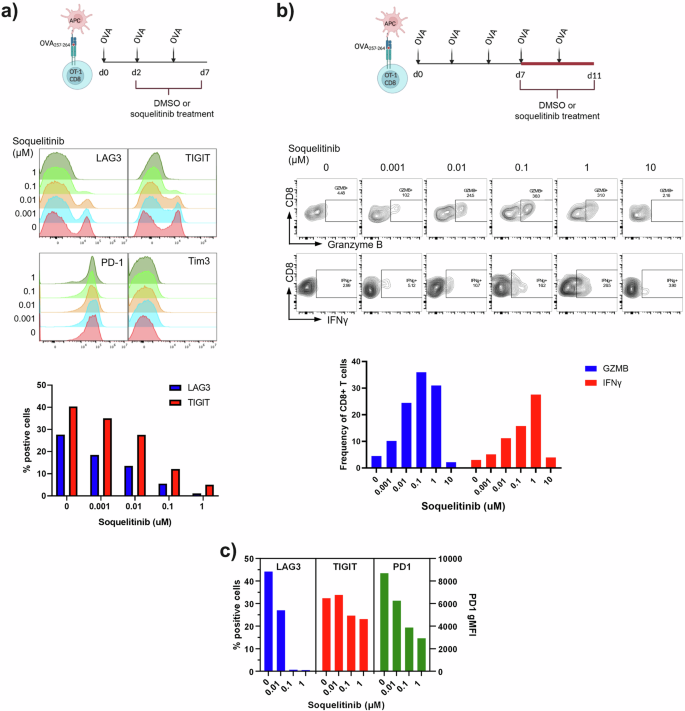
a Schematic displaying the experimental design for evaluating the effect of soquelitinib on OT-1 T cell exhaustion process (Top). Soquelitinib inhibits the expression of several markers associated with T cell exhaustion in a dose-dependent manner. Representative histogram overlays of indicated exhaustion marker expression in CD8 + Va2+ T cells are shown at day 7 (Middle). Graph of two exhaustion markers, lymphocyte activation protein three (LAG3) and T cell immunoreceptor with Ig and ITIM domains (TIGIT) is shown (Bottom). b Schematic describing the experimental design for evaluating the effect of soquelitinib in restoring T cell function of the exhausted cells in vitro (Top). Soquelitinib dose-dependently (up to 1 μM) restores the potential functions of OT-1 CD8 T cells as indicated by increased production of granzyme B and IFNγ production following the 4 days treatment period. Representative histograms of granzyme B and IFNγ- from OT-1 T cells treated with indicated concentration of soquelitinib or DMSO control are shown (Middle). Graph of granzyme B and IFNγ-producing OT-1 T cells is shown (Bottom). c Soquelitinib inhibits the expression of several markers associated with T cell exhaustion in human CD4 + T cells. Graph of three exhaustion markers, LAG3, TIGIT, and PD1 is shown. Graphs were drawn using Graphpad Prism. Histograms and dot plots were drawn using Flowjo. Schematics were drawn using Biorender. OVA ovalbumin, APC antigen presenting cell, MFI mean fluorescence intensity, SQL soquelitinib. Data are from two separate experiments.
We further investigated whether soquelitinib treatment might allow functional recovery or reinvigoration from T cell exhaustion. As shown in Fig. 7b, we first induced T cell exhaustion in OT-1 CD8 T cells by repeated OVA stimulation for 7 days and then treated exhausted cells with either DMSO or varying concentrations of soquelitinib. As expected, we observed that T cell functions such as granzyme B and IFNγ production were greatly diminished in DMSO-treated OT-1 cells. Varying concentrations of soquelitinib restored these functions following a 4-day treatment period as indicated by an increased percentage of granzyme B- and IFNγ-producing OT-1 T cells, except at the highest 10 μM concentration tested which is likely related to non-specific anti-proliferative effects. Together, our data suggested that soquelitinib restored cytolytic function to exhausted CD8 T cells. Furthermore, we also demonstrated that repeated TCR stimulation of human CD4 T cells with anti-CD3 and anti-CD28 recapitulated the in vitro exhaustion process which we demonstrated in mouse OT-1 CD8 T cells. Again, soquelitinib down-regulated expression of exhaustion markers such as LAG3, TIGIT and PD1 induced by chronic stimulation through TCR in human CD4 T cells following 6 day treatment with soquelitinib (Fig. 7c). Together, the results from the in vitro model of T cell exhaustion demonstrated that inhibition of T cell exhaustion by soquelitinib is conserved in human T cells.
Discussion
ITK is a member of the TEC family of kinases that plays a major role in T cell activation by integrating both TCR and CD28 costimulatory signaling pathways9. Studies from ITK knockout mice18,19,20,21 and in vitro studies using shRNA knock-down11 demonstrate that ITK modulates the magnitude of TCR signaling strength, leading to distinct fates during T cell differentiation and to the activation of distinct subsets of effector functions. This modulatory role for ITK is partially redundant since the structurally similar TEC kinase, RLK, has overlapping functions in Th1 cells. In this report, we describe soquelitinib, a covalent inhibitor that is selective for ITK while sparing RLK. Covalent ITK inhibitors targeting Cys-442 have been reported previously, however the molecules are not selective and inhibit TEC kinases or other kinases that harbor a homologous cysteine residue. Ibrutinib is a potent BTK inhibitor and a weaker ITK inhibitor22. Although it has been reported as an irreversible molecular inhibitor of ITK23, it is relatively nonselective toward several other kinases and achieves only modest levels of ITK occupancy (50%) in PBMCs from subjects administered up to 840 mg ibrutinib22,23. Zapf et al., described PF-06465469 with a kinact/Ki for ITK of 0.016 µM−1 s−1 24 which is weaker than soquelitinib and was reported to be equally potent for BTK in an IC50 assay. Harling et. al., also produced a chemical series for inhaled delivery where a representative molecule was reported with kinact/Ki = 1.9 µM−1 s−1 and BTK IC50 = 80 nM25. More recently, Zhong et al., described PRN694 as a dual ITK and RLK inhibitor with kinact/Ki values of 4.7 µM−1 s−1 and 0.46 µM−1 s−1, respectively26. The molecule also displayed significant inhibition toward the other TEC kinases. Thus, among reported covalent kinase inhibitors, soquelitinib is the most selective irreversible ITK inhibitor characterized to date.
Our studies confirm that pharmacologic blockade of ITK by soquelitinib results in the expected inhibition of downstream signaling proteins including pPLCγ1, pERK, pS6, and NFκB and reduced secretion of IL-2. Moreover, inhibition of GATA-3 expression also was observed, supporting the known intricate relationship between ITK and GATA-3 function and the crucial role of ITK and GATA-3 in Th2 function11. Consistent with previously reported ITK knockout studies, we demonstrate preferential inhibition of Th2-derived cytokines such as IL-4, IL-5 and IL-13 with relative sparing of the Th1-derived cytokine, IFNγ. We find that at very high concentrations (10 μM), non-specific anti-proliferative effects of soquelitinib dominate over the effects on T cell differentiation. Collectively, the selectivity and differential effects of soquelitinib on Th1 versus Th2 cells support the notion that there might be a therapeutic window for potential utility as an immunotherapy for cancer by blocking Th2 function without interfering with Th1.
Indeed, we find that soquelitinib inhibited tumor growth in several murine models including tumors that do not express ITK. In a monotherapy setting, we show increased infiltration of CD8 + T cells in CT26 tumor models. Furthermore, tumor-infiltrating T cells possess increased cytolytic capacity as evidenced by elevated production of IFNγ, TNFα, and CD107a (Fig. 5). Combining soquelitinib with immune checkpoint blockade further enhances anti-tumor efficacy, leading to deep tumor regression after treatment was terminated. Several possibilities can explain this enhanced immune response to cancer in the presence of the ITK inhibitor. First, soquelitinib preferentially inhibits Th2 cytokine synthesis. Th2 cytokines have been implicated as negative regulators of the immune response to cancer27. There is evidence that targeting the Th2 pathway might alleviate immunosuppression in the tumor microenvironment (TME) by inhibiting the differentiation of M2-like tumor infiltrating macrophages and Th2-promoting dendritic cell subset28. In addition to relieving immunosuppression, selective blockade of ITK appears to modulate intratumoral balance between Th1 and Th2 cells within the TME. We show that CD4+ tumor infiltrating lymphocytes (TILs) from soquelitinib -treated tumors produce a higher percentage of cells expressing IFNγ and TNFα, dominant cytokines produced by Th1 cells (Fig. 5c) and more Tbet+CD4 conventional cells were detected in the TME (Fig. 6c). A previous report has shown that the Th1 cytokine, IFNγ, can induce a positive feedback loop for its own production by Th1 CD4 T cells29. This could potentially reinforce a bias away from a Th2- to Th1-favoring TME, resulting in further inhibition of tumor growth.
Another piece of evidence to support a Th1-favoring TME was that surface expression of CXCR3, a Th1-chemokine receptor, was significantly upregulated in both CD4+ and CD8 + T cells from soquelitinib treated animals (Fig. 6b, c). Our result is consistent with the study from CXCR3-deficient mice showing that CXCR3-mediated T cell recruitment to the TME is strongly associated with the induction of Th1 and cytolytic CD8 T cells30. Since CXCR3 upregulation is linked to a higher migratory capacity of T cells, this could potentially explain increased infiltration of CD8 T cells found in soquelitinib treated tumors.
Second, selectivity of soquelitinib to inhibit ITK over RLK enables specific blockade of ITK-mediated immune modulation, while preserving CD8 and Th1 cell functions. In support of this, we have observed that using a non-selective inhibitor of soquelitinib that reacts with both ITK and RLK, results in marked reduction in IFNγ, IL-2 and granzyme B production in CD8 T cells whereas soquelitinib shows no significant effects on granzyme B and IFNγ production unless high concentrations are tested (Fig. 4). This result mirrors the findings from the ITK-and RLK -double knockout mice in which CD8 and Th1 T cell functions were greatly impaired31,32. Together, achieving significant selectivity over RLK could avoid potential impacts on vital T cell functions which are critical in driving anti-tumor immunity.
Third, preventing or reverting T cell exhaustion after soquelitinib treatment may enhance anti-tumor immunity and increase the duration of an antitumor response. It is known that continuous antigen exposure can lead to T cell exhaustion, which is characterized by gradual deterioration of CD8 T cell function and elevated expression of inhibitory receptors such as PD1, TIGIT, LAG3 and Tim333. CD8 exhaustion has become a major barrier to cancer immunotherapy as the dysfunctional state has inverse correlation with clinical prognosis. Previous study from Weber and colleagues34 has shown that transient cessation of CAR-T signaling using a Src-family kinase inhibitor, dasatinib, that blocks proximal TCR signaling, can redirect exhausted CAR-T cells to a memory T cell state. They provided further evidence that epigenetic remodeling is required for functional reinvigoration. Since ITK is downstream of the TCR signaling pathway, it is possible that our findings are similar to findings seen with dasatinib. ITK blockade might trigger a transient rest to disrupt continuous engagement between TCR and tumor antigen without causing permanent inhibition of TCR signaling. Consistent with this notion, we find a dose-dependent reversal of the exhaustion process as evidenced by increased production of granzyme B and IFNγ in the presence of up to 1 μM concentrations of soquelitinib (Fig. 7b). Future studies are needed to validate whether soquelitinib inhibits acquisition of the epigenetic hallmarks of T cell exhaustion and induces transcriptomic and epigenetic reprogramming. Moreover, previous studies have shown that acquisition of exhausted state and the differentiation of CD8 memory cells are controlled by similar TCR-induced transcriptional networks, especially nuclear factor of activated T cells, cytoplasmic component 1 (NFATC1) and interferon regulatory factor 4 (IRF4) which together induce the expression of inhibitory receptors like PD135,36,37,38. Results from the ITK-deficient mice have also indicated that ITK regulates the expression of these two transcriptional factors following TCR stimulation4,39,40. Therefore, it is conceivable that ITK blockade may fine-tune the underlying program of T cell exhaustion. Indeed, we observed downregulation of exhaustion marker expression following soquelitinib treatment (Figs. 6, 7). In addition to a role of ITK in regulating critical drivers of the exhaustion phenotype, a study by Strazza et al. has shown that ITK signaling is involved in the PD1-PDL1 signaling pathway, which results in inhibition of anti-tumor T cell immunity3. ITK blockade would be expected to prevent this inhibition and be synergistic with anti-PD1-directed therapies. Therefore, this provides another explanation for an enhancement of anti-tumor activity when soquelitinib is added to anti-PD1 and anti-CTLA-4 (Fig. 6).
Additionally, while ICB has emerged as a major therapeutic advance for cancer41, several resistance mechanisms have been elucidated including insufficient tumor immunogenicity, an immunosuppressive TME, defects in IFNγ signaling and T cell exhaustion42. Our finding of partial restoration of T cell functionality in the exhausted state can be advantageous as a growing number of studies indicate that ICB augments anti-tumor response through clonal replacement rather than reinvigoration of terminally-exhausted cells43,44,45. In support of this, Zhao and colleagues have recently reported on another ITK inhibitor which improves anti-tumor efficacy via reduced T cell exhaustion in several ICB refractory murine models of cancer46. Together, our data show novel utility of soquelitinib in mitigating T cell exhaustion, thereby prolonging anti-tumor response.
In conclusion, we have described inhibition of ITK as a novel approach to enhance the anti-tumor immune response, which occurs through several mechanisms including increased infiltration and function of cytotoxic lymphocytes and the reduction and reversal of T cell exhaustion. These observations support the use of a selective ITK inhibitor as a potential therapy for cancer. We have shown in mouse models that this approach has additive benefit to the use of recognized checkpoint inhibitors. Our in vitro data using human T cells are consistent with the murine studies. Furthermore, our preliminary work based on tumor biopsy in a Phase I clinical trial for T cell lymphoma is also consistent with the mouse studies47. A potential extrapolation of our observations is that immunotherapy of cancer can be improved, while autoimmune toxicities are diminished. Our future plans include the use of this specific inhibitor of ITK for the immunotherapy of a wide range of cancers.
Methods
Mass spectrometry
ITK was obtained as a glutathione S transferase (GST) fusion protein from Carna Bioscience (Product Number 08 081, Lot 13CBS 0356 K). The protein construct comprised amino acids 2 to 620 of ITK and is fused to GST at the N terminus of ITK (ITK GST). A 2 µM sample of the ITK GST fusion protein was incubated with a 5-fold molar excess of soquelitinib (10 µM). A control, untreated sample of ITK GST was prepared in parallel. The samples were incubated at room temperature for 2.5 h to allow for complete inhibition of ITK GST by soquelitinib. After the incubation phase, samples were frozen and stored at −80 °C. Mass spectral analysis was conducted in collaboration with the Stanford University mass spectrometry facility. The control, untreated ITK GST fusion protein, and the soquelitinib inhibited sample were subjected to chymotrypsin digestion and then analyzed by liquid chromatography coupled with tandem mass spectrometry (LC MS/MS). Peptides were separated using an Acquity M-Class liquid chromatograph (Waters Corporation, Milford, MA). Peptide separation was completed on a silica column packed with 1.9 micron C18 stationary phase. An analytical gradient of 80 min was used, with mobile phase A being 0.2% formic acid in water, and mobile phase B being 0.2% formic acid in acetonitirle. Ions electrosprayed from this column were detected using an Orbitrap Fusion mass spectrometer (Thermo Scientific, San Jose, CA) operated in a data dependent fashion using both electron transfer dissociation and high energy dissociation fragmentation to improve detection efficiency of modified peptides. To analyze these data, raw spectral files were investigated using Byonic v2.10.5 (Protein Metrics, Cupertino, CA) in a targeted database for the protein of interest. Peptides were constrained to 12 ppm mass accuracy for precursor ions, and 0.4 Da mass accuracies for fragment ions detected in the ion trap. Peptides were assumed to be digested in a semi specific fashion, and up to 2 missed cleavages were allowed. Assigned observed peptides were then validated by inspection of the initial ion mass spectrum, fragmented ion mass spectrum, and extracted ion chromatogram using Byologic (Protein Metrics, Cupertino, CA).
Biochemical kinase assays
Two biochemical assays of kinase activity were employed. The first is based on the Invitrogen Lanthascreen platform while the second used the PerkinElmer microfluidic based LabChip 3000 system. In the Lanthascreen assay each kinase (1.0 nM) was incubated with compound for 120 min at 22 °C in a buffer composed of 50 mM HEPES (pH 7.5), 10 mM MgCl2, 1 mM EGTA, and 0.01% Brij 35. The kinase reaction was initiated by the addition of ATP (50 µM final) and fluorescein-poly-Glu-Tyr peptide (200 nM final). The reaction was quenched after 60 min at 22 °C, and phospho-peptide product detected by the addition of EDTA (10 mM final) and terbium PY20 antibody (2 nM final). The phospho-peptide product was measured by time-resolved fluorescence resonance energy transfer (TR -FRET) between the terbium of the antibody and fluorescein of the phospho-peptide using an EnVision plate reader (PerkinElmer, Waltham, MA) equipped to detect the TR-FRET signal (excitation 320 nm, dual emission at 495 nm and 520 nm). All reagents including recombinant human kinases, fluorescein-poly-Glu-Tyr peptide, terbium PY20 antibody, and kinase buffer A were purchased from Invitrogen.
Alternatively, in the microfluidic assay each kinase (0.2 nM) was incubated with compound for 15 min at 22 °C in a buffer composed of 100 mM HEPES (pH 7.5), 0.1% BSA, 0.01% Triton X-100, 1 mM dithiothreitol (DTT), 5 mM MgCl2, 10 µM Sodium Orthovanadate, 10 µM Beta-Glycerophosphate and 1% DMSO. The kinase reaction was initiated by the addition of ATP (10 µM final) and fluorescein labeled Scrtide peptide (AnaSpec, Fremont, CA)(1 µM final). The reaction was quenched after 3 h at 22 °C by the addition of EDTA (20 mM final), and phospho-peptide product detected by direct fluorescence (ex: 480 nm, em: 520 nm) after electrophoretic separation from the substrate using a PerkinElmer EZ reader. All reagents were purchased from Sigma-Aldrich. Inhibition of kinase activity was measured by construction of a concentration response curve of the inhibitor.
pERK and pS6 assays
Fresh human peripheral blood mononuclear cells (PBMCs) were pre-incubated with either soquelitinib or DMSO vehicle controls at 37 °C for 1 h and then stimulated with anti-CD3 biotinylated and anti-CD28 biotinylated antibodies for 15 min and cross-linked with avidin conjugated antibody for 5 min. Following stimulation, cells were stained as previously described48 using anti–phospho-p44/42 ERK (Thr202/Tyr202) (197G2, Catalog # 14095, Cell Signaling Technology) or anti-phospho-S6 (Ser240/244) antibodies (D68F8, Catalog # 14236, Cell Signaling Technology). Phosphorylated ERK and S6 were detected by intracellular staining. Inhibition was measured by construction of a concentration response curve.
Flow cytometry
Cells were stained with the following antibodies against mouse CD45 (30-F1, Biolegend), CD8 (53-6.7, Biolegend), CD4 (GK1.5, Biolegend), CD39 (Duha59, Biolegend), PD-1 (29 F.1A12, BD), TIGIT (1G9, BD), LAG3 (C9B7W, Biolegend), Tim3 (RMT3-23, Biolegend), CXCR3 (CXCR3-173, Biolegend), TCRVα2 (B20.1, Biolegend), Ly108 (330-A-J, Biolegend), CD69 (H1.2F3, Cytek Bio) or against human CD3 (OKT3, Biolegend), CD4 (RPA-T4, Biolegend), CD45RA (HI100, Biolegend), CCR7 (G043H7, Biolegend), LAG3 (11C3C65, Biolegend), TIGIT (A15153G, Biolegend), PD-1 (A17188A, Biolegend). Fixable Viability Dye eFluor506, and eFuor780 (eBioscience) or ViaKrome 808 Fixable Viability Dye (Beckman Coulter) were used to exclude dead cells before analysis. For intracellular staining, cells were first stained with surface markers and then fix/ permeabilized using the Foxp3/Transcription Factor Staining kit (eBioscience) according to the manufacture’s protocol. For detection of intracellular IFNγ, TNF, cells were stimulated in vitro with either PMA (50 ng/ml, Thermo Fisher) and ionomycin (1 μM, Thermo Fisher) or with 5 ug/ml OVA peptide (a.a.257-264, InvivoGen) for 4–5 h in the presence of Golgi Stop (1/1000, BD) and Golgi Plug (1/1000, BD). Cells were then harvested for surface marker staining, followed by fixation and permeabilization as described above. Permeabilized cells were stained with antibodies against IFNγ (XMG1.2, Biolegend), and TNFα (MP6-XT22, Biolegend). For detection of granzyme B or Tbet, cells were stained with surface markers prior to fixation and permeabilization. Permeabilized cells were then stained with antibodies against granzyme B (GB11, BD (Becton Dickinson)), Tbet (4B10, Biolegend). For CD107a staining, tumor infiltrating lymphocytes (TILs) were stimulated with plate-bound anti-CD3 (2C11, 5 μg/ml) and soluble anti-CD28 (37.51, 1 μg/ml) for 4 h in the presence of Golgi Stop (1/1000, BD) and Golgi Plug (1/1000, BD) and an antibody against mouse CD107a (1D4B, Biolegend). Cells were then harvested for surface marker staining and washed twice with FACS buffer. Flow cytometry was then performed on the Cytoflex LX flow cytometer (Beckman Coulter) and analyzed using Flowjo software (TreeStar). Assessment of potential cytotoxicity in CD8+ TILs was displayed as absolute numbers of either CD107a- or granzyme B-producing CD8+ TILs that were normalized using tumor volume (mm3) because treatments resulted in the difference in tumor sizes at necropsy.
Inhibition of IL-2 production
Jurkat cells (0.25 (times) 106) in Dulbecco’s Modified Eagle’s medium (Gibco) supplemented with 5% FBS were seeded in each well of a 96 well MultiScreen® HV filter plate (EMD Millipore) placed on top of a 96 well collection plate. Soquelitinib was serially diluted in DMSO and added to the culture. After a 2 h incubation at 37 °C, the plates were centrifuged (188 (times) g for 15 s) to remove the inhibitor-containing medium from the filter plate. Cells were washed twice by resuspending with 200 μL of medium per well and centrifuged. Cells in each well were then resuspended with 1.25 (times) 106 (50 μL) of Dynabeads CD3 (Life Technologies) and incubated for 18 h at 37 °C. Conditioned media were collected by centrifugation (188 (times) g for 1 min). Human IL-2 concentration was measured with the AlphaLISA human IL2 Kit (PerkinElmer) and data collected on an Envision Plate Reader (PerkinElmer). Duplicates of the concentration response were collected at each determination.
Western blot analysis
For phosphorylation of phospholipase C (PLCγ1) and zeta associated protein (ZAP70), human H9 cells were pre-treated with soquelitinib for 1 h at 37 °C and then stimulated for 30 s with 6 μg biotinylated-anti human CD3 (UCHT1, eBioscience) plus 1.5 μg avidin (Pierce Nuclear and cytoplasmic) extracts from cell lysates were prepared for Western blot analysis as described by Jiang and colleagues12. Primary antibodies against total PLCγ1, phosphorylated PLCγ1(Y783), total ZAP70, and phosphorylated ZAP70 (Y319)were purchased from Cell Signaling Technology. IRDye 800CW Anti-Rabbit IgG and IRDye 700CW Anti-Mouse IgG (1:20,000 dilution) secondary antibodies were purchased from LI-COR. Protein signals were detected by the LI-COR Odyssey®Fc Imaging System.
Soquelitinib kinase binding constant (Kd)
The binding constants (Kd) of soquelitinib kinases: ITK, BLK, BMX, BTK, EGFR, ERBB2 ERBB4, ITK, JAK3, MMK7, TEC, and TXK (also known as RLK) were determined commercially by DiscoverX Corporation (Fremont, CA) using competition binding assays KINOMEscan™ Profiling Services Kd Report49. An 11-point 3-fold serial dilution of each test compound was prepared in 100% DMSO at 100× final test concentration and subsequently diluted to 1× in the assay (final DMSO concentration = 1%). The top conctration used for the Kd determinations was 30,000 nM. Curve images for Kd determination are presented in Supplemental Fig. 1.
Kinact/Ki for Soquelitinib binding to ITK
The acquisition of all progress curve data points and the calculation of kinetic parameters used to determine Kinact/Ki were performed by Nanosyn (Santa Clara, CA) using their standard processes and procedures. The generation of progress curves for ITK peptide phosphorylation in the presence of test inhibitor was performed at 10 soquelitinib concentrations (50.0, 41.7, 34.7, 28.9, 24.1, 16.7, 14.0, 11.6, 9.69, and 8.08 nM) in the presence of 0.5 nM purified ITK, and 1000 mM ATP. After initiating the enzyme reaction, the real-time curves were obtained for a total period of 5 h using a climate-controlled LabChip 3000 Drug Discovery System (Caliper Life Sciences, Hopkinton, MA). The raw progress curves (active enzyme) or their derivatives (unactive enzyme) were fitted with the following equation: ((A + Vs * t)) + (((V0 − Vs) * (1 − exp(((−1) * Kobs) * t))) / Kobs), to determine observed rates of association (Kobs). The obtained Kobs were plotted against compound concentration using a hyperbolic fit to determine Kinact/Ki values. These plots enabled determination of Kinact and Ki values. Curves and calculations are presented in Supplemental Fig. 2.
In vitro T helper (Th) cell differentiation and human T cell activation
Human PBMCs from healthy donors were isolated by density gradient method using Ficoll-Paque and Sepmate tubes (Stemcell Technology). Live naïve CD4+ T cells were purified from PBMCs post staining with fluorescence labelled antibodies to human CD3(OKT3, Biolegend), CD4 (RPA-T4, Biolegend), CD45RA (HI100, Biolegend), CCR7 (G043H7, Biolegend) followed by sorting of cells using the SONY SH800 sorter or obtained with the naïve human CD4+ T cell isolation kit (StemCell Technology). For T helper cell culture, purified CD4+ T cells were stimulated with immobilized anti-human CD3 (5 μg/ml, clone UCHT1) and soluble anti-human CD28 (1 μg/ml, clone CD28.2) in the presence of Th polarizing cocktails for 6 days (see below). Cells were washed twice with fresh medium and 100,000 differentiated CD4 Th cells were aliquoted to each well and re-stimulated with 12 μl of solution mixture of antibodies to human CD2, CD3, and CD28 (ImmunoCult human T cell activator, StemCell Technologies) in total volume of 200 μl complete RPMI medium in a 96-well U bottom plate in the presence of either DMSO or soquelitinib for 48 h. Culture supernatants were collected, and the amounts of cytokines were assessed by MSD (Meso Scale Discovery cytokine panel). Th1 condition: Recombinant human IFNγ (10 ng/ml, R&D Systems), and IL-12 (10 ng/ml, R&D Systems), anti-human IL-4 (OA19A66, Biolegend) and anti-human IL-5 (TRFK5, Biolegend) neutralizing antibodies (10 ug/ml each, Biolegend); Th2 condition: Recombinant human IL-4 (10 ng/ml, R&D Systems), IL-5 (10 ng/ml, R&D Systems), anti-human IFNγ (B27, BD) and anti-human IL-12 (C8.6, Biolegend) neutralizing antibodies (10 mg/ml each, Biolegend). For T cell activation in non-polarizing conditions, total PBMCs or purified human naïve CD4 + T cells were stimulated with the ImmunoCult human T cell activator (StemCell Technologies) in the presence of either DMSO or soquelitinib for 72 h. Cytokines were quantified by MSD from culture supernatants or by intracellular cytokine staining. Pre-treatment cells from subjects with Sezary syndrome were obtained from patients who were participating in a Phase I trial of soquelitinib to treat T cell lymphoma. Both the treatment protocol and the study of blood from subjects in this trial were approved by the Stanford Medical Center Institutional Review Board, protocol 50588, assurance number FWA00000935.
Rodent studies
All animal experiments were conducted in accordance with the American National ResearchCouncil’s Guide for the Care and Use of Laboratory Animals and approved by an Institutional Animal Care and Use Committee at Corvus (Protocol 2023_002). Mice were maintained in standard specific pathogen-free (SPF) housing conditions (20 ± 2 °C, 50 ± 5% humidity, 12 h–12 h light dark cycles, food and water ad libitum), unless specified as per study design. C57BL/6 and BALB/c female mice were supplied by Charles River at 8 to 10 weeks of age and >18 g and housed in the Innovive IVC Rodent Caging System with a maximum holding of 5 animals. OT-1 TCR transgenic mice were purchased from Jackson Laboratory (stock no. 003831). Safety of orally administered soquelitinib was evaluated in a GLP (Good Laboratory Practice) 28-day repeat dose, toxicity study in Sprague-Dawley rats purchased from Charles River.
For the preclinical tumor studies, all tumor cells were implanted subcutaneously. Tumor cells are suspended in 1:1 Matrigel : PBS and injected subcutaneously into the flank or lower back region. All tumor cell injections are performed by subcutaneous injection under general anesthesia using isoflurane inhalant. Up to 0.5 × 10⁶ tumor cells in a 100 ul volume per animal (depending on the tumor type) are injected. Tumor implantation requires mice to be under anesthesia so that implantation position can be uniform and to reduce leakage of cell suspension from injection site. Animals are monitored daily and euthanized if mice appear morbid. Tumor volumes are measured 3X weekly using calipers, beginning when tumors are palpable and ending at the time of sacrifice. Animals with established tumors (75–100 mm3, approximately 8–10 days post tumor implantation) are randomized using the Studylog@ software and divided into indicated treatment groups. Animal weights are recorded prior to tumor cell injection: body weight is monitored at least 2x weekly following initiation of treatment or cell injection for the duration of the study. Any tumor that achieves a size of >2000 mm3 or is ulcerated beyond 50% of the tumor volume would result in the animal being euthanized immediately. The average study duration in this paper is 28 days.
Tumor, blood, and spleen tissues were collected at the end of study. For the final timepoint, blood was collected via intracardiac puncture, which was performed under isofluorane anesthesia or death by CO2 with observed respiratory and cardiac arrest. Animals were euthanized prior to recovery from anesthesia.
Syngeneic murine tumor models
Murine cancer cell lines such as CT26 (colorectal carcinoma), RENCA (renal cell carcinoma), EL4 (T cell lymphoma), A20 (B cell lymphoma) were obtained from ATCC. Ovalbumin-expressing B16F10, B16F10-OVA (melanoma) was purchased from Millipore-Sigma. All cell lines were maintained under limited passage from original stocks. Cells in PBS were mixed in 1:1 volume with matrigel (Corning) and subcutaneously implanted into the right flanks of mice (unless otherwise stated). Tumor volume was measured using the formula as follows: Volume = (width2 × length) / 2. Mice with established tumors (75–100 mm3, approximately 8–10 days post engraftment) were randomized and divided into indicated treatment groups.
In vivo treatments
For soquelitinib treatment, a soquelitinib stock was formulated in solution consisting of Tween 80/Kolliphor ELP/propylene glycol/PEG 300 / 2% hydroxypropyl cellulose water or in chow diets with macronutrient levels matching the common Teklad 2018 diet (Research Diets, Inc., New Brunswick, NJ). Tumor-bearing animals were treated with solution-formulated soquelitinib or vehicle control by oral gavage twice a day (30 mg/kg/day), unless otherwise indicated in figure legends or allowed access to ad libitum control or soquelitinib diets (130 or 200 mg / kg / day). Adequate drug exposure was confirmed by standard LC-MS method in plasma samples. For immune checkpoint blockade (ICB), suboptimal dose (25 μg / mouse) of isotype antibodies (rat IgG2a, or Syrian hamster IgG, BioXcell) or anti-PD-1 (RPM 1-14, BioXcell) and/or anti-CTLA4 (9H10, BioXcell) blocking antibodies were injected every three days intraperitoneally.
Isolation of tumor infiltrating lymphocytes (TILs)
Tumors were collected and digested for 30 min at 37 °C with the mouse tumor dissociation kit (Miltenyi) in combination with mechanical force using the gentleMACS Octo Dissociator (Miltenyi). Single-cell suspensions were further prepared as previously described48 and then used in various assays of T cell function.
In vitro T cell exhaustion culture
Pooled spleen and lymph nodes from the OT-1 TCR transgenic mice were used to generate single-cell suspensions after red blood cell lysis. OVA peptide (a.a.257-264, InvivoGen) was added at concentration of 5 μg/ml to washed pooled cells and cultured at 5 × 10⁶ cells/ml. After 48 h, co-cultures were counted and recultured as 1 × 10⁶ cells/ml in fresh medium containing 20 U/ml recombinant human IL-2 (StemCell Technologies) in the presence of soquelitinib or DMSO for an additional 5 days. Every 2 days, OVA peptide was added for repeated stimulation and fresh soquelitinib was replenished in the culture. On day 7, cells were either harvested to assess levels of exhaustion marker expression by flow cytometry or DMSO-treated cells were purified using the mouse CD8 T cell isolation kit (StemCell Technologies). Enriched mouse CD8 + T cells were then treated with either DMSO alone or soquelitinib at concentrations ranging from 0 to 10 μM with additional two rounds of stimulation with the OVA peptide. Cells were harvested on day 11 to measure granzyme B and IFNγ cytokine production. For in vitro exhaustion culture using human CD4 T cells, naïve CD4 T cells were purified using the naïve human CD4 + T cell isolation kit (StemCell Technology) and stimulated with immobilized anti-human CD3 (5 μg/ml, clone UCHT1) and soluble anti-human CD28 (1 μg/ml, clone CD28.2) for 48 h without soquelitinib. Stimulated CD4 + T cells were passaged onto a fresh anti-CD3 coated plate every two days for additional 3 times in the presence of 5 ng/ml hIL-2 and soquelitinib at the indicated concentration. On day 8, cells were harvested for the assessment of exhaustion marker expression.
In vitro generation of OT-1 CTLs (cytotoxic T lymphocytes)
Pooled spleen and lymph nodes from the OT-1 TCR transgenic mice were used to generate single-cell suspensions after red blood cell (RBC) lysis. Cells were seeded at 10 × 106 per well in a 6 well plate and stimulated in the presence of OVA peptide (a.a.257-264, InvivoGen) at concentration of 0.5 μg/ml for 48 h. All activated cells were harvested and washed twice with PBS and subsequently seeded at 0.5 × 10⁶/ml, supplemented with 5 ng/ml of recombinant IL-2 (StemCell Technology). Every other day, 0.5 × 10⁶/ml cells were reseeded in complete RPMI medium containing 5 ng/ml recombinant IL-2. On day 7, differentiated CTLs were counted and washed twice for reactivation with the OVA peptide in the presence of either a non-selective ITK inhibitor which binds to both ITK and RLK or soquelitinib at concentrations ranging from 0.019531 μM to 5 μM. Two days later, the amounts of IL-2, IFNγ and granzyme B were quantified by MSD from culture supernatants.
Statistical analysis
The data are displayed as means ± SEM, unless otherwise indicated. All statistical analyses were performed using GraphPad Prism Software. Significance was determined using an unpaired two-tailed Student t-test, unless otherwise indicated. Differences were considered statistically significant at p < 0.05. P values are reported as: ns. p > 0.1, *p < 0.05, **p < 0.01, ***p < 0.001, ****p < 0.0001.
Responses