Pre-T cell receptor-α immunodeficiency detected exclusively using whole genome sequencing

Introduction
T cells are crucial for immune competence and play central roles in orchestrating effective cellular and humoral responses. From the differentiation and maturation of thymocyte progenitors in the thymus to branching of T cell populations enabling their respective specialised functions, cross-talk between T cells and other immune counterparts (including B and NK cells) or haematopoietic niches (such as the thymus and bone marrow), are instrumental for shaping their development and allow for precise effector and memory immune responses1. Genetic aberrations in key molecules involved in pathways of T cell development lead to profound immunodeficiencies such as severe combined immunodeficiency (SCID), rendering infants susceptible to bacterial, viral, and fungal invasive infections2,3. Curative treatment such as haematopoeitic stem cell transplantation (HSCT) is needed within the first year of life to prevent early mortality4,5,6.
Newborn screening (NBS) for SCID has revolutionized the diagnosis and management of SCID, enabling early diagnosis and access to treatment7. Screening is based on the quantitative measurement of T cell receptor excision circles (TREC) levels, a by-product of T cell maturation, and thus a marker of both thymic function and the production of newly formed T cells8. Since the thymus is invariably dysfunctional in SCID, the use of TREC detection in blood from Guthrie spots serves as an ideal screening tool. Most but not all cases of SCID are detected by TREC measurement, but many types of T cell immunodeficiencies are not7,9. All forms of profound T cell immunodeficiencies require definitive genetic diagnosis for ideal patient management.
Mature T cells are derived from multipotent hematopoietic stem cells in the bone marrow that undergo further maturation in the thymus (hence immature T cells are called thymocytes), where they rearrange T cell receptor (TCR) gene segments to form a diverse antigen recognition repertoire, and are finally subjected to negative selection against self-antigen recognition (Fig. 1). Two distinct T cell lineages are formed in the thymus, the predominant αβ lineage and the less prevalent γδ lineage, characterized by different types of TCR. αβ lineage cells further differentiate into subtypes characterized by distinct TCR co-receptors: CD4+ “helper”, which stimulate B cells towards specific antibody production, and CD8+ “cytotoxic”, which trigger apoptosis of cells presenting non-self antigens such as upon viral infection. While αβ T cells recognize peptide antigens presented by major histocompatibility complex (MHC) molecules, γδ T cells directly recognize a more specialized set of antigens (including microbial or stress-induced lipids, glycolipids, and phospholipids). In addition, γδ T cells have lower TCR repertoire diversity than αβ, are found predominantly within epithelial and mucosal tissue, and are thus considered to play an intermediate role between innate and adaptive immunity. Both αβ and γδ lineages express CD3 at later differentiation stages, but the γδ lineage cells lack expression of CD4 alongside absent or low CD81.

Bone marrow derived lymphoid progenitor cells (CD4-CD8- double negative, DN) first enter the thymus from the corticomedullary junction region and migrate towards the outer cortex where differention from stages DN1 to DN4 take place. At the DN3 stage, cells expressing TCRβ chain genes continue to develop as αβ lineage cells and later express pTCRα which is needed for development of a diverse TCR repertoire and progression to CD4+CD8+ double positive (DP) thymocytes. The cells next undergo positive and negative selection, where interaction with peptide-MHC complexes triggers the enrichment of those that are potentially reactive to foreign antigens. Thymocytes that have been positively selected proceed to differentiate into CD4+ or CD8+ single positive (SP) cells and migrate to the medulla and achieve central tolerance, before export to the periphery. Notably, cells lacking the TCRβ chain at the DN3 stage, instead expressing TCRγ and TCRδ genes, are exported to the periphery as γδ lineage T cells. Aberrations in PTCRA resulting in loss of pTCRα expression leads to reduced αβ lineage T cells and increased γδ T cell populations. Schematic was prepared using Canva.
Immature thymocytes that successfully rearrange the TCR γ and δ chains (TRG and TRD loci) and assemble a functional γδ TCR can commit to the γδ lineage, whereas in frame rearrangement of TCRβ in the same cell allows the generation of a pre-TCR complex (pre-TCRα−TCRβ), driving the thymocyte towards an αβ lineage fate10,11. Notably, the αβ lineage starts by rearranging the gene segments encoding the TCRβ chain, while expressing a surrogate pre-TCRα chain (pTCRα), allowing the expression on the cell surface of a stable pre-T cell receptor and forming a functional (and ligand-independent) signaling complex with CD3. The pTCRα chain is encoded by the PTCRA gene12. The role of PTCRA in humans has recently been explored in several patients with partial or complete pTCRα ablation due to genetic aberations13. Most patients had nil or mild significant infections while some exhibited autoimmune features.
Using whole genome sequencing (WGS), we achieved a molecular diagnosis of a newly described immunodeficiency caused by aberrations in the PTCRA gene.
Results
Case presentation
The patient, a 3-year-old female, was first identified during NBS for SCID, with undetectable TREC levels (normal >75; repeat TREC: 21). She was born at term after an uncomplicated pregnancy to consanguineous parents of Iranian descent. Her father suffered recurrent ear infections during childhood and mother had recurrent sinusitis.
Physical examination revealed small size lymph nodes in the neck and groin while chest ultrasound confirmed the presence of a thymus gland. From 3 months of age she developed mild facial dermatitis. She has had several episodes of upper respiratory infection that rapidly and completely resolved. She also tolerated well live attenuated vaccines. She remains well and her growth and development are appropriate for age. Initial laboratory evaluation revealed profound lymphopenia consistent with significant T cell deficiency (Table 1). As part of a diagnostic algorithm we have performed genetic analysis in order to obtain a definitive diagnosis.
Variant identification by whole genome sequencing
Clinical targeted PID gene panel testing and clinical whole exome sequencing both failed to identify an underlying cause. The family was subsequently offered research based WGS with parental consent (REB study 1000005598). The patient and her parent’s DNA were processed for WGS on the Illumina NovaSeq6000 platform with PCR-free library preparation targeting 46-52x coverage.
SNV/indels were called using a pipeline based on BWA MEM14 and GATK Haplotype caller15, whereas copy number variants (CNVs) were called using a pipeline16 based on ERDS17 and CNVnator18. Both pipelines were based on the b37 genome reference.
Variant prioritization was conducted following a workflow that was previously described19,20. First, we considered substitutions and small insertion/deletion (indel) variants that were rare (frequency <5% based on gnomAD v2.1.1) and that impacted exonic sequence directly, or that could impact it indirectly by altering splicing or other regulatory sequences. We then sorted rare variants into five groups based on mode of inheritance (homozygous, X-linked, potentially compound heterozygous, dominant, and potentially dominant constrained genes), prioritizing genes implicated in primary immunodeficiency (PID, 400 genes) or predicted to have potential implication in PID (2402 additional genes at a 80% recall cutoff). Inheritance patterns from the parents were additionally considered. Five homozygous variants (excluding the X chromosome) were heterozygous in both parents, had gnomAD allele frequency below 5% and no homozygous allele in gnomAD. Two were discarded because they overlapped multiple dbSNP entries, indicating a region with variable or unreliable variant calling. The remaining three variants were all non-coding and impacted genes without an immune function or phenotype consistent with the proband’s (STAM2, MARCHF7, XIRP2-AS1) (Supplementary Dataset 1). Homozygous X-linked variants were not consistent with the proband being female and both parents unaffected. Only one variant set was deemed compound heterozygous and had both alleles not occurring as homozygous in gnomAD and not overlapping multiple dbSNP entries; however, the corresponding gene (ECSIT) lacked an immune function or phenotype consistent with the patient’s (Supplementary Dataset 1). Four variants were heterozygous in dominant genes and did not appear in gnomAD or in the parents; however, none occurred in a gene (GJC2, HNRNPDL, HLA-DRB1) with immune function or phenotype consistent with the proband’s (Supplementary Dataset 1). Three variants were heterozygous in constrained genes (as defined by gnomAD’s observed/expected ratio for loss-of-function or missense variation) and did not appear in gnomAD or in the parents; however, none occurred in a gene (C7orf26, MLLT1, GGT7) with immune function or phenotype consistent with the proband’s (Supplementary Dataset 1). Low-quality variants and variants with higher frequencies were also inspected, but no candidate was found. In conclusion, no rare substitutions or small indel provided an explanation of the patients’ immune condition.
Rare CNVs of size ≥1 kb were prioritized based on frequency, inheritance pattern, gene impact, and gene annotations: of 7 rare deletions and duplications that impacted the exon of a gene (including the untranslated region), all were inherited from either or both parents. Further restricting to variants with copy number 0 (i.e. homozygous deletions) or 4 (i.e. homozygous duplications) and inherited from both parents, resulted in a single 8,043 bp homozygous deletion impacting the first exon of the gene PTCRA (NM_138296.3), with b37 coordinates chr6:42878456-42886498 in both proband and parents, and with copy number 1 in both parents (Supplementary Dataset 2). The variant removes the core promoter, the transcription start site, the translation start site and subsequent protein sequence encoded by the first exon of PTCRA, thus very likely resulting in complete loss-of-function (Fig. 2A). Inspection of the read alignments (CRAM file) suggested that the coordinates are accurate and read depth is consistent with the expected segregation pattern in the nuclear family (i.e. heterozygous deletion in the parents, homozygous in the proband). Based on a 50% reciprocal overlap cutoff, this variant is observed at very low frequency in over 2,500 unrelated parents of autism probands, sequenced by an Illumina platform and with CNV calls based on the same read depth pipeline (allele frequency <0.001)21. In gnomAD SV v2.1 (14,891 subjects)22, it overlaps with one larger ultra-rare deletion (b37 chr6:42878009-42892445, 14.4 kb, allele frequency 5.20e–5) and one smaller ultra-rare deletion (b37 chr6:42882864-42885243, 2.38 kb, allele frequency 4.60e–5), both disrupting the first PTCRA exon in a similar way (Supplementary Fig. S1). Variant calling and prioritization was also conducted based on an updated pipeline based on DRAGEN Bio-IT Platform v3.8.4 and the b38 genome reference, reaching the same conclusions (detailed results are omitted).
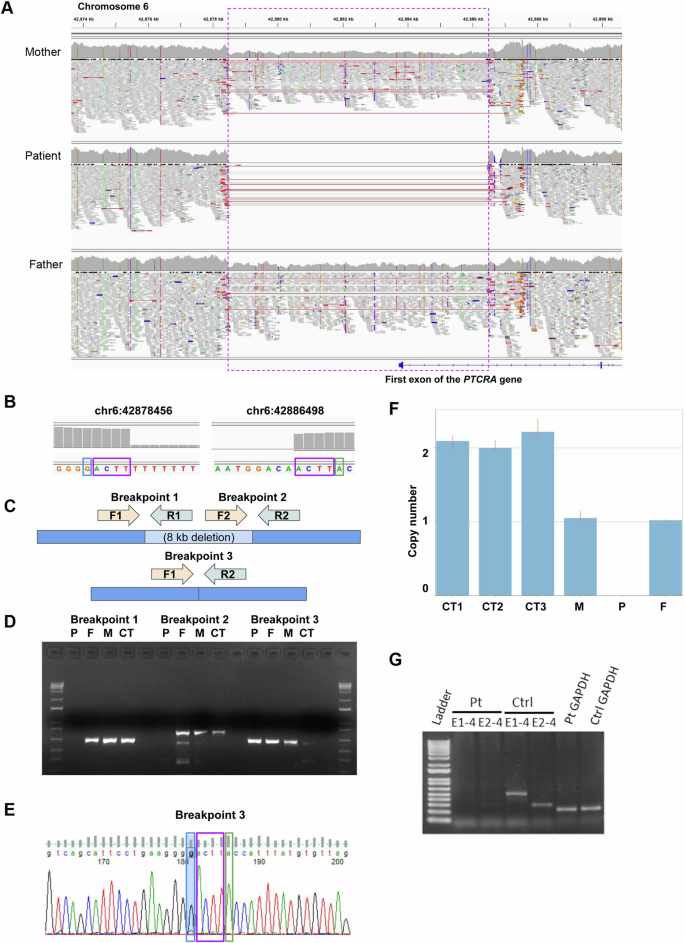
A Read alignments for the proband and unaffected parents were visualized using the Integrative Genomics Viewer40. The purple dashed box indicates the deleted region (heterozygous in the parents and homozygous in the proband); red lines indicate paired-end reads with abnormally large insert size and spanning the deletion junction; vertical colored lines within the read pileups indicate substitutions. B Read depth based on genome sequencing read alignment, with the coordinates of the first base with the drop in sequence depth corresponding to the deletion, incorrectly suggesting that the ACTT microhomology sequence (purple box) is not deleted at either deletion breakpoint. C PCR primer design. D PCR gel demonstrating that the non-reference junction introduced by the deletion (breakpoint 3) is present both in the patient (P) and the parents (F, M), but not in an unrelated control sample (CT), whereas the reference junctions (breakpoint 1 and 2) are present in the parents and the unrelated control sample, but not in the proband. E Sanger sequencing of breakpoint 3 in the proband, revealing that the accurate b37 deletion coordinates are either chr6:42878452–42886498 or chr6:42878456–42886502. F qPCR results confirming that unrelated controls have copy number 2 at the deletion locus, whereas the parents have copy number 1 and the proband has copy number 0. G PCR amplification of PTCRA between exons 1–4 (E1–4), and exons 2–4 (E2–4) from patient and control peripheral blood lymphocytes confirmed the loss of functional PTCRA RNA expression.
Taken together, we identified a novel 8kb homozygous deletion inherited from the unaffected parents that is very rare in reference populations and very likely results in complete loss-of-function of the gene PTCRA, which is highly consistent with the proband’s phenotype. The mutation was confirmed in a clinical laboratory (Fulgent Genetics).
Variant validation and family segregation analysis
We performed several follow-up experiments to demonstrate the presence of the deletion and its correct segregation in the family (Fig. 2B–G). First, we performed genomic DNA PCR, demonstrating that the non-reference junction introduced by the deletion is present both in the proband and the parents, but not in an unrelated control sample, whereas the reference junctions are present in the parents and the unrelated control sample, but not in the proband (see Fig. 2C, D). Then, we confirmed the sequence of the PCR-amplified junction by Sanger sequencing: whereas genome read alignments suggested that the deletion has coordinates b37 chr6:42878456-42886498 and does not remove the ACTT microhomology sequence at either end (Fig. 2B), Sanger sequencing showed deletion of one of the two ACTT sequences (Fig. 2E), thus the correct coordinates are either chr6:42878452–42886498 or chr6:42878456-42886502. Finally, we performed qPCR, confirming that unrelated controls have copy number 2 at the deletion locus, whereas the parents have copy number 1 and the proband has copy number 0 (Fig. 2F).
PCR amplification of PTCRA RNA between exons 1-4 (E1-4), and exons 2-4 (E2–4) from patient and control peripheral blood lymphocytes confirmed the loss of PTCRA RNA expression (Fig. 2G).
Impact of PTCRA–/– on the immune system
Initial immune evaluations demonstrated reduced CD3+ T cells including both CD4+ and CD8+ T cell subsets (Fig. 3A–C). At 1 month of age, recent thymic emigrants (CD3+CD4+CD45RA+CD31+ cells) were low (0.29 × 10⁹ cells/L; ref range: 1.0–4.90 × 10⁹ cells/L). Together with the reduced TREC levels, these findings indicated markedly reduced thymic production and output of T cells. Despite significant lymphopenia, in vitro responses to the mitogen phytohemagglutinin (PHA) were within normal range (stimulation index (SI): 592-2362, Control SI: 1448-2652). B cells, NK cells, and neutrophils were also normal, while monocytes were normal/borderline low (Fig. 3D–G). TCR repertoire assessed by flow cytometry revealed skewed Vβ family representations in both CD4+ (Fig. 3H, upper) and CD8+ (Fig. 3H, lower) subgroups.
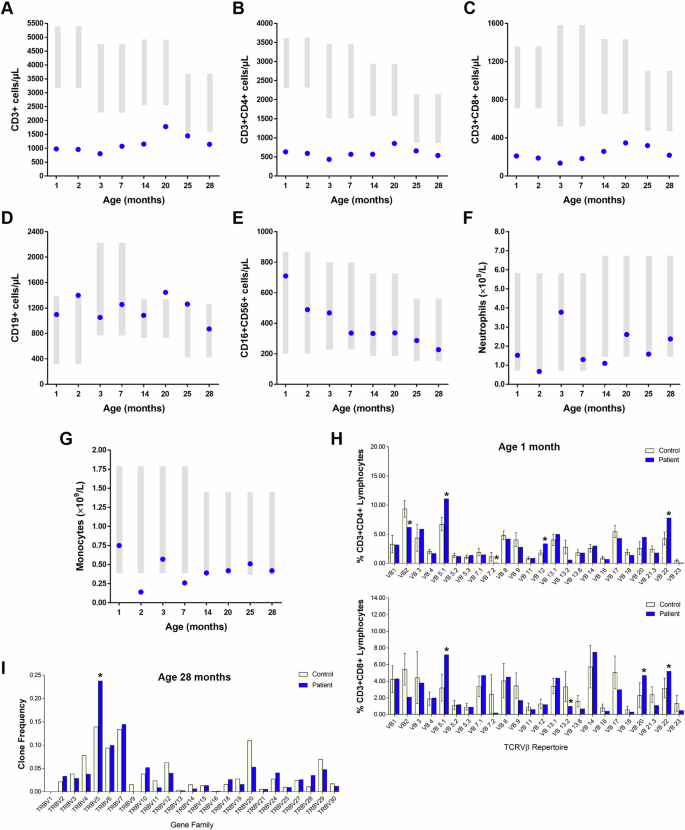
A Total CD3+ cells, (B) CD3+CD4+ cells and (C) CD3+CD8+ cells remained low since birth, while (D) CD19+ B cells, (E) CD16+CD56+ NK cells, and (F) neutrophils were within normal range. G Monocytes were within low to normal ranges. Gray bars represent age-matched reference ranges. H upper Flow analysis of TCRVβ repertoire at age 1 month revealed CD4 Vβ 2, 7, 13.6, and 23 were under-represented while Vβ 5.1, 12, 20, and 22 were over-represented (upper). H lower CD8 Vβ 2, 9, 13.2, 13.6, and 21.3 were under represented while Vβ 5.1, 20, and 22 were over-represented (lower). I Profiling of the T cell receptor β variable (TRBV) genes by sequencing analysis at age 28 months revealed similar gene usage in the patient and control.
Over time the number of T cells increased somewhat until the age of 20 months but subsequently declined. By 2 years of age, the number of circulating CD19+ B cells remained consistently normal or borderline high. Serum IgG, IgA, and IgM levels were within normal range, as were antibody titers in response to vaccination with diphtheria toxoid and tetanus toxoid (anti-diphtheria toxoid—0.84 IU/mL; anti-tetanus toxoid—1.66 IU/mL).
The absence of pre-TCRα prompted in depth analyses of T cell subsets in our patient. At age 28 months, both her CD4+ and CD8+ T cell numbers remained low (Fig. 4A, Table 1). Notably, double negative CD3+CD4-CD8- and CD4-CD8low populations were significantly expanded and determined to be γδ T cells (detailed below). Profiling of TRBV gene family usage by sequencing analysis revealed near complete normalization of her TCRVβ repertoire over time (Fig. 3I). Anti-CD3 responses were somewhat suboptimal (data not shown) but restored in the presence of CD28 co-stimulation, suggesting atypical TCR/CD3 signaling.
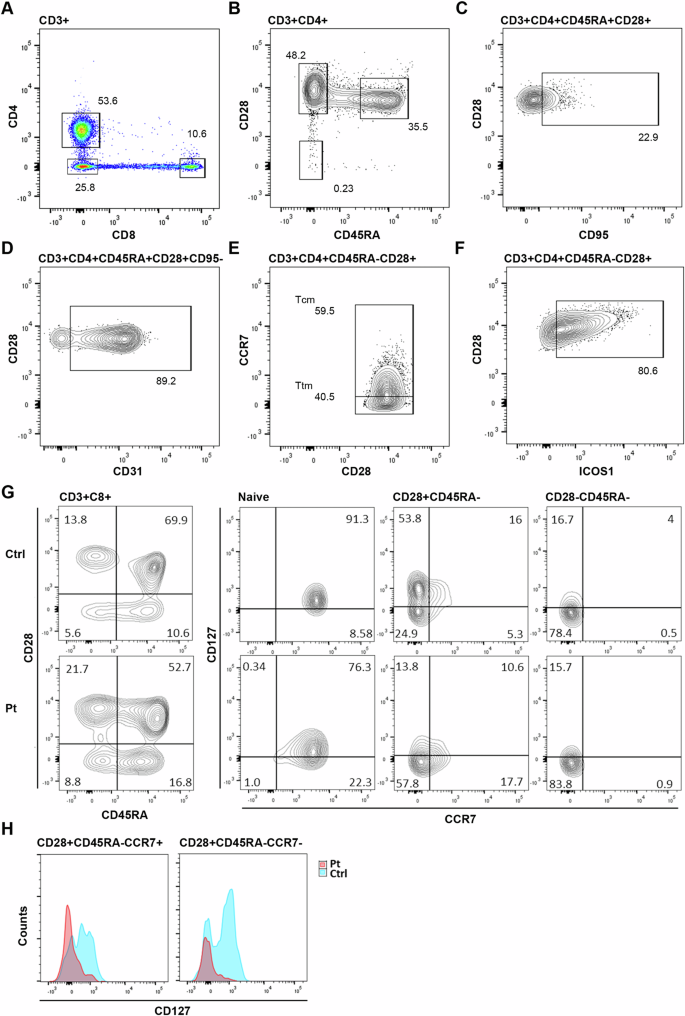
A Patient CD8+ T cell numbers are relatively reduced compared to CD4+, resulting in a CD4:CD8 ratio of 4.5-5:1. B The CD4+ T cell CD45RA+CD28+ naive cell population is significantly low for age. C Increased CD45RA+CD28+CD95+ stem like T cells, but (D) normal CD31 expression by naive cells. E Maintenance of CCR7+ central memory (Tcm) and CCR7- transitional memory (Ttm) subpopulations. F High levels of ICOS-1 expression by CD4+ memory T cells. G Expression of IL-7R (CD127) was reduced in patient CD8+ cells, particularly within the CD45RA- memory T cell populations, including CCR7+ central and CCR7- transitional memory subsets (H).
Flow analysis revealed a disproportionate loss of naive cells from the CD4+ population (Fig. 4B–F). Only 35% of cells retained a naive phenotype and CD31+ recent thymic emigrants comprised only 29% of CD4+ T cells (147 cells/µL; ref range: 190–2600 cells/µL). Self-renewing multipotent CD95+ stem cell-like memory T cells were expanded within the naive population (22%), leaving only 116 cells/µL of true naive cells.
All major CD8+ subsets were present albeit reduced. PTCRA knockout mice show no bias against CD8+ single positive thymocyte selection10,11, however, our analysis revealed loss of IL-7 receptor expression (IL-7Rα, CD127) in patient CD8+ T cells that may be responsible for limiting cell survival and persistence. IL-7 is critical for the generation and maintenance of CD8+ memory12,23 and naive cells demonstrate high levels of IL-7Rα expression which gradually decreases during differentiation. In our patient, co-analysis of CD127 and CCR7 showed prematurely reduced expression on naive cells, but more critically, accelerated loss of CD127 within the memory compartment, with 80% of central memory no longer demonstrating expression (Fig. 4G, H). Reduced responsiveness to IL-7 is likely to limit CD8+ memory T cell survival, contributing to the preferential loss of CD8+ T cells seen in the patient. Deficiencies in effector memory was reflected in a near absence of subpopulations expressing chemokine receptors CCR5 or CCR6 (Supplementary Fig. S2). No similar CD127 expression defect was seen in CD4+ T cells (Supplementary Fig. S3).
TCRγδ T cell numbers were significantly elevated (343 cells/µL—30% of CD3+ T cells; ref range: 2–3%24). This was not primarily due to an increase in the dominant circulating γδ+ T cell population (typically Vγ9δ2), but rather, emergence of a large population determined to be 75% Vδ1+, with the remainder Vδ1-Vδ2- (Fig. 5A, B). Vδ1+ cells were primarily CD4-CD8- (85%), and in total representing 45% of γδ T cells (Supplementary Fig. S4).
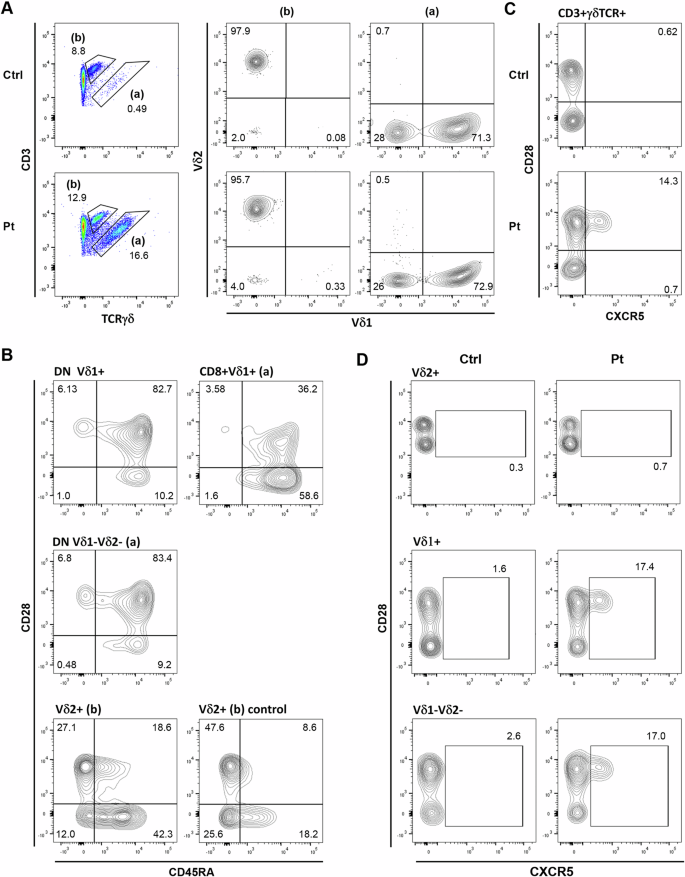
A Vδ1+ and Vδ1-Vδ2- γδ T cell populations were expanded in the patient. B Patient CD4-CD8- DN Vδ1+ and Vδ1-Vδ2- populations demonstrate a primarily naive phenotype, while CD8lo/int subsets are mostly CD28-CD45RA+. Patient Vδ2+ cells appear antigen-experienced like normal controls. C CXCR5 expression on control and patient γδ T cells. D CXCR5 is selectively expressed by a subset of the Vδ1+ and Vδ1-Vδ2- γδ T cell populations.
Expanded CD4-CD8- Vδ1+ and Vδ1-Vδ2- populations were primarily CD28+CD45RA+ (82–83%) (Fig. 5B), of which 80-85% were CD127+CD27+ (Supplementary Fig. S5), consistent with a naive phenotype.
Atypical CXCR5+ Tfh-like γδ T cells were prominent within the patient γδ T cell population (14%) (Fig. 5C, D), primarily Vδ1+, although also present within the Vδ1-Vδ2-, but not Vδ2+, subpopulation. CXCR5+ γδ T cells were evident in healthy controls, but only rarely. Patient CXCR5+ γδ T cells were CD45RA+CD28+CD127+/- and 75% CD196-CD194-CD183+ (not shown), suggestive of a Th1-like phenotype. TCRγδ+CXCR5+ cells have been shown to present antigens, as well as initiating Tfh differentiation25,26.
Discussion
Genetic diagnosis in patients with PID is a critical step towards a definitive diagnosis as well as management. This is particularly important in cases with profound T cell immunodeficiency such as SCID and combined immunodeficies (CID)20,27. Major treatment decisions such as whether to proceed with haematopoietic stem cell transplantation and even the regimen of chemotherapy conditioning in preparation for this procedure are ideally guided by the genetic diagnosis. Thymus transplantation or gene therapy as curative modalities are also dependent on definitive diagnosis. Moreover, precise genetic diagnosis allows for the use of highly selective biologicals such as abatacept in CTLA4 and LRBA deficiency, or leniolisib in the case of activated phosphoinositide 3-kinase delta syndrome.
Clinical targeted PID panels are effective in detecting some but not all genetic pathogenic variants. Frequently, research tools such as WES and/or WGS identify variants missed by standard clinical panels. The PTCRA variant described here was missed by a clinical panel and WES but trio WGS revealed a homozygous 8kb deletion. The deletion removes the PTCRA first exon, including the transcription start site, preventing generation of a PTCRA transcript. This variant could not be detected by clinical genotyping or genome hybridization arrays. Indeed, based on probe coverage reported by the DGV28, this deletion cannot be detected by Affymetrix CytoScan HD, with 5 probes overlapping the deleted region29, or other genotyping or genome hybridization arrays (Agilent 244k, Affymetrix SNP Array 5.0, Affymetrix SNP Array 6.0, Illumina HumanHap 300, Illumina HumanHap 550, Illumina Human 610 Quad, Illumina HumanHap 650Y, Illumina Human 660 W, Illumina HumanHap 1 M: 0-3 probes overlapping the deleted region) (Supplementary Fig. S6). Based on the current consesus, reliable detection of CNVs from WES can be accomplished when CNVs span at least three exons30, thus this type of deletion would not be reliably detectable either. The variant was validated by PCR and Sanger sequencing and correctly segregated in the nuclear family. The variant was also validated in a clinical laboratory (Fulgent Genetics).
PTCRA plays a critical role in the differentiation of αβ T cells, by encoding the pTCRα chain, which forms a functional signaling complex with the rearranged β chain prior to TCRα gene segment rearrangement. Patients with PTCRA deficiency were very recently reported to carry pathogenic variants in a homozygous or compound heterozygous configuration that predicted loss-of-function. Most cases were asymptomatic but some had infection, lymphoproliferation, and autoimmunity. Consistently, these patients had increased γδ T cells and low αβ T cells which improved with age, in addition to skewed repertoire13.
We have performed extensive evaluation of the immune system, expanding existing knowledge. Our patient was diagnosed after birth with profound T cell deficiency based on severe lymphopenia and reduced TRECs indicating an arrest or attenuation of T cell maturation in the thymus. This notion was supported by the paucity of naïve T cells, the diminished numbers of recent thymic emigrants and the depleted T cell repertoire at first evaluation at the age of 2 months. Assessment at 28 months of age demonstrated a remarkable recovery of the variety of TCRαβ repertoire to near normal, as seen in controls. However, flow cytometry analysis revealed a marked loss of naïve cells from the CD4+ population indicating a consistent low thymic output. In addition, CD8+ T cells were reduced and demonstrated a loss of IL-7 receptor expression. IL-7 is critical for the generation and maintenance of CD8+ memory12,23. Reduced responsiveness to IL-7 is likely to limit CD8+ memory T cell survival leading to reduction in CD8+ cells and potentially increasing susceptibility to infections.
While the development of TCRαβ+ T cells appeared hindered in the patient, TCRγδ+ populations were significantly expanded. TRG and TRD gene rearrangements initiate at an earlier stage than TRB, with developmental stage-specific enhancers for TRG and TRD activating germline transcription and gene recombination. However, subsequent successful rearrangement of a TCRβ chain, followed by signaling in association with pTCRα, inhibits further γδ rearrangements and silences their expression. In the absence of pTCRα, TCRβ chains appear reliant on expression of prematurely rearranged TCRα chains, which occurs in only a small percentage of cells. Thus, successful γδ gene rearrangements in the absence of pTCRα expression are more likely to result in the production of a mature γδ T cell than normal.
The selective expansions observed in CD4-CD8- Vδ1+ and Vδ1-Vδ2- populations appear to reflect proportionate rescue of successful γδ rearranged late-development thymocyte populations in the absence of competing TCRβ selection. Despite Vδ2+ γδ T cell predominance in peripheral blood, Vδ2+ thymocytes are rare in the post-natal thymus. In contrast, Vδ1+ thymocytes are generated from mid-gestation onward and represent the dominant γδ thymocyte population throughout late fetal, post-natal and adult life, although only a minor constituent of the peripheral blood γδ T cell population following birth. Similarly, Vδ1-Vδ2- T cells are relatively abundant in late-fetal and neonatal blood and thought to arise around birth10. Thus, γδ rearranged late-development thymocyte populations appear to be the source of the Vδ T cell expansions observed in the patient, rather than specific promotion of a particular γδ subset.
These immune abnormalities, including the reduced T regulatory cells, render patients with PTCRA deficiency more susceptible to infections as well as a greater likelihood of developing autoimmunity.
This report demonstrates, once again, that WGS can be effectively used to detect copy number variants (CNVs) and other structural variants that would be missed by exome sequencing or by genotyping or genome hybridization arrays. Coupled to periodic reassessment for genes newly implicated in disease or with increased supportive functional evidence, this offers a tremendous opportunity to identify a molecular diagnosis for otherwise unresolved cases20,30,31.
Methods
Patient records
Patient data was compiled from medical records and entered into the Canadian Center for Primary Immunodeficiency Registry and Tissue Bank, which has been approved by the SickKids Research Ethics board (protocol no. 1000005598). Written informed consent was obtained from the patient (parental consent) and her parents for participation in this study, including genetic testing (WGS analysis), and publication of the findings. All studies were carried out in accordance with The Code of Ethics of the World Medical Association (Declaration of Helsinki).
Whole genome sequencing
TrueSeq PCR free libraries were made and samples were sequenced on the Illumina NovaSeq6000 platform. Average autosomal coverage was between 46-52X. Illumina provided software bcl2fastq2 (v2.20) was used to convert the per-cycle BCL basecall files generated by the Illumina NovaSeq 6000 Sequencing system to standard primary sequencing output in FASTQ format. During the conversion step, demultiplexing of samples was performed and QC metrics were computed to assess the sequencing quality.
Whole genome read alignment and variant calling
Reads were mapped to the b37 reference sequence using the BWA-MEM algorithm v.07.1214. Single nucleotide substitutions (SNVs) and small indel variants were called using HaplotypeCaller (GATK 3.7)15 following GATK Best Practices. CNVs, comprising losses and gains with size ≥1 kb, were called using a pipeline16 based on the read depth callers ERDS17 and CNVnator18. Gains with size 1–5 kb supported only by ERDS were included.
Variant annotation and prioritization
Variant prioritization was conducted following a workflow that was previously described19,20.
For substitutions and small indels, variants were defined as 5% rare when they had allele frequency ≤ 5% in all gnomAD 2.1.1 ethnic populations32.
Annovar33 was used to determine the variant effect on coding and non-coding genes, using the RefSeq database (Annovar refGene database). We initially selected 5% rare variants impacting coding exons, non-coding exons, 5ʹ or 3ʹ UTRs, regions 1 kb upstream of transcription starts site or 1 kb downstream of transcription end site, variants within 100 bp of a splice site or predicted to alter splicing by Spidex (absolute dPSI > 2)34, dbscSNV (ADA or RF score > 0.6)35, or SpliceAI36. When considering specific modes of inheritance, coding and splicing variants were further prioritized based on their impact scores37,38,39. Constrained genes were defined as having gnomAD observed/expected LOF variants < 0.25 or observed/expected missense variants < 0.7 (where LOF indicates variants predicted to result in complete loss-of-function)32.
For CNVs, high-quality CNVs16, including gains with size 1–5 kb supported only by ERDS, were deemed rare if they had frequency <1% with respect to CNVs with >50% reciprocal overlap detected in parents of individuals with autism spectrum disorder in the MSSNG whole-genome sequencing project and sequenced by HiSeq 2000 or HiSeq X21.
Variant validation and segregation
The following primers were designed to amplify the sequence spanning the region of interest to capture potential breakpoints and deletion: PTCRA-F1-brpt1: 5ʹ-GCAGAGACCAATAAATGGTTCTG-3ʹ (hg19/b37 coordinates chr6:42,878,248-42,878,270); PTCRA-R1-brpt1: 5ʹ-GCTCACGCTAATTGATACCTCC-3ʹ (hg19/b37 coordinates chr6:42,878,856-42,878,877); PTCRA-F2-brpt2: 5ʹ-GAATGAGTCAGGAGTCACGC-3ʹ (hg19/b37 coordinates chr6:42886347-42886366); PTCRA-R2-brpt2: 5ʹ-CAGGGAAGGAGGCCAGA-3ʹ (hg19/b37 coordinates chr6: 42887101-42887117). The PCR reaction was run using 20 ng of genomic DNA per sample in a 20 μl PCR reaction, with Qiagen HotStarTaq polymerase. Samples were run for 15 min at 95 °C (initial denaturation); followed by 35 cycles of (1) 30 s at 95 °C (denaturation), (2) 30 s at 60 °C (annealing), (3) 50 s at 72 °C (extension); followed by 10 min at 72 °C (final extension). The PCR product was visualized on a 2% agarose gel. Sanger sequencing was performed by The Center for Applied Genomics (TCAG) (Toronto, ON) using standard procedures. The sequences were visualized using FinchTV Version 1.4.0, and were manually compared with the reference genome to determine the presence of the deletion.
qPCR with a TaqMan assay was used to determine copy number within the region of interest, specifically using the probe Hs01227408_cn (hg19/b37 probe coordinate chr6:42883852 on b37, overlaps exon 1 – intron 1, https://www.thermofisher.com/order/genome-database/details/cnv/Hs01227408_cn?CID=&ICID=&subtype=). The TaqMan copy number reference assay based on human RNase P was used as an endogenous control for calibration. The assay was performed with one biological replicate per subject, four technical replicates per subject. Results were analyzed using CopyCaller Version 2.1.
RNA was extracted from peripheral blood lymphocytes using the Qiagen RNeasy plus Mini Kit (cat# 74134). 500 ng of RNA was used to synthesize cDNA using Superscript IV Vilo master mix (Invitrogen cat# 11756050) and 100 ng of cDNA from the patient and control, was used for PCR of PTCRA using the following primer pairs: Exon 1 to Exon 4 (Ex1-4) fwd 5ʹ -CCGGTACATGGCTGCTACTT-3ʹ, Ex1-4 rev, 5ʹ -AGGTCAGGAGCAGGTCAAAC- 3ʹ and Exon 2 to Exon 4 (Ex2-4) fwd 5ʹ -CTGGATGCCTTCACCTATGG- 3ʹ, (Ex2-4) rev 5ʹ -AGGTCAGGAGCAGGTCAAAC-3ʹ. GAPDH PCR using cDNA from the patient and control was used as an internal control for the cDNA. Initial denaturation was set at 96 °C for 2 min. Conditions for template amplification are as follows: 94 °C for 30 s, 56 °C for 30 s, 68 °C for 1 min; 29 cycles. Final Extension was set at 68 °C for 5 min, and then lowered to 10 °C indefinitely. Original gel images are provided in Supplementary Fig. S8.
TRVB gene usage profiling
Profiling of TRVB gene usage was performed using the NEBNext Immune Sequencing kit (New England Biolabs), and analysed by adaptive immune receptor repertoire (AIRR) analysis. Briefly, SMART-seq data analysis was run using the airrflow pipeline (https://nf-co.re/airrflow) which allows processing of bulk TCR sequencing data including V(D)J assignment, clonotyping, lineage reconstruction, and repertoire analysis. Quality of the sequencing data (FASTQ format) was assessed using Fastp v.0.23.4. All stages of raw sequence processing was performed by pRESTO (v.0.7.1), including quality control, primer masking, annotation of reads with sequence embedded barcodes, generation of unique molecule identifier (UMI) consensus sequences, assembly of paired-end reads, and identification of duplicate sequences. The final set of unique sequences represented by at least 2 reads was filtered and serves as input to the V(D)J reference aligner. For V(D)J annotation, gene segments are assigned with IgBlast (v.1.19.0) using the IMGT database with the Change-O toolkit (v.1.3.0) which facilitates the advanced analysis of immunoglobulin sequences following germline segment assignment. Duplicate DNA sequences were identified and removed using enchantR (v.0.1.9). The threshold for clonal definition was identified using enchantR (v.0.1.9). Appropriate distance threshold to determine clonal relationships was performed on ShazaM, while clonal assignment was performed with scoper (v.1.3.0). Identification of the V(D)J germline sequences from which each of the observed sequences is derived was performed with dowser (v.2.0.0). The reconstructed germlines were used in downstream analysis to infer somatic mutations and reconstruct lineages. The clonal inference and basic clonal repertoire analysis was generated by Alakazam (v.1.3.0).
PCR amplification of PTCRA
RNA was extracted from peripheral blood lymphocytes using the Qiagen RNeasy plus Mini Kit (cat# 74134). 500ng of RNA was used to synthesize cDNA using Superscript IV Vilo master mix (Invitrogen cat# 11756050) and 100 ng of cDNA from the patient and control, was used for PCR of PTCRA using the following primer pairs: Exon 1 to Exon 4 (Ex1-4) fwd 5ʹ -CCGGTACATGGCTGCTACTT-3ʹ, Ex1-4 rev 5ʹ -AGGTCAGGAGCAGGTCAAAC- 3ʹ and Exon 2 to Exon 4 (Ex2-4) fwd 5ʹ -CTGGATGCCTTCACCTATGG- 3ʹ, (Ex2-4) rev 5ʹ -AGGTCAGGAGCAGGTCAAAC-3ʹ. GAPDH PCR using cDNA from the patient and control was used as an internal control for the cDNA. Initial denaturation was set at 96 °C for 2 min. Conditions for template amplification are as follows: 94 °C for 30 s, 56 °C for 30 s, 68 °C for 1 min; 29 cycles. Final Extension was set at 68 °C for 5 min, and then lowered to 4 °C indefinitely.
Flow cytometry
Patient and control peripheral blood lymphocytes were prepared by centrifugation on Ficoll-Paque PLUS. Flow cytometry was performed at The SickKids-UHN Flow and Mass Cytometry Facility, Toronto, with funding from the Ontario Institute for Cancer Research, McEwen Center for Regenerative Medicine and the Canada Foundation for Innovation, using a BDB FACSymphony A3 Cell Analyzer. Data was analyzed in FlowJo (BD Biosciences). The gating strategy employed is shown in Supplementary Fig. S7. The following antibodies (BD Bioscences/Thermo Fisher Scientific) were used: CD3-PerCP-Cy5.5 (560835); CD4-BV510 (5629709); CD8-R718 (567345); CD45RA-APC-H7 (560674); CCR7-BV421 (562555); CD127-BV711 (563165); CD95-BB515 (564596); CD25-BUV395 (567483); CD31-PE (12-0319-42); CD183-APC (550967); CD28-APC (559770); ICOS1-PeCy7 (567395); CD196-BV711 (563923); CD194-BV421 (562579); TCRγδ-BV421 (562560); TCRVδ1-PeCy7 (25-5679-41); TCRVδ2-PE (331407); TCRαβ-PE (555548); TCRαβ-RB780 (569139); CCR10-PE (563656); CD185-BB515 (564624); CD56-BV711 (563169); CD27-PE (12-0271-81); CD279-PeCy7 (561272); CD134-APC (563473).
Responses