Stiffness-induced modulation of ERG transcription factor in chronic liver disease

Introduction
Cirrhosis of the liver is the final stage of CLD and is characterized by marked changes in liver structure and function due to extensive fibrosis, parenchymal extinction, and nodular regeneration. A major consequence of cirrhosis is the development of portal hypertension (PH), responsible for its complications and for the need of liver transplantation. LSECs play a crucial role in the development and progression of cirrhosis and PH. Indeed, in response to liver injury and pro-inflammatory stimuli, LSECs become dedifferentiated, acquiring a proinflammatory, profibrotic and coagulation-prone phenotype1,2. Recently, attention has shifted to the important influence of mechanical forces in the progression of CLD and portal hypertension (PH)3. Among these forces, it has been shown that LSECs phenotype can be modulated by increased tissue stiffness, as it is encountered in cirrhosis of the liver. Healthy LSECs exposed to stiff substrates dedifferentiate and become dysfunctional and pseudo-capillarized. In contrast, soft substrates partially ameliorate cirrhotic LSECs dysfunction4. Moreover, increased tissue stiffness impacts the inflammatory response of LSECs by modulating nuclear factor kappa B (NFkB) localization and chemokine ligand 1 (CXCL1) expression5. Studies in other EC types confirmed the link between stiffness and inflammation6,7. At the nuclear level, mechanical forces can influence the expression of transcription factors (TFs) and co-factors8. One such example is Krüppel-like factor 2 (KLF2), which is modulated by shear stress in LSECs and plays a vasoprotective and antifibrotic role during the development of CLD9,10,11,12. Tissue stiffness has also been demonstrated to modulate the localization and activity of transcription cofactors, among which YAP/TAZ13 and MRTF-A14. Whether other endothelial TFs are modulated by mechanical forces in liver injury is so far unexplored. The transcription factor ETS-related gene (ERG) is an endothelial-specific TF in the post-developmental phase that belongs to the ETS family15. Furthermore, it acts as an oncogene in tissues such as the prostate16 and white blood cells17. ERG contributes to the maintenance of vascular homeostasis through its anti-inflammatory18,19,20 and anti-thrombotic21 functions, as well as by maintaining normal endothelial barrier integrity and regulating angiogenesis22,23. Recently, ERG has been involved in lung pathophysiology24,25,26,27 and in liver disease28, where it was shown to prevent endothelial-to-mesenchymal transition during the development of CLD28. Several ERG modulation pathways have been described, such as those related to ubiquitination27,29,30 or miRNAs in prostate cancer or ERG phosphorylation in the endothelium31, however, the mechanisms leading to ERG downregulation in lung or liver disease remain elusive. The aim of this study was to investigate ERG dynamics over the course of CLD, as well as unveil possible mechanisms related to its downregulation.
Results
ERG is a potential mechanosensitive factor involved in advanced chronic liver disease
ERG expression was significantly downregulated in our previously published human healthy vs cirrhotic transcriptomic dataset32, being the most significantly differentially expressed transcription factor (log2FC = −6.68; p-value = 0.005; GSE164799). Indeed, this downregulation was confirmed at the protein level by IF in a small cohort of patients without cirrhosis (n = 11) vs patients with cirrhosis (n = 12) (Fig. 1A, B). Supplementary Table 1 shows demographic characteristics and standard liver tests of the cohort of patients with cirrhosis.

A IF and B corresponding quantification of ERG (green) expression in human healthy and cirrhotic liver tissue from two independent cohorts of patients. CD144 (red) was used as marker for ECs. For each experiment, sample distributions were assessed for normality (Kolmogorov-Smirnov test). Normally distributed data were compared with unpaired Student t test ** = p ≤ 0.01. CD144=cluster of differentiation 144, DAPI = 4′,6-diamidino-2-phenylindole, scale bar = 100 um.
To better understand the possible roles of ERG in ECs, we first took advantage of the ARCHS4 RNA-Seq gene-gene co-expression matrix and identified the top 200 ERG co-expressed genes (full list in Supplementary Table 2). Pathway analysis revealed that ERG-dependent genes are related to processes involved in angiogenesis (P00005) and inflammation (P00031), as previously described in other studies. Interestingly, integrin signaling (P00034) was found among the top represented pathways, suggesting that ERG may be involved in processes related to mechanobiology, as integrins are a crucial part of the mechanoresponsive machinery of cells (Supplementary Table 3). Enrichr-KG analysis of the pre-expanded gene list further suggested a possible involvement of ERG in ECM organization (Fig. 2A, B). Next, to narrow down the question to the role of ERG in ECs, we used two publicly available RNA sequencing databases of ERG knock down in HUVECs, GSE18401 and GSE32984. Gene set enrichment analysis of these two datasets revealed that loss of ERG has a major influence on the upregulation of inflammatory pathways (Fig. 2C, D), as previously described18,20. Moreover, overrepresentation analysis of the differentially expressed genes (DEGs) (FC ± 1.5, p < 0.05) in both datasets similarly revealed ERG involvement in inflammation and in integrin signaling (P00034) (Supplementary Tables 4 and 5). To better understand the possible roles of ERG in CLD, we compared our previously published RNA Sequencing dataset obtained from cirrhotic versus healthy human LSECs (hLSECs) (GSE164799) with the two publicly available datasets of ERG knockdown HUVECs (GSE18401 and GSE32984). DEGs from the three datasets were selected using the thresholds of FC ± 1.5 and p < 0.05 and common DEGs were selected. Comparison with GSE18401 identified 155 (9.81%) common DEGs (Fig. 2E, F) and comparison with GSE32984 identified 49 (3.2%) common DEGs (Supplementary Fig. 1A, B). Functional pathways classification of the common DEGs between hLSECs and GSE18401, revealed integrin signaling (P00034), inflammation (P00036 and P00031) and angiogenesis (P0005 and P00056) among the most represented (Fig. 2G). Moreover, GO pathway analysis classified the common DEGs into pathways involved in angiogenesis and cell adhesion (Fig. 2H). Similarly, common DEGs between hLSECs and GSE32984 also showed involvement in pathways related to inflammation and angiogenesis, confirming the involvement of ERG in these processes during the development of CLD (Supplementary Fig. 1C, D). Overall, these analyses support an important role of ERG in inflammation and angiogenesis, as well as a possible role in pathways related to mechanobiology.
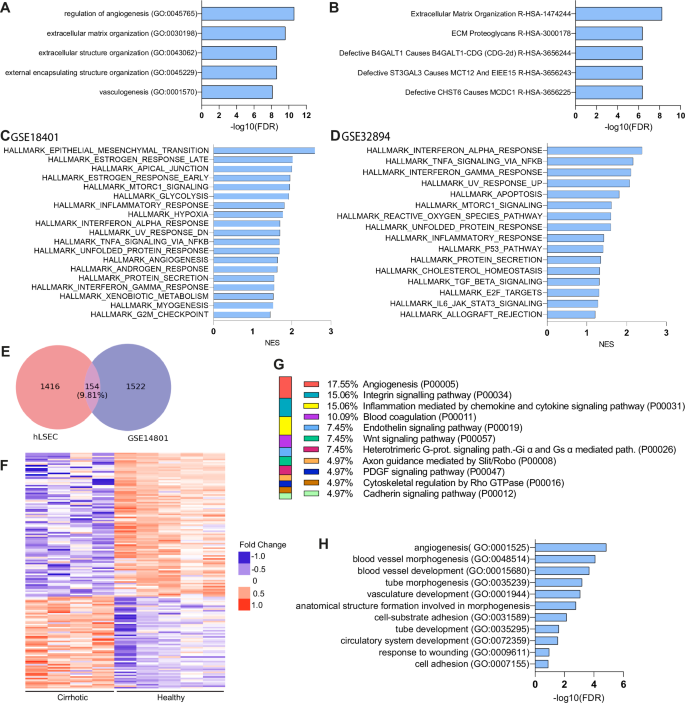
A, B Enrichr-KG analysis of the pre-expanded top 200 ERG co-expressed genes: A Gene Ontology process (GO), B Reactome. C, D Hallmarks obtained by GSEA analysis of HUVEC ERG knock-down databases GSE14801 and GSE32984, respectively. E Venn diagram showing the intersection between hLSEC (GSE164799) and GSE14801. F Heatmap of common DEGs between hLSEC (GSE164799) and GSE14801, as expressed in healthy vs cirrhotic human LSECs. G Panther pathway analysis of the common DEGs. H GO pathway analysis of the common DEGs.
ERG expression is modulated by matrix stiffness and inflammatory stimuli
The possible connection between ERG and mechanobiology was investigated in experiments assessing whether matrix stiffness may contribute to ERG downregulation in CLD. Furthermore, to understand the interplay between substrate stiffness and inflammation on ERG modulation, we assessed the role of IL1β in this context. HUVECs were seeded on collagen-I coated PAA gels of 0.5 and 30 kPa for 72 h and treated with 10 ng/mL IL1β or vehicle for an additional 24 h. Both immunofluorescence and WB demonstrated a significant downregulation of ERG in response to high stiffness (30 kPa) PAA gel (Fig. 3A, B). Moreover, IL1β also resulted in ERG downregulation at 0.5 kPa, but no further downregulation was observed at 30 kPa when compared to the vehicle-treated control (Fig. 3A, B). qRT-PCR did not show differences in ERG mRNA expression neither in response to increased stiffness (Fig. 3C), suggesting the mechanism for the observed ERG downregulation involved a posttranslational degradation, as already described for inflammatory stimuli27. To more precisely address if these alterations are specifically observed in the liver, we assessed the response of freshly isolated rat LSECs to 24 h exposure to increased stiffness. The rationale behind the longer culture time in HUVEC compared to LSECs stands in the fact that cells previously expanded on polystyrene tissue culture plates may require a longer adaptation time to softer substrates, possibly due to stiffness-induced epigenetic changes (as shown in33,34 and by our unpublished observations). In LSECs isolated from healthy livers, ERG protein expression was consistently downregulated when cultured in the 30 kPa PAA substrate (Fig. 3D). Conversely, cirrhotic rat LSECs showed a trend towards recovery of ERG expression when cultured under soft substrate conditions. Of note, the response was of similar magnitude as that observed in healthy rat LSECs on 30 kPa (Fig. 3E).
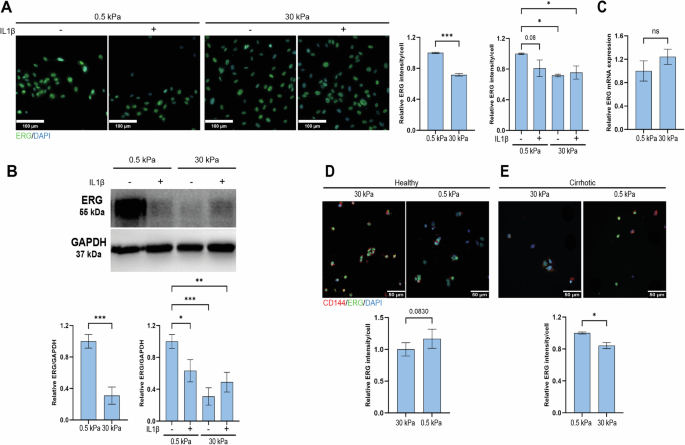
A Representative IF images and quantification of ERG (green) in HUVECs seeded for 72 h on 0.5 vs 30 kPa PAA gels and treated for an additional 24 h with IL1b or vehicle (n = 969 cells from 0.5 kPa, n = 744 cells from 0.5 kPa IL1β, n = 1132 cell from 30 kPa and n = 1133 cells from 30 kPa IL1β, from n = 3 independent experiments). B Representative Western Blot in HUVECs seeded for 72 h on 0.5 vs 30 kPa PAA gels and treated for an additional 24 h with IL1b or vehicle. ERG expression was normalized to GAPDH as housekeeping protein (n = 6 independent experiments – Supplementary Fig. 3). C qRT-PCR of ERG gene in HUVECs seeded for 96 h of 0.5 vs 30 kPa (n = 3 independent experiments). D Representative IF images and quantification of ERG in freshly isolated healthy rat LSECs seeded on 0.5 vs 30 kPa PAA gels for 24 h (n = 120 cells from 0.5 kPa and n = 144 cells from 30 kPa were analysed, from n = 4 rats). E Representative IF images and quantification of ERG in freshly isolated cirrhotic rat LSECs seeded on 0.5 vs 30 kPa PAA gels for 24 h (n = 78 cells from 0.5 kPa and n = 178 cells from 30 kPa were analysed, from n = 3 rats). All IF data were normalized to the number of cells. For each experiment, sample distribution was assessed for normality (Kolmogorov-Smirnov test). Normally distributed data were compared with unpaired Student t test, otherwise with Mann-Whitney test. Data for the stiffness + inflammation comparison were normalized to the 0.5 kPa vehicle condition and analyzed with Ordinary One-way ANOVA, * = p < 0.05; ** = p ≤ 0.01; *** = p ≤ 0.001, scale bar HUVEC = 100 µm, scale bar LSEC = 50 µm.
ERG is downregulated in patients with cirrhosis and in rats with experimental cirrhosis
Due to the fact that ERG is modulated by stiffness and inflammation, we next decided to extend our human study by including a larger cohort of patients with cirrhosis (n = 29) (Table 1) in different disease stages, represented by increasing liver stiffness and increased inflammation: compensated cirrhosis (n = 9), decompensated cirrhosis presenting with 1 decompensation (n = 10) or decompensated cirrhosis presenting with more than 1 decompensation (n = 10). Any of the following clinical events were considered as decompensation: development of ascites, variceal hemorrhage, hepatic encephalopathy, or hepato-renal syndrome. Etiology of cirrhosis was viral in 44% of the patients, followed by autoimmune – AIH, PBC or PSC (28%), ARLD (17%) and MASH (10%). The majority (90%) of the patients had clinically significant portal hypertension, defined by a hepatic vein pressure gradient (HVPG) ≥ 10 mmHg. ERG expression was similar across stages of advanced liver disease (Fig. 4A, B) and its levels were also independent of disease etiology (Fig. 4C). Furthermore, ERG expression did not show a correlation with any of the clinical variables investigated, except for a weak negative correlation with ALT levels (r = -0.37, p = 0.04). There was no correlation between ERG protein levels and in vivo liver stiffness values, as measured by Vibration Controlled Transient Elastography (r = -0.25, p = 0.29).
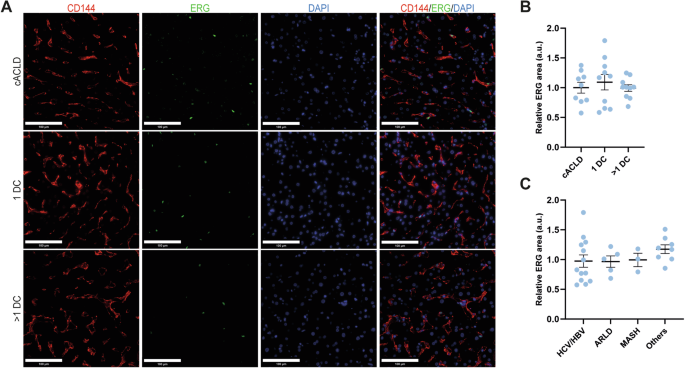
A IF and B corresponding quantification of ERG (green) expression in human healthy and cirrhotic liver tissue from two independent cohorts of patients. CD144 (red) was used as marker for ECs. For each experiment, sample distributions were assessed for normality (Kolmogorov-Smirnov test). Normally distributed data were compared with unpaired Student t test or with Ordinary One-way ANOVA test. Non-significant p-values not displayed. CD144=cluster of differentiation 144, DAPI = 4′,6-diamidino-2-phenylindole, C compensated (disease), DC decompensation, HCV hepatitis C virus, HBV hepatitis B virus, ALD alcohol related liver disease, MASH metabolic dysfunction associated steatohepatitis, others autoimmune hepatitis, primary biliary cholangitis or primary sclerosing cholangitis, scale bar = 100 µm.
We further assessed ERG expression in rat livers during the progression of CCl4-induced cirrhosis at 2 weeks (n = 4), 6 weeks (n = 5), full cirrhosis (n = 5), as well as after 8 weeks of stopping TAA administration (spontaneous regression) (n = 5) and compared it to healthy rat tissue (n = 5). There was no difference in ERG protein expression during progression of the disease before cirrhosis development, and significant but moderate downregulation in the fully cirrhotic stage, compared to the healthy rats. After 8 weeks of spontaneous regression32, ERG expression returned to baseline levels (Supplementary Fig. 2).
Discussion
In this paper, we investigated the ERG transcription factor, which is downregulated in cirrhosis, as previously demonstrated by Dufton et al.28 and confirmed by our transcriptomic and IF data. Following this, we tried to gain a better insight on the possible role of ERG in the pathophysiology of liver disease, by comparing publicly available ERG knock-down transcriptomics datasets with our human healthy vs cirrhosis dataset. Commonly deregulated pathways seem to be involved mostly in pathways related to vascular development and angiogenesis via Notch and Wnt signaling15, which, intrahepatically, are intimately connected to fibrogenic processes in liver pathobiology35,36. Moreover, by pathway analysis, we observed a possible novel relationship between ERG and mechanobiology, since loss of ERG affected genes related to integrin signaling. This connection is in line with previously described involvement of ERG in modulating microtubule dynamics and EC migration22,23. Indeed, we demonstrated both in HUVECs and freshly isolated LSECs that ERG is downregulated in response to increased substrate stiffness, as found in cirrhotic livers. In our study, we confirmed that ERG is regulated by inflammatory stimuli18. This may occur due to the inhibition of NF-κB p65 binding to the promoters of pro-inflammatory genes18,20. Additionally, ERG responds to mechanical forces, such as high and low shear stress, by directly modulating thrombomodulin and indirectly by facilitating chromatin access to Krüppel-like Factor 2 (KLF2), a key regulator of nitric oxide release, to the thrombomodulin promoter21.
It is well known that liver stiffness measurements (LSM) have prognostic value in cirrhosis. This has been particularly well demonstrated using transient elastography, to the point that the recent Baveno guidelines for prognostic stratification include the use of LSM37. In addition, progression, and regression of cirrhosis are paralleled by increasing respectively decreasing LSM values38. The increased liver stiffness in cirrhosis is mainly due to fibrosis, but it is also increased by inflammation39,40. It is worth noting that systemic inflammation is currently thought to play a central role in the pathophysiology of cirrhosis and PH, and that the degree of systemic inflammation correlates with disease severity41,42. Cholestasis and circulatory congestion, if present, also increase liver stiffness43,44,45, showing that LSM can sense different types of mechanical stimuli.
Because of this and considering our in vitro findings demonstrating ERG downregulation in response to both stiffness and inflammation, we then extended our analysis to a larger cohort, including patients in different disease stages. Contrary to what we expected, we could not establish a relationship between disease stage or liver stiffness and degree of ERG downregulation. ALT levels did show a significant inverse correlation with ERG levels, which may indicate a connection between decreased ERG expression and liver inflammation. While in HUVECs increased stiffness showed a marked downregulation on ERG, inflammatory stimuli could significantly downregulate ERG under “healthy-like” stiffness conditions. This may suggest that in chronic liver disease, ERG is initially downregulated by inflammation and then further maintained by the increased stiffness. It is likely that the modulation of ERG in the context of CLD is multifactorial, and there are additional stimuli besides inflammation and stiffness which affect its expression, such as shear stress46 or hypoxia26, which may explain the profound downregulation at the mRNA level found in our transcriptomics dataset. In any case, our findings suggest that ERG downregulation in cirrhosis is a relatively early phenomenon, already maximally expressed in compensated patients, and not enhanced upon development of first or additional clinical decompensations. Furthermore, ERG down-regulation was independent of the etiology of cirrhosis.
Furthermore, we investigated ERG levels in a CCl4 rat model of CLD progression and regression. Previously, Dufton et al. demonstrated that ERG is strongly downregulated in a mouse model of CCl4-induced liver injury, both in the acute and chronic setting28. Surprisingly, our rat model did not display any changes in ERG levels after 2 or 6 weeks of CCl4 administration and only a mild downregulation at the full cirrhotic stage. This may be partly due to the experimental design since our model allows a recovery time of up to 1 week before sacrifice. During this time, the effects of acute inflammation may decrease or disappear and may allow for recovery of ERG expression. Moreover, as evidenced by the in vitro LSECs experiments, rat ECs seem to be less responsive in terms of ERG expression to underlying matrix stiffness as compared to human ECs. Taken together, our observations may suggest yet undescribed protective mechanisms of ERG expression in the rat liver.
Another interesting aspect of ERG biology worth mentioning in the context of cirrhosis is its relationship with epigenetic modifications. It has been shown in the context of lung disease that age- or bleomycin-induced chromatin changes affect ERG-binding loci, modulating endothelial phenotype and response to injury24. It is conceivable that these mechanisms may also play a role in the context of liver disease and mechanobiology, which are both intimately connected to epigenetic modifications.
Some limitations of our study are represented by the lack of in vitro studies using human LSECs, to clearly ascertain the responsiveness of ERG to stiffness and inflammation in another cell type besides HUVECs, which is a regularly used cell type in vascular biology- and ERG-related studies, as well as by the limited number of human samples.
ERG contributes to maintain vascular balance by countering inflammation and modulating angiogenesis in ECs. In this study we demonstrate that cirrhosis, characterized by increased stiffness and inflammation, triggers ERG downregulation. By in vitro experiments, separating stiffness, and inflammatory response, we showed that stiffness appears dominant in driving ERG reduction, while inflammation gains importance under physiological stiffness. This interplay may suggest that inflammation downregulates ERG during the development of CLD, while increased stiffness becomes pivotal as CLD advances towards cirrhosis, regardless of disease etiology. These results enhance understanding of ERG’s role in liver disease, suggesting that modulation of ERG may potentially have beneficial effects in cirrhosis and PH.
Methods
Human samples
Human tissue was obtained from explants or remnants from patients undergoing orthotopic liver transplantation (various etiologies) or surgery for excision of liver metastases or hydatid cysts at the Inselspital Bern (Kantonale Ethikkommission – KEK 2021-01403). Human liver samples from patients with histologically proven cirrhosis in different disease stages (compensated, decompensated with 1 decompensation or decompensated with more than 1 decompensation) were obtained from the “Octavian Fodor” Institute of Gastroenterology and Hepatology”, Cluj-Napoca, Romania (Aviz IRGH nr 5735/2404.2023), from patients undergoing HVPG measurement and transjugular liver biopsy for diagnostic purposes. Biopsies were embedded in paraffin and 3 µm thickness slides were cut. Clinical data associated with liver biopsies was obtained, anonymized, from the informatic database. At the time of liver biopsy, all patients signed informed written consent allowing the use of their tissue and clinical/laboratory data as study material. The study was conducted in accordance with the protocol as approved by the Authorities, the Declaration of Helsinki, good clinical practice (GCP), the Human Research Act (HRA), the Human Research Ordinance (HRO) and all national, state, and local laws of the applicable regulatory agencies.
Animals
Male and female Sprague Dawley rats were kept at the animal facilities of the University of Bern. Male Wistar Han rats were used at the animal facilities of the University of Barcelona Medical School. All animals were maintained in controlled environmental conditions with 12 h light-dark cycles and fed ad libitum with water and standard rodent food. All experiments were approved by the Bern Cantonal Ethics Committee and the Laboratory Animal Care (BE89/2021) and Use Committee of the University of Barcelona and were conducted under the European Community guidelines for the protection of animals used for experimental and other scientific purposes (EEC Directive 86/609).
Induction of liver cirrhosis
Carbon tetrachloride (CCl4) cirrhotic model was induced in male Wistar rats weighing 50–70 g by chronic CCl4 inhalation (thrice per week) whilst receiving 0.3 g/L phenobarbital in the drinking water. Treatment was discontinued after 10 weeks, a timepoint at which animals would have developed cirrhosis, but not ascitic decompensation. This was followed by 1 week of rest period. Thioacetamide (TAA) cirrhotic model was induced in male and female Sprague Dawley rats weighing 250–300 g by injecting 200 mg/kg TAA (Sigma-Aldrich, Ref. No. 172502) i.p. twice a week for 12 weeks, followed by 1 week of rest period.
Liver sinusoidal endothelial cells isolation
LSECs were isolated as previously described. Briefly, rats were anesthetized with ketamine + xylazine + midazolam (80 mg/kg – 10 mg/kg – 5 mg/kg, i.p) and laparotomy was performed. The livers were perfused twice through the portal vein with modified Hanks Balanced Salt Solution and digested with collagenase A (Sigma Aldrich-Roche #COLLA-RO). The resulting liver suspension was filtered through a 100-μm nylon cell strainer into ice-cold Krebs Solution and centrifuged for 5 min at 60 g. The supernatant contained all non-parenchymal cells, while the pellet contained hepatocytes. LSEC and Kupffer cells were separated from HSCs by a three-step OptiPrepTM iodixanol gradient centrifugation (Sigma-Aldrich #D1556) and LSECs were finally separated from KCs by unspecific adhesion. Further details of the isolation procedure can be found in the original publication describing this protocol47.
Polyacrylamide gels
Polyacrylamide gels of 0.5 and 30 kPa were produced as previously described4. Briefly, round coverslips of 12- or 50-mm diameter were treated with an ethanol (Sigma Aldrich #1.00983), acetic acid (Sigma Aldrich #1.00063) and 3- (trimethoxysilyl)propyl methacrylate (Sigma Aldrich-Merck #440159) solution (14:1:1 ratio) for 30 minutes to activate the surfaces. Square coverslips of 22×22- or 60×60-mm were treated with Sigmacote (Sigma Aldrich-Merck #SL2) to create a hydrophobic layer. 2% bis-acrylamide (Bio-Rad #1610142) and 40% acrylamide (Bio-Rad #1610140) were mixed in PBS in different concentrations, with ammoniumpersulfate (Sigma Aldrich-Merck #A3678) and N,N,N′,N′-Tetramethylethylendiamin (TEMED) (Sigma Aldrich-Merck #T9281) to catalyze polymerisation, to obtain the desired stiffness. Different amounts of these solutions were applied to the square hydrophobic coverslips (depending on the size and desired thickness of the gel). The round-activated coverslips were then applied over to extend the solution and left to polymerise for 30 min. Following proper polymerisation, the hydrophobic square coverslip was removed, and a functionalisation solution composed of MilliQ H2O, HEPES (Sigma Aldrich-Merck #H3375), Di-[1,1,1-tris-(hydroxymethyl)-propan]-tetraacrylat (Sigma Aldrich-Merck #408360) 0.2% in ethanol, α-Hydroxy-4-(2-hydroxyethoxy)-α-methylpropiophenon (Sigma Aldrich-Merck #410896) 5% in ethanol, N-(Acryloyloxy)-succinimid (Sigma Aldrich-Merck #A8060) 1% in dimethyl sulfoxide (Sigma Aldrich #D2650) and 0.2% bis-acrylamide (Bio-Rad #1610142) was applied on top and exposed to UV to ensure functionalization. After rinsing with HEPES and PBS, the gel was incubated with rat tail collagen type I (Sigma Aldrich-Merck #C3867) 0.1 mg/mL overnight. Gels were rinsed, UV-sterilized for 30 min, and incubated with cell growth medium for at least 1 h before use.
Cells and cell treatments
HUVECs (Lonza #C2519A) were maintained in M199 medium (Thermo Fisher #12350039) supplemented with 20% fetal bovine serum (Thermo Fisher #10270106), 1% Antibiotic-Antimycotic Solution (Sigma Aldrich #A5955), 0.01% heparin (Sigma Aldrich #H3393) and 0.005% endothelial cell growth supplement (Sigma Aldrich-Merck #01-102). Freshly isolated LSECs were maintained in Roswell Park Memorial Institute medium 1640 (Thermo Fisher#21875034) supplemented with 10% fetal bovine serum, 1% Antibiotic-Antimycotic Solution, 0.01% heparin and 0.005% endothelial cell growth supplement. Inflammatory stimulation was done with 10 ng/mL IL1β in PBS. 12 h before treatments, cells were switched to serum-free medium. Time and concentration of treatment were chosen based on previous literature and our own preliminary experiments.
Immunofluorescence analysis
Cells were fixed in 4% paraformaldehyde for 15 min, permeabilized with 0.1% Triton, and blocked with 1% BSA in PBS for 1 h at room temperature. Subsequently, overnight incubation with primary antibodies against ERG (1:500, Abcam #ab133264) and CD144 (1:500, Thermo-Fisher #14-1449-82) was done overnight at 4 °C. Secondary antibody incubation was performed with Goat Anti-Rabbit IgG H&L (Alexa Fluor® 488) (Abcam #ab150077) and Goat Anti-Mouse IgG H&L (Cy5 ®) (Abcam #ab6563) in combination with DAPI for 1 h at room temperature. Preparations were then mounted with Fluorescence Mounting Medium (Agilent Dako #S302380-2) and dried overnight. Four-6 images were obtained per slide and per channel at 63× magnification for LSECs and 40× magnification for HUVECs with a Leica DM400B microscope. Image analysis of fluorescence was performed using ImageJ software and fluorescence intensities were normalized by number of cells per field. Formalin-fixed paraffin-embedded tissue slides from human or rat livers were deparaffinized in xylol and hydrated with ethanol. Heat-mediated antigen retrieval was performed in Tris-EDTA solution and blocking was done with 5% goat serum for 1 h at room temperature. Subsequently, overnight incubations with primary antibodies against ERG (1:500, Abcam #ab133264) and CD144 (1:500, Thermo-Fisher #14-1449-82) were done overnight at 4 °C. Secondary antibody incubation was performed with Goat Anti-Rabbit IgG H&L Alexa Fluor® 488 (1:300, Abcam #ab150077) and Goat Anti-Mouse IgG H&L Cy5 ® (1:1000, Abcam #ab6563) in combination with DAPI for 1 h at room temperature. Tissue autofluorescence was quenched with Vector® TrueVIEW® Autofluorescence Quenching Kit (Vector Laboratories #SP-8400-15). Preparations were then mounted with Fluorescence Mounting Medium (Agilent Dako #S302380-2) and dried overnight. Four-six images were obtained per slide and per channel at 40× magnification with a Leica DM400B microscope. Image analysis of fluorescence was performed using ImageJ software and fluorescence area was normalized by total area of the image (area of expression/cm2 tissue) in a blinded manner.
Western Blot
Cells on polyacrylamide gels were trypsinised, centrifuged and lysed in RIPA Buffer. Protein concentrations were determined using the Pierce™ BCA Protein Assay Kit (Thermo Scientific #23225). Protein extracts were boiled in reducing sample buffer (Thermo-Fisher #39000) at 95 °C for 5 min. A total of 5–10 µg samples were separated by sodium dodecyl sulfate-polyacrylamide gel electrophoresis (SDS-PAGE) in 12% acrylamide gels. Proteins were then transferred onto nitrocellulose membranes, which were blocked with 5% non-fat milk in TBST for 60 min at room temperature, washed 3 times with TBST and incubated overnight at 4 °C with primary antibody against ERG (1:200, Santa Cruz, #sc-526021) and 1 hour at room temperature with HRP-conjugated secondary antibody (1:2000, Santa Cruz, #sc-526021). HRP conjugated anti-GAPDH antibody (1:5000, Abcam #ab185059) was used for loading control.
Real-time quantitative PCR
RNA was isolated and purified using the RNeasy Mini Kit (Qiagen, #74104), according to manufacturer protocol. RNA concentration was measured using Nanodrop spectrophotometer and retro-transcription to cDNA was performed using the Quantitect Reverse Transcription Kit (Qiagen, #205311). RT-PCR was performed using the TaqMan Fast Universal PCR Master Mix (Applied Biosystems, #4352042) and predesigned TaqMan probes in a QuantStudio 5 Real-time-PCR-System.
Bioinformatic analysis
A preliminary gene network expansion was undertaken using Enrichr, a tool developed by the Ma’ayan lab (https://maayanlab.cloud/Enrichr/), employing the ARCHS4 RNA-seq gene-gene co-expression matrix. This approach aimed to pinpoint genes exhibiting co-expression patterns with ERG48,49. Network expansion was further analyzed by Reactome or GO process including the top 10 genes related with the pre-expanded list (https://maayanlab.cloud/enrichr-kg). To predict ERG-related pathways and biological processes, we utilized (ARCHS4) (https://maayanlab.cloud/archs4/)50. Datasets pertaining to HUVECs and human LSECs (GSE164799, GSE18401, and GSE32984, respectively) were accessed from the GEO repository. After filtering both HUVECs database with human LSECs for common DEGs, the resulting list was subject to GSEA Hallmark as well as Panther Pathway analysis to observe functional classification (https://www.pantherdb.org/).
Statistical analysis
Statistical analysis was performed using GraphPad Prism 6 (GraphPad Software, CA, USA). Data represent biological replicates (n) and were depicted as mean values ± standard error (SEM). Frequency distribution of data was assessed with Normality test (Kolmogorov-Smirnov). For samples characterized by a normal distribution, means were compared by Student t-test (2 samples), or ANOVA ( > 2 samples) followed by the Tukey post-hoc analysis. Non-parametric tests (Kruskal-Wallis) followed by Mann-Whitney U test were used otherwise. Differences were considered significant at p < 0.05.
Responses