Alterations of the peptidomic composition of peripheral plasma after portal hypertension correction by transjugular intrahepatic portosystemic shunt
Introduction
Portal hypertension is a frequent complication of liver cirrhosis1, defined by a more than 6 mmHg pressure gradient between the portal vein and the vena cava2. Portal hypertension causes complications like (a) gastroesophageal varices, associated with a high risk of variceal bleeding3,4,5, (b) ascites, resulting in abdominal distension4 and (c) high risk for bacterial infections, resulting in bacterial peritonitis and/or pneumonia4.
Portal hypertension impacts the bidirectional, biomolecule-mediated gut and liver relationship. Portal hypertension, accompanied by dysbiosis and CLD, increases intestinal barrier permeability and translocates bacterial components and biomolecules, potentially inducing systemic and low-grade inflammation6. Gut-derived mediators, such as tryptophan and indole derivates, access the liver through the portal vein blood and affect the hepatic status7. In addition, systemic circulation influences the interaction between the intestine and the liver by transferring metabolites from the liver to the intestine via capillary diffusion8.
Management of portal hypertension complications involves pharmacological treatment with non-selective β-blockers (NSBB) like carvedilol9. However, the most effective and established clinical procedure for portal hypertension management is a transjugular intrahepatic portosystemic shunt (TIPS) between the hepatic and portal vein10,11, thereby decreasing the portal pressure and avoiding portal hypertension-associated complications12.
Since methods like transient elastography or magnetic resonance cannot be employed on certain patients13,14 where it is not feasible to measure hepatic venous pressure gradient15, there is a strong need for alternative non-invasive, broadly applicable diagnostic biomarkers for portal hypertension.
Plasma biomolecule concentrations are promising diagnostic markers for early detection of portal hypertension. Peptidomics is a proteomics-derived omics technique based on e.g. liquid chromatography-mass-spectrometry as an efficient method for both targeted and non-targeted peptide identification in diseases16,17,18.
Therefore, this study used a non-targeted peptidomics approach to identify low molecular weight biomolecules dysregulated in the plasma of patients affected by CLD and portal hypertension as potential biomarkers and potential mediators of pathological gut-liver cross-talk. The cohort considered in this study was selected to investigate the portal hypertension changes after TIPS, and the plasma samples were collected within 7–14 days after TIPS, representing the typical recovery window for TIPS intervention19.
Results
Patients’ characteristics
A total of 23 patients (65% males), who suffered from portal hypertension and underwent TIPS procedures, were included in this study. Patients’ ages ranged from 34 to 81 years old, with an average value of 55.7 (±12.5). The mean body mass index of the patients was 26.3 (±4.6), and the mean heart rate was 76.1 bpm (±12.5). Biochemistry evaluation of blood collected on the first visit was performed as shown in Table 1 and represents the clinical image of advanced CLD with liver dysfunction based on Child-Pugh scores, inflammation based on C reactive protein and portal hypertension based on the portal and systemic hemodynamic parameters. Demographic data like age, gender, and BMI was registered. The patients diagnosed with liver cirrhosis (n = 13) were i) alcohol-related liver cirrhosis (n = 10) (absent from alcohol consumption n = 5), ii) active hepatitis C (n = 1), iii) Metabolic dysfunction-associated steatotic liver disease (MASLD) (n = 1) and iv) autoimmune hepatitis (AIH) (n = 1). Ten patients were without a diagnosis of cirrhosis, including four with hepatic sinusoidal obstruction syndrome, three with Budd-Chiari syndrome, and three with unknown aetiology. Child-Pugh score before intervention was 7.5 (±1.9), indicating moderately impaired hepatic function20, and the score significantly decreased after TIPS to 6.1 (±1.1). Nine patients were classified in class A of Child-Pugh scores with 5–6 points, signifying a good hepatic function; nine patients in class B of Child-Pugh scores with 7–9 points, signifying moderately impaired hepatic function; and one patient in class C of Child-Pugh scores with 10–15 points signifying advanced hepatic dysfunction before TIPS and improved to 14 patients in class A and six patients in B class after TIPS treatment.
MELD score went from 9.9 ( ± 4.6) before to 9.1 ( ± 4.1) after TIPS treatment. The MELD-Na score ranged from 11.7 ( ± 5.5) before to 10.5 ( ± 5.5) after the TIPS intervention. The mean portal hepatic venous pressure gradient (PHPG) before TIPS treatment was 17.6 mmHg ( ± 6.9) and 8.8 mmHg( ± 3.7) after the intervention. Portal pressure (mmHg) decreased from 22.2 ( ± 6.9) to 16 ( ± 5.1) after the intervention. The systolic and diastolic blood pressure before and after TIPS was not significantly different, with a change from 114.4 ± 12.3 to 112.4 ± 17.4 and from 69.6 ± 10.8 to 65.2 ± 10.1, respectively. Patients also showed lower levels of bilirubin, alanine aminotransferase21, aspartate transaminase (AST), gamma-glutamyl transferase (γ-GT), alkaline phosphatase (A.P.), inflammatory marker C-reactive protein (CRP) and urea after the TIPS treatment as summarised in Table 1. Before the TIPS procedure, patients with or without cirrhosis had similar Child-Pugh scores, MELD scores, and portal and systemic hemodynamic parameters but different MELD-Na scores, among other characteristics, as summarised in Supplemental material Table s1.
Peptidomic analyses of plasma samples
A characteristic reversed-phase chromatogram of an EDTA plasma sample isolated from peripheral veins is shown in Fig. 1C, and the corresponding ‘total ion chromatogram’ of the mass spectrometric analysis of plasma from a patient before the TIPS treatment is shown in Fig. 1D. The corresponding ‘total ion chromatogram’ from the plasma of the same patient after TIPS is shown in Fig. 1E.
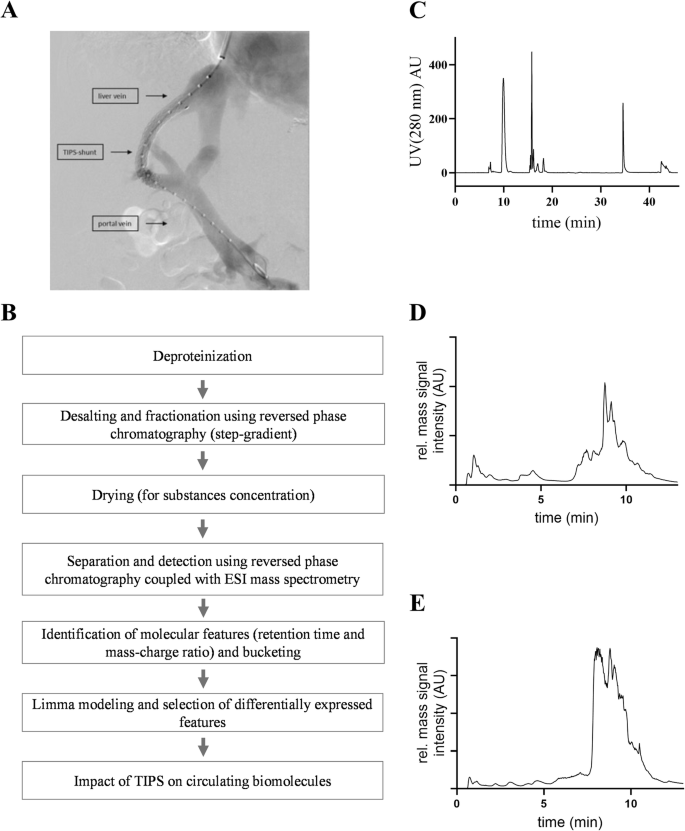
A TIPS procedure connecting the hepatic and portal veins to reduce the portal pressure. B Workflow of sample preparation for mass spectrometric analyses and biomolecule identification. C Desalting and fractionation of peptides via HPLC (time of the run 46 min, gradient: 0–10 min: 100% A; 10–20 min: 80% A – 20% B; 20–30 min: 60% A – 40% B; 30–38 min: 0% A – 100% B; 38-46 min: 100% A – 0% B; eluent A = TFA (0.1% v/v), eluent B = ethanol (80% v/v); U.V. absorbance = λ280 nm). Total ion chromatogram of a peripheral vein sample from a patient before TIPS (D) and after TIPS (E). A.U. arbitrary units.
Identification of differentially expressed molecular features by limma statistics
By bucketing, unique molecular features within the plasma samples were identified, and mass-signal intensities were collected in buckets defined by R.T. and m/z with a retention time tolerance of 0.3 min and mass-spectrometric tolerance of 0.4 Da. The final analysis included 79 normally distributed molecular features. The differentially expressed molecular features were ranked by their adjusted p values and B values before and after TIPS treatment.
Eleven significant differentially occurring molecular features in the peripheral vein before vs. after TIPS were identified (adjusted p value ≤ 0.05). These molecular features, their logFC, and adjusted p values are given in Table 2. The molecular features measured after TIPS treatment showed a logFC 5-fold lower than their respective logFC before TIPS treatment, except the molecular feature showed a positive logFC, indicating an increase after TIPS treatment.
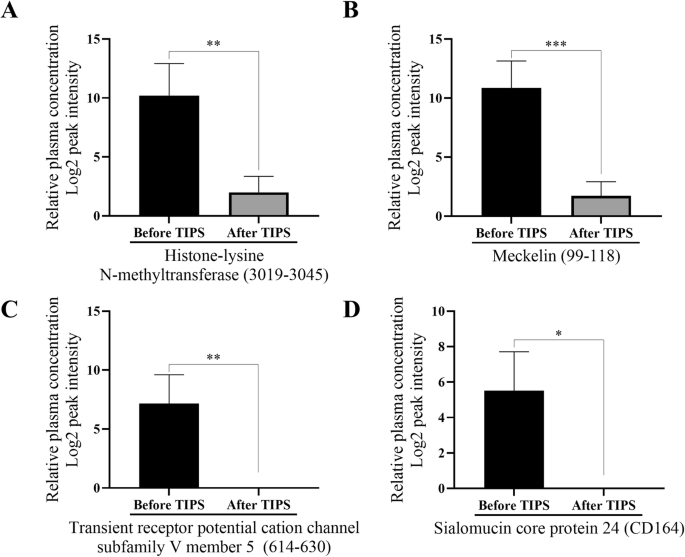
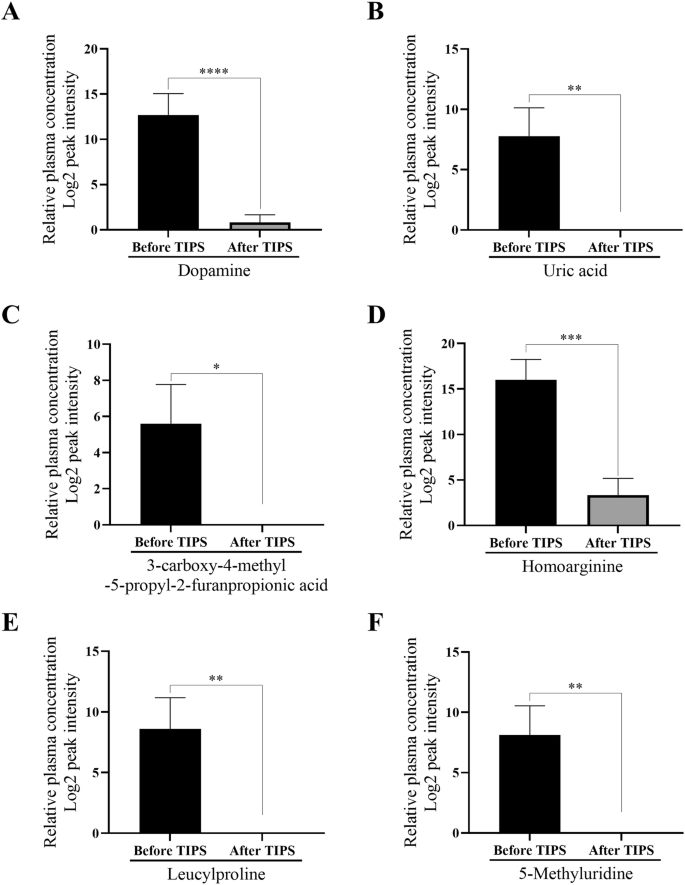
The mass signal intensities of the molecular features at 863.4 m/z, 943.0 m/z, 951.4 m/z and 1045.8 m/z within the peripheral vein plasma significantly decreased after TIPS intervention (Fig. 2). The identical effect was observed for the biomolecules with mass signal intensities at 153.0 m/z, 169.0 m/z, 241.0 m/z, 187.8 m/z, 229.0 m/z and 259.0 m/z (Fig. 3). The molecular feature at 154.2 m/z showed an increased mass-signal intensity after the TIPS treatment, but was not identified based on the low molecular weight(supplemental material Fig. S1). The Supplemental material Table S2 reports the percentages of zero intensity values in the cohorts.
Bar plots quantifying the molecular features 863.4 m/z (A), 943.0 m/z (B), 951.4 m/z (C) and 1045.8 m/z (D) in peripheral vein blood before vs. after TIPS treatment of patients with portal hypertension (n = 17 before TIPS, n = 20 after TIPS). Data are shown as mean ± SEM. *p ≤ 0.05, **p ≤ 0.005, ***p ≤ 0.0005.
Bar plots quantifying the molecular features 153 m/z (A), 169 m/z (B), 187.8 m/z (C), 229 m/z (D), 241 m/z (E) and 259 m/z (F) in peripheral vein blood before vs. after TIPS treatment of patients with portal hypertension (n = 17 before TIPS, n = 20 after TIPS). Data are shown as mean ± SEM. *p ≤ 0.05, **p ≤ 0.001, ***p ≤ 0.0005, ****p ≤ 0.00005.
Correlation analyses
The baseline molecular feature at 154.2 m/z positively correlated with the PHPG after TIPS treatment (Fig. 4A). The baseline of the molecular feature at 187.8 m/z negatively correlated with leucocytes after the TIPS treatment (Fig. 4A). Interestingly, the baseline value before TIPS insertion at 951.4 m/z negatively correlated with PHPG after treatment (Fig. 4A), while the increase after TIPS insertion (∆) showed a strong significant positive correlation (Fig. 4B). Additionally, 943.0 m/z at baseline correlated positively with serum creatinine (Fig. 4A), while the changes correlated negatively (Fig. 4B). Moreover, the feature at 863.4 m/z showed a negative correlation with a marker for liver damage alanine aminotransferase (ALT) after TIPS treatment (Fig. 4A).
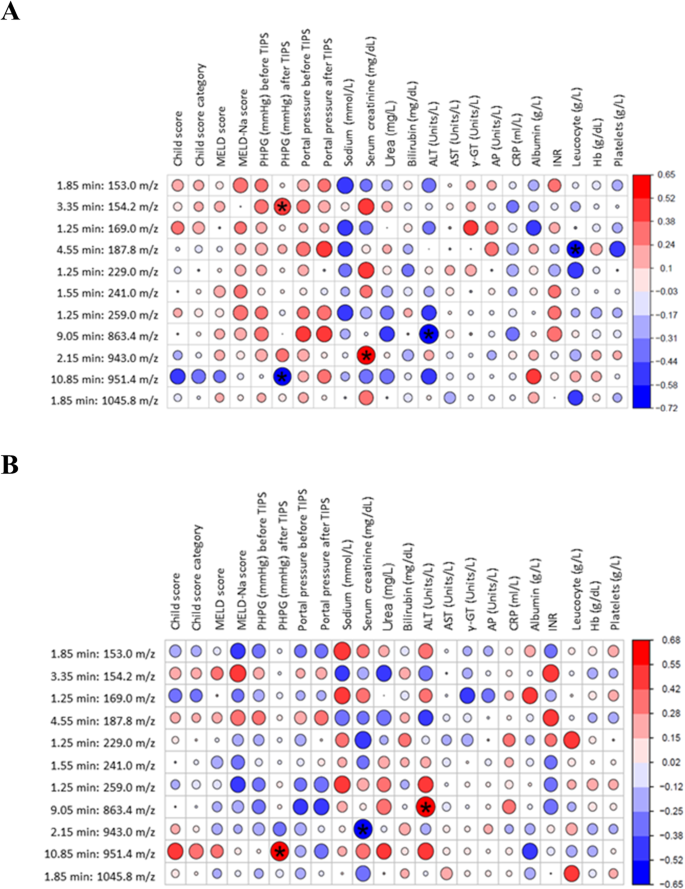
A shows the correlation between the baseline molecular features and the clinical markers. B shows the correlation between molecular features after TIPS vs clinical markers. The P value is reported as *p < 0.05; the darker the colour of the circle represented in the figure, the stronger the correlation.
Sequencing mediators
The underlying amino acid sequences of the molecular features were identified by MALDI-TOF/TOF mass-spectrometry (Ultraflex-III TOF/TOF, Bruker-Daltonic, Germany), Orbitrap mass-spectrometry (Thermo-Fisher, Germany) as well as LC-ESI mass-spectrometry (HCT, Bruker-Daltonics, Germany). Figure 5A shows a characteristic HCT mass-spectrum of the molecular feature at 169.0 m/z. The underlying mediator was fragmented by MS/MS, resulting in the identification of uric acid, as shown in Fig. 5B.
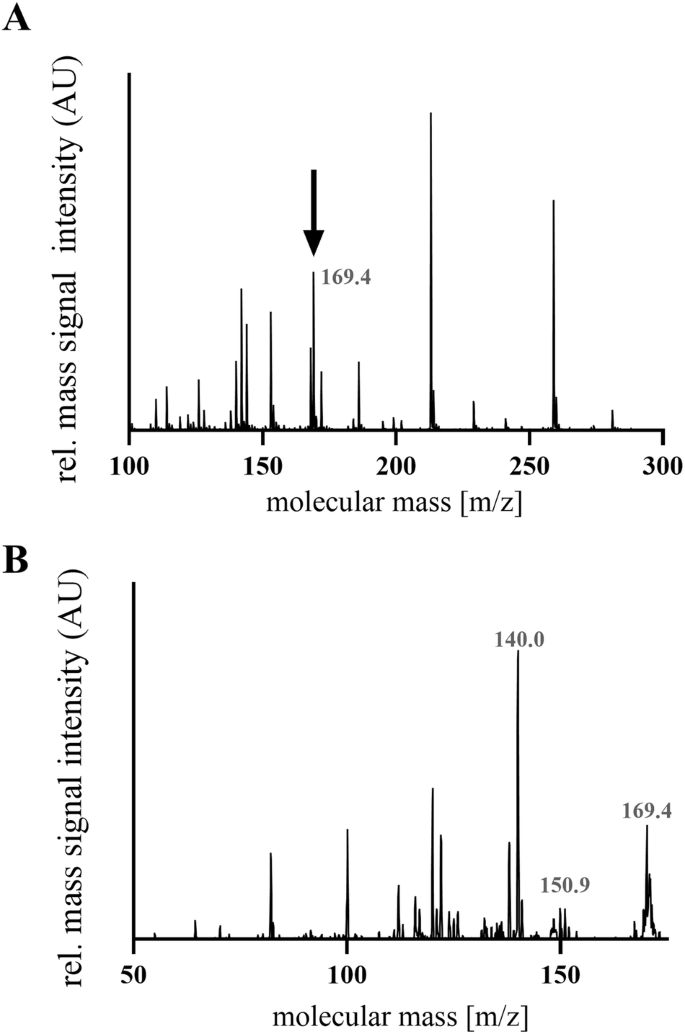
A Mass spectrum of the feature with m/z 169.0. B Representative MS/MS fragmentation of the molecular feature 169.0 m/z was identified as the metabolite uric acid.
The peptide with the m/z ratio 863.4 originates from the protein ´Histone-lysine N-methyltransferase´ (MLL3) (3019–3045). The peptide with an m/z ratio of 943 was found to be a Meckelin peptide (99–118), and the peptide with an m/z ratio of 951.4 is cleaved from the ´Transient receptor potential cation channel subfamily V member 5´ (TRPV5). The m/z ratio of 1045.8 corresponded to amino acids 160–180 of sialomucin core protein 24 (CD164) (Table 3). The Table 3 lists metabolites identified by LC-ESI-MS/MS and literature mining, which led to the structure identification of dopamine (m/z ratio 153), uric acid (m/z ratio 169), homoarginine (m/z ratio 187.8), leucylproline (m/z ratio 229), 3-carboxy-4-methyl-5-propyl-2-furanpropionic acid (CMPF) (m/z ratio 241) and 5-methyluridine (m/z ratio 259).
Discussion
Portal hypertension impacts the physiology and pathophysiology of the gut and the liver through the gut-liver axis, leading to venous congestion in the intestine and disrupting the intestinal barrier. Since the knowledge of gut-liver cross-talk is limited, an increasing number of studies are focusing on analysing the role of gut-liver cross-talk in chronic inflammatory diseases22. This includes the investigation of gut dysbiosis in liver diseases like MASLD, alcohol-related liver disease, liver cirrhosis and hepatic carcinogenesis23,24, as well as the development of novel therapeutic strategies targeting the gut microbiota in liver diseases25. By analysing the plasma of patients displaying portal hypertension, biomarkers were identified as diagnostic tools and therapeutic mediators contributing to understanding the gut and liver cross-talk. We could not analyse the correlation of the identified peptides with post-TIPS hepatic encephalopathy as in our cohort, only one patient developed post-TIPS hepatic encephalopathy. The low incidence of post-TIPS hepatic encephalopathy might be related to our cohort’s use of covered TIPS.
Using an untargeted peptidomics approach, we identified novel potential mediators differentially occurring in the blood of patients who underwent TIPS treatment. We developed peptidomics data analyses to discover and determine new biomarkers16,17 and identify novel peptides to be used in prevention and prediction models26. The peptidomics approach focused on mediators with a significantly different expression before vs after TIPS treatment. The peptidomics data were analysed using ‘limma’ statistics27,28 and t-statistics, identifying ten molecular features that decreased after TIPS treatment and increased intensity of one molecular feature. The ∆s of four molecular markers (187.8, 863.4, 943.0, 951.4 each m/z) correlated with leucocytes amount, ALT, serum creatinine and PHPG, demonstrating the potential of the novel biomolecules in the contest of the portal hypertension diagnosis and treatment.
Four of these ten biomolecules were identified and sequenced as peptides (Table 3). The literature points to the potential mechanisms by which the parent proteins of these peptides impact portal hypertension or liver regeneration (summarised in Fig. 6A):
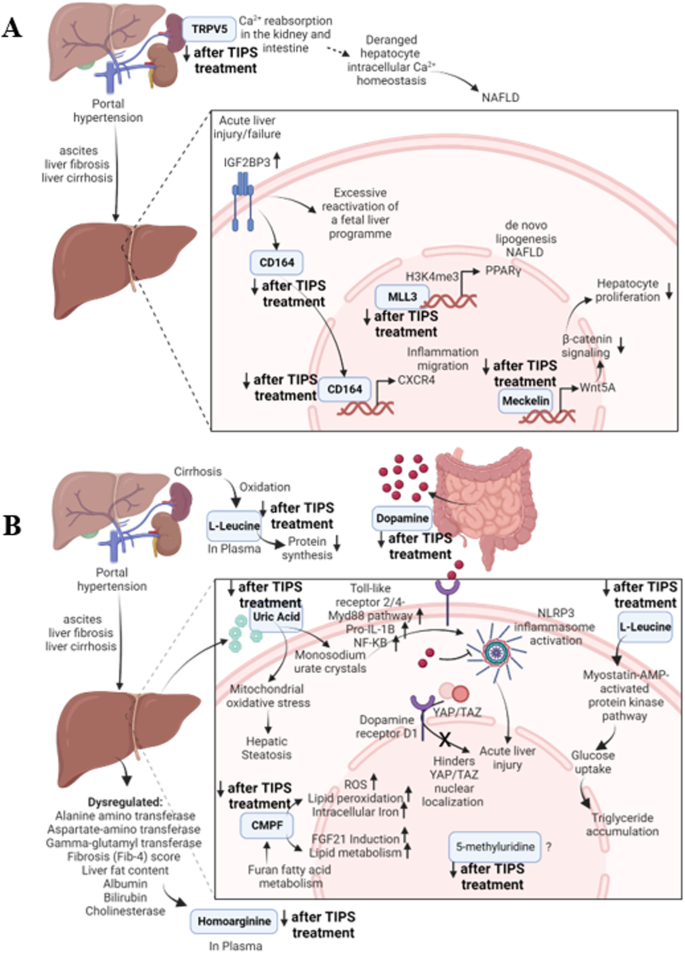
A Mechanisms by which the identified parent proteins might impact portal hypertension or liver regeneration. B Mechanisms by which the identified metabolites might impact portal hypertension or liver regeneration.
The origin protein of peptide MLL3 (3019–3045) regulates metabolic processes and the hepatic circadian control of bile acid homoeostasis29. MLL3 is involved in fatty liver development30 and MASLD pathology by methylation of histone 3 forming H3K4me3, which interacts with the promoters of PPARγ resulting in increased de novo lipogenesis in hepatocytes leading to MASLD24,31.
The parent protein of Meckelin (99–118) negatively regulates the canonical Wnt signalling, and activates the non-canonical cascade stimulated by Wnt5A32, a regulator of β-catenin signalling and hepatocyte proliferation33. The Wnt5a/Frizzled-2 axis suppresses β-catenin signalling in hepatocytes, contributing to the conclusion of the liver regeneration process. Therefore, the reduction in Meckelin after the TIPS procedure might reduce the stimulation of WNT5A, promoting liver regeneration and overcoming the injury of portal hypertension.
The peptide TRPV5 (614–630) was cleaved from a protein, regulating Ca2+ reabsorption in the kidney and intestine34,35,36. Deranged hepatocyte intracellular Ca2+ homoeostasis promotes the progression of NASLD24,37,38, but the impact on portal hypertension or liver disorders has not yet been identified until now.
The parent protein of the peptide CD164 (160–180) is involved in haematopoiesis39, with high expression in the pathological context of portal hypertension before TIPS treatment and is increasingly expressed in liver tissue in pro-inflammatory, high-cholesterol conditions40. In addition, CD164 is a downstream functional effector of ‘Insulin-Like Growth Factor 2 mRNA-Binding Protein 3’ (IGF2BP3)41, which is overexpressed in acute liver injury42. CD164 activates the CXCR4 axis, promoting inflammation and migration of cells41. Therefore, the downregulation of CD164 after the TIPS procedure is concurrent with the reduction of pathological stress on the liver cells caused by portal hypertension.
Our findings show the downregulation of MLL3 (3019–3045), Meckelin (99–118), TRPV5 (614–630), and CD164 (160–180) are, therefore, the first step towards establishing these peptides as biomarkers of portal hypertension.
The remaining mediators are derived from gut and liver metabolism and/or previously related to liver (patho)physiology (Table 3). Since the concentration of these mediators decreased after TIPS, they are correlated to portal hypertension and might act as biomarkers for early, non-invasive diagnostics. The mechanisms through which these metabolites influence portal hypertension or liver regeneration are shown in Fig. 6B.
Approximately 50% of dopamine is produced in the gastrointestinal tract and is involved in cell immunity regulation as well as in suppressing autoimmune hepatitis43. Liver cirrhosis inhibits dopamine synthesis due to a ‘false’ dopaminergic transmission resulting from increased availability of aromatic neurotransmitters precursors44 and increases natriuresis45, leading to an expected increase in endogenous dopamine production after TIPS. Dopamine is also therapeutic against acute liver failure by inhibiting NLRP3 inflammasome activation and enhancing hepatic regeneration46. In addition, agonism of dopamine receptor D1 hinders the nuclear localisation of YAP/TAZ, which is causal for acute liver injury. Therefore, binding dopamine to its receptors is an essential step in liver regeneration and could account for the lower levels of dopamine post-TIPS treatment. However, the exact mechanism by which dopamine impacts portal hypertension is not known.
The liver produces uric acid and induces hepatic steatosis through mitochondrial oxidative stress production hereby47. Higher serum levels of uric acid are associated with a higher probability of developing MASLD24,48. Uric acid leads to monosodium urate crystals forming, which activate the NLRP3 inflammasome, promoting acute liver injury. The underlying mechanism involved is activating the Toll-like receptor 2/4-Myd88 pathway and increased transcriptional levels of pro-IL-1β through the NF-κB pathway49. Therefore, a decrease in uric acid coincides with an expected reduction in liver disorders after the TIPS treatment.
Homoarginine is synthesised by the liver50,51 and is an inhibitor of alkaline phosphatases52,53. Abnormal liver biomarkers such as Alanine aminotransferase, Aspartate-amino transferase, fibrosis (Fib-4) score, liver fat content, and cholinesterase are related to greater circulating hArg concentrations in the general population50, supporting our finding that reduction in portal hypertension leads to a reduction of circulating homoarginine levels.
The present study shows that Leucylproline concentrations are higher in plasma in patients affected by MASLD-cirrhosis and decreased after TIPS treatment. Branched-chain amino acids (BCAA) such as leucine and proline have been reported to be decreased in liver cirrhosis44,54, however, in chronic liver diseases, an increase of BCAAs has been observed55. The utilisation of BCAA-rich medications has demonstrated favourable outcomes among individuals diagnosed with cirrhosis55. However, the exact mechanisms by which BCAAs play a role in portal hypertension are unknown. Moreover, the identified dipeptide Leucylproline might have a different mechanism of action than individual BCAAs.
CMPF is suggested as a MASLD prediction marker24,56 since high plasma levels of CMPF negatively correlate with lipid metabolism. CMPF promotes the production of reactive oxygen species, lipid peroxidation, and intracellular iron accumulation57. In this context, detecting a reduced CMPF concentration by the TIPS treatment is highly relevant for patients with liver diseases. Last but not least, the metabolite 5-methyluridine was detected in humans58 and E. Coli59 but has not been so far linked to liver cirrhosis, MASLD, NASH or portal hypertension24. The results of the present studies provide interesting approaches for investigating these interactions.
Indeed, our study has some limitations. First of all, this is a retrospective cohort with a limited number of patients included with different etiologies, including cirrhosis and non-cirrhosis with portal hypertension. However, we have paired plasma samples in these patients before TIPS insertion and during follow-up visits. Although the patients were included over four years, all patients received the same type of TIPS stent, limiting our results’ bias. However, we still believe samples from patients with severe portal hypertension are valuable. The related peptides could offer insights into the potential markers and mechanisms of different outcomes and events after the TIPS procedure since the TIPS procedure needs experienced radiologists and hepatologists. Of course, further prospective studies are required to validate our findings.
In summary, eleven mediators were differentially expressed in the plasma of peripheral veins after TIPS treatment and require further in vivo validation based on the solid evidence from published data linking these mediators to liver regeneration, MASLD and liver cirrhosis, among other pathophysiological pathways. The current study demonstrates that these mediators could play a role in the gut-liver axis organ crosstalk pathophysiology. Moreover, while the current findings suggest a potential role for these mediators in gut-liver axis organ crosstalk, further experiments and clinical investigations are imperative to substantiate their significance and elucidate their precise mechanisms of action.
Methods
Description of the patient cohort
A total of 23 patients from the observational NEPTUN (‘Non-invasive Evaluation Programme for TIPS and Follow-Up Network’; clinicaltrials.gov identifier: NCT03628807) with a pressure gradient between the portal vein and vena cava above 6 mmHg, and undergoing a TIPS treatment using VIATORR® Controlled Expansion (VCX) type were included in the study (Fig. 1A, Table 1). The study design is a retrospective cohort, and the study was approved by the local ethics committee of the University of Bonn (029/13). All patients signed informed written consent following the Declaration of Helsinki.
200 µL EDTA plasma was collected from peripheral veins before and after TIPS treatment. The peripheral plasma samples before TIPS at baseline were taken during the TIPS procedure when patients were under analgesia. Therefore, there were no significant differences between blood sampling and TIPS procedure in the patients of our cohort. Paired samples of the patients were taken at regular follow-up visits after TIPS insertion. Plasma was subsequently processed and stored at −80 °C until analysis. The portal-hepatic pressure gradient was measured during the TIPS procedure according to the guideline, which involves the insertion of a catheter into the hepatic vein and the portal vein with the guidance of the ultrasound. Portal and inferior vena cava pressures were measured to calculate the porto-hepatic pressure gradient pre- and post-TIPS insertion. Scores and classes to predict the outcome of portal hypertension in patients, such as ‘Child-Pugh score’, ‘Child class and Model for End-Stage Liver Disease’ (MELD) score, were collected, as well as the ‘Model for End-Stage Liver Disease-Na’ (MELD-Na).
Plasma sample preparation for chromatographic analysis
The plasma samples were defrosted and centrifuged at 956 g for 10 min at 4 °C. A total of 1 µg of Sar-Thr-angiotensin II (Sigma-Aldrich, Germany) was added as an internal standard. Plasma proteins were denatured by adding perchloric acid 70% (PCA) with a ratio of 65 µL per mL of plasma. After centrifugation at 956 g for 10 min at 4 °C, the supernatant was transferred to a fresh tube and the pH was adjusted to a value ≥ 9.0 by adding potassium hydroxide (5 mol/L). Plasma samples were frozen at −20 °C for 24 h, thawed and centrifuged at 956 g for 10 min at 4 °C. The supernatant was collected, and the pH was adjusted to 7.0 ± 0.1 by adding PCA before proceeding with high-performance liquid chromatography.
High-performance liquid chromatography (HPLC)
The deproteinated plasma samples were diluted by adding 0.1% trifluoroacetic acid (TFA) and were fractionated by high-performance liquid chromatography (HPLC) by using a C18-chromolithTM reverse-phase chromatographic column (100 mm × 4.6 mm; Merck, Germany). TFA in water (0.1% v/v) was used as the polar solvent A, and hydrophobic solvent B was constituted by ethanol (80% v/v) in water, maintaining a flow rate of 1 mL/min for 46 min. The fractionation was performed by a gradient as follows: 0–10 min: 0% B, 10–20 min: 20% B, 20–30 min: 40% B, 30–38 min: 100% B, 38–46 min: 100% A and 0% B. The fractions were lyophilised with a freeze-drying technique by employing a Savant Speed Vac (SPD101B, Thermo Fisher Scientific, USA) and ‘Refrigerated Vapor Trap’ (Thermo Fisher Scientific, USA) after the chromatographic separation.
Liquid chromatography coupled with electrospray ionisation-mass-spectrometry (LC-ESI-MS) for peptide identification
The lyophilised samples were re-suspended in water and formic acid (0.1% v/v) in a total volume of 50 µL. The samples underwent fractionation by capillary-HPLC (Agilent 1200, Germany), employing a ‘C18 SB Zorbax’ column (150 × 0.5 mm, 5 µm, Agilent Technologies, Germany). Eluent A was formic acid (0.1% v/v), and eluent B was acetonitrile (99.9% v/v) (Thermo Fisher Scientific, Germany) with formic acid (0.1% v/v). The flow rate of the solvents was 60 µL/min for 22 min, and the temperature was stable at 50 °C. The re-suspended samples were fractioned by 0–2 min: 0% eluent B, 2–10 min: 0–30% B, 30–100% B, 13.5–15.5 min: 100% B, 15.5–16.0 min: 0–100% A and 100–0% B, and 16–22 min: 100% A and 0% B. The eluate obtained after the chromatographic separation was analysed with a high-capacity ion-trap (HCT) mass spectrometer (Bruker-Daltonics, Germany).
The mass analyser employed was used in the positive ion mode with a source temperature of 300 °C to detect the eluted mediator’s molecular masses (m/z). The nebuliser gas was kept at 20 psi, and the dry gas flow was accustomed to 9 L/min. For the detection of compounds, the mass spectrometric accumulation time of the ion trap was set to 200 ms. The mass spectrometer was tuned in the wide-mode option on m/z 800 and operated in enhanced mode scanning for m/z between 100 and 1500. Data were acquired and processed with the software HyStar 3.2 (Bruker-Daltonics, Germany).
Data processing
Mass-spectrometry raw data were processed, and the molecular features were visualised through the mass-spectrometric software ‘DataAnalysis 4.0’ (Bruker-Daltonics, Germany). Specific molecular features were selected with the ‘FindMolecularFeatures’ (FMF) algorithm and were characterised by the retention time (R.T.), the m/z, and the intensity of the peak. The FMF algorithm was based on (i) signal-to-noise ratio (S/N), used for discriminating between noise and compound (used value: 2)60 (ii) correlation coefficient threshold, which defines the minimal time correlation to combine peak clusters (used value: 0.79); (iii) minimum compound length, which specifies the number of spectra to determine a peak (used value: 10); (iv) smoothing width, to smooth out the chromatogram with the value of 2; and (v) background subtraction. The resulting data were transposed into a bucket table, characterising the features by their R.T., m/z and mass intensity. Similar compounds were bundled together with an R.T. tolerance of 0.3 min and m/z tolerance of 0.4, aiming at the reduction of size and complexity of the dataset, easing out the following statistical analyses. Features with more than 80% of zero values and were not unique regarding R.T. and m/z, were excluded from further analyses.
Statistical analyses
The bucketed data were statistically analysed using the RStudio open source software (RStudio Team, 2016. M.A., USA) and GraphPad Prism version (9.1.1 for Windows, GraphPad Software, CA, USA). The intensities of the molecular features were normalised by the internal standard, converted to log2 and tested for normal distribution. The ‘limma’61 was implemented in the RStudio workflow to fit the data to a linear model, with the function ‘lmfit’, followed by ‘makeContrasts’ and ‘contrasts.fit’61 to estimate the coefficients and standard errors for every contrast declared in the original model. The method’ eBayes’61 was used to identify differential abundances of the molecular features. A false discovery rate adjustment was performed, obtaining adjusted p values for multiple t-tests using the ‘toptable’ function and extracting the best-ranked molecular features. The statistical approach analysed differences in log2 intensities of the molecular features in samples before vs. after TIPS intervention.
Two sets of correlation analyses were performed to investigate whether the molecular features correlated with the CLD clinical markers. In the first set of correlations, the intensities of the molecular feature before TIPS were compared to the clinical markers, while for the second set of correlations, a delta was calculated by subtracting the mass-signal intensity after treatment from the intensity before treatment (∆). The data were adjusted, and Pearson correlation analyses were performed using RStudio.
The unidentified molecular feature at 154.2 m/z was normally distributed, however, the other features were not normally distributed. Therefore, the molecular feature at 154.2 m/z was analysed with parametric tests and for all the other molecular features which were not normally distributed, nonparametric tests with Mann Whitney test as a post-hoc test were used for statistical analysis.
Identification of amino acid sequences of the molecular features
To investigate the amino acid sequences of the identified molecular features, 1 µL of the re-suspended samples and a matrix (α-4-hydroxycinnamic acid, 2.5 mg/mL) were applied on a Rapiflex plate support and analysed by employing a BrukerUltraflex-III TOF/TOF instrument (Bruker-Daltonic, Germany). MS/MS fragmentation was performed to fragment the molecular features, reconstruct the sequences using ions a, b and y, and align the results to the ‘Mascot database’ (Matrix Science Inc, Boston (M.A.), U.S.). Identification of low-weight molecular weight features was performed by MS/MS employing the LC-ESI mass-spectrometry (Bruker-Daltonics, Germany) followed by literature mining with open sources databases ‘human metabolome database’60 and ‘PubChem’18. The workflow steps of sample preparation, data processing and analysis are shown in Fig. 1B.
Responses