Application of a Full-Field macro-XRF imaging spectrometer to non-invasive investigation of elemental composition in three-dimensional artworks

Introduction
Today, Macro X-Ray Fluorescence (MA-XRF), as one of the possible variants of the XRF technique, is a well-established research method, especially among the heritage science community. Mapping of chemical elements distributions in the surface layers of artwork helps art historians and conservators, for example, to identify the inorganic pigments found in cultural heritage (CH) objects1, to verify the quality of conservation treatments carried out in the past2,3, or to support investigations dealing with the provenance or authenticity of CH objects4,5. Hidden internal layers with preparatory drawings or original sketches can also be revealed6,7. Given the multi-spectral capabilities and non-invasive character of the MA-XRF technique, it is also suitable for applications in other fields such as biology, geology, or forensics8,9,10,11,12. Although there are a few commercially available spectrometers13,14,15, numerous custom-designed instruments have been developed by different scientific groups and laboratories16,17,18,19.
As most MA-XRF spectrometers are designed to scan objects using focused X-ray micro-beams, their use is generally limited to the investigation of flat objects. If the investigated surface is not located precisely in the focal plane of the micro-beam, the beam risks to aim at a point different from the one aimed from the detector. Although investigations of objects with moderate surface curvature can be performed successfully20,21, measurements of objects with non-flat surfaces will result in significant degradation of spatial resolution and visible blurring of the obtained elemental maps22. Moreover, in the case of complex 3D objects the shadowing effect is unavoidable, i.e. some fraction of excited X-ray radiation may not reach the detector, because of absorption in fragments of the object on the way from the excitation point to the detector resulting in significant reduction of signals or even completely blocked signals from some parts of the investigated object.
Significant improvements have been made recently to address the issues mentioned above. For example, non-uniform sensitivity can be worked around by a proper data correction procedure23 and a new method for reconstructing the topography of the object24 has been proposed. In turn, the shadowing effect can be mitigated by applying two detectors mounted in opposite directions19. Some solutions have also been proposed to solve the problem of spatial resolution degradation with varying detector-object distance, such as an innovative Aperture Management System (AMS) from Bruker Nano GmbH25 or automatic detector-object distance adjustment systems, in which the measurement head follows the surface curvature of the investigated object19,26,27. Another interesting solution for proper positioning, although developed for Particle-Induced X-ray Emission (PIXE)28, can be suitable for MA-XRF spectrometers. The use of a cable-robot-based positioning system, as an alternative to the typical stacked linear motorised stages, is also worth noting29.
Despite all the improvements mentioned above, the use of scanning MA-XRF instruments for investigating 3D CH objects remains a challenging task. Taking into account the typical working distance between the investigated object and the detector in such spectrometers (~1.0 cm), measurements of most 3D objects with considerably irregular shapes may turn out to be a really hard task. The safety of the investigated objects when a measurement head moves close to them is another concern. Therefore, in addition to standard scanning systems, one may consider an alternative approach based on Full-Field X-Ray Fluorescence (FF-XRF) imaging30,31,32,33. Such systems allow for measurements with a larger distance between the instrument head and the object, resulting in safer movement of the instrument around valuable objects. Moreover, the application of pinhole camera optics, which in principle has infinite depth of field, enables measurements of 3D objects without compromising the spatial resolution of the spectrometer. Some examples of imaging results can be found in refs. 34,35,36,37. However, the investigated objects are rather reliefs and not full 3D shapes. Other solutions worth noting for elemental imaging of non-flat objects are also those based on photogrammetric modelling combined with point XRF analysis38,39 or computer tomography combined with full-field imaging40.
In this paper, we present the capabilities of a custom-developed FF-XRF imaging spectrometer for applications involving 3D types CH objects. To improve the data analysis process, machine learning algorithms such as Non-negative Matrix Factorisation (NMF) have been implemented to complement the traditional Region of Interest (ROI) method.
Experimental
MA-XRF spectrometer
The MA-XRF imaging results presented in the paper were obtained using a custom-developed FF-XRF spectrometer. A sketch of the spectrometer concept is shown in Fig. 1.

Schematic diagram of the working principle of the system with two X-ray tubes and a pinhole camera.
A detailed description of the system can be found elsewhere41. In short, the instrument consists of two X-ray tubes (Varian VF-50J 50W @ 1 mA and 50 kV operation) with pinhole camera optics42, a position-sensitive and energy-dispersive detector with an active area of 10 cm × 10 cm based on Gas Electron Multiplier (GEM) technology, a custom-design detector readout system based on Application Specific Integrated Circuits (ASICs) and a controller based on Field-Programmable Gate Array (FPGA) technology43. All components are mounted in a box with dimensions 88 cm × 30 cm × 17 cm and weight of approximately 10.0 kg, which is attached to the robotic arm.
The GEM detector used in the described spectrometer is a gaseous type detector working in the proportional regime. Briefly, it is a micro-pattern gaseous detector consisting of drift electrode followed by three successive GEM foils and a readout structure enclosed in a not perfectly tight chamber flushed with a gas mixture based on one of noble gases. The detector working principle is based on the ionisation of gas atoms followed by the multiplication of the generated electrons in GEM foils and finally collection of the generated electron clouds on readout electrodes using a properly formed electric field. Although the development of GEM detectors is primarily driven by their applications in high energy physics experiments, they are also suitable for simultaneous spectral and position-sensitive measurements of low-energy X-rays, up to about 20 keV.
Applied GEM detector is equipped with a 2D strip-like Cartesian readout structure with a readout pitch of 0.8 mm resulting in a spatial resolution σs of 110 μm44. The energy resolution averaged over all the sensitive area of the detector is typically 1.1 keV Full Width at Half Maximum (FWHM) at 5.9 keV. The quantum efficiency varies strongly with X-ray energy and for argon-based gas mixture is about 32% for 4 keV going down to 3.1% for 10 keV. These parameters are determined by the operating principle of gaseous detectors and fundamental physical phenomena45. The energy resolution and especially quantum detection efficiency are relatively low, compared to silicon 0D detectors, which offer energy resolution at a level of 150 eV FWHM at 5.9 keV with detection efficiency of about 99% (450 μm absorption depth). Nevertheless the GEM detectors like the one that we have used are still useable for our application. It is worth noting that to the best of our knowledge, the energy resolution of our detector is one of the best reported in the literature for GEM detectors46,47,48,49. It has been achieved by using an advanced readout system and calibration procedures.
The images of the measurement head and the ready-to-use system with the measurement head mounted on the robotic arm are shown in Fig. 2. Using six degrees of freedom of the robotic arm, proper alignment of the measurement head and the examined object can easily be ensured.
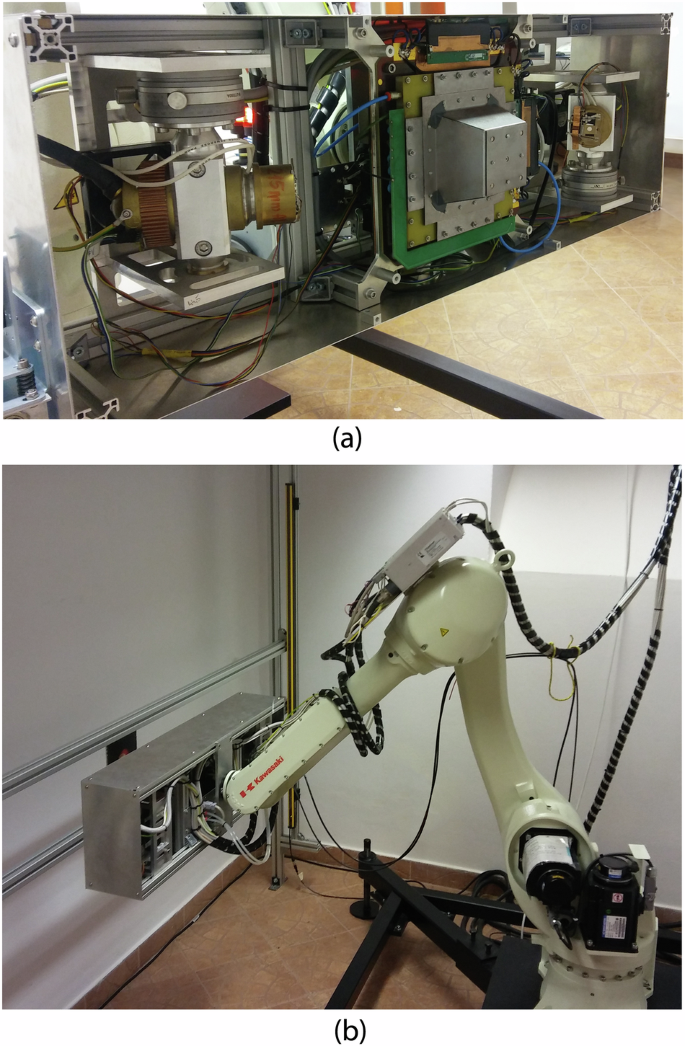
Measurement head (a) mounted on the robotic arm (b).
Although the spectrometer can operate in different optic configurations, i.e. with different optical magnification, in the reported measurements the following set of parameters was used: (a) optical magnifications of ×1, (b) investigation area of 10 cm × 10 cm, (c) 65 mm length pinhole camera with two different diameters (1 and 2 mm). Therefore, according to the formula presented in ref. 50, the resulting spatial resolution in the central part of the detector was 0.9 and 1.7 mm (rms) for 1 and 2 mm, respectively.
Investigated objects
Two different CH objects were investigated: a low-significance object and an actual CH object. From the point of view of the developed measurement technique, this represents a different range of spatial depth (the distance between the closest and farthest part of the object seen by the detector), which allows to evaluate the performance of the system over a wide depth of field. In addition, for one of the investigated objects we have tested the stitching procedure of adjacent frames, which for objects with highly irregular shapes can be a challenge due to the operating principle of the pinhole camera and the geometry of the measurement system.
The first investigated object is a gilded wooden fragment of the ornament of a Rococo altar from the church of St. Mary Magdalene located in Dukla (city in the Podkarpackie province, Poland). Images of the object are shown in Fig. 3 showing three profiles. It would fit into a box with dimensions 20 cm × 18 cm × 3 cm.
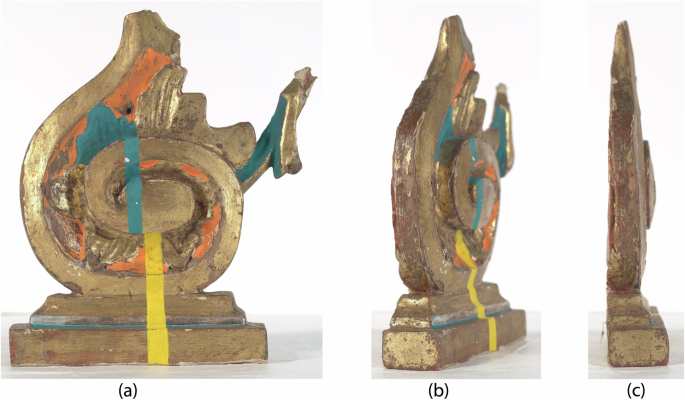
Front-side (a), half-profile (b), profile (c).
For this study, modifications were made to the object to enhance its elemental composition complexity. Five different reference commercial paints were applied to the surface of the object. Minium (red lead) was used for the orange areas, viridian and malachite (chrome and copper greens, respectively) were used for the green parts, and cadmium yellow was used for the vertical yellow stripe in the lower, central portion of the object. Furthermore, a narrow horizontal section at the base of the object was coated with a layer of silver.
The second object Inkwell with lid shown in Fig. 4 is an example of artistic craftsmanship. The object is dated to the second half of the sixteenth century and was made using techniques such as forging, gilding, and engraving. The inkwell in the form of a cylinder is decorated on the entire surface with four ancient scenes (The Judgment of Paris, Apollo and Marsyas, The Astronomer, and a scene with Satyr and Satyress), separated by herms. A lid with a pinnacle ending in a ball is decorated with festoons, masks, and shields. Its dimensions are 8 cm in height and 6 cm in diameter.
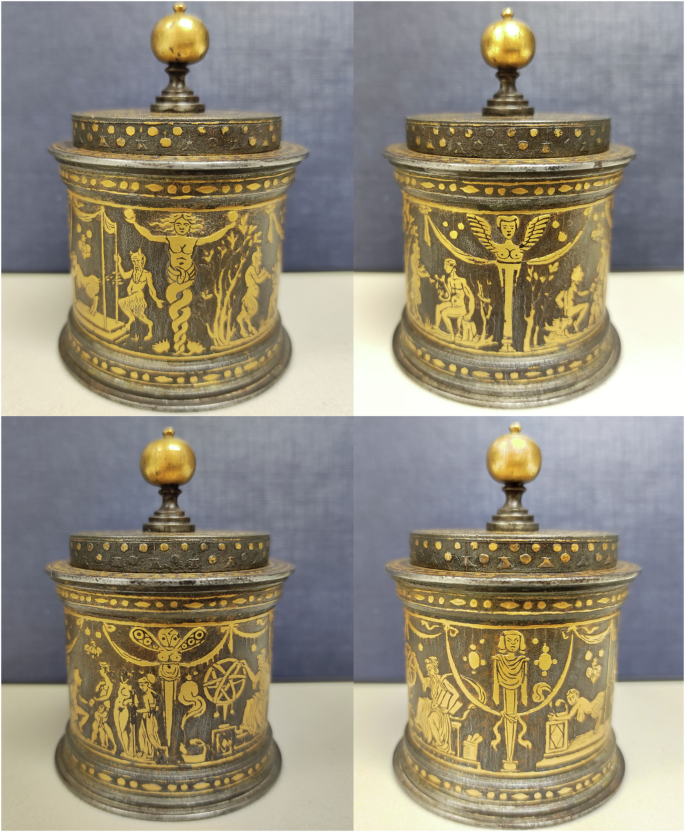
Images of the four different sides of Inkwell with lid.
Measurement procedure
The developed spectrometer is based on a GEM detector, which requires a specific preparatory procedure to deal with effects like non-uniformity of the gas amplification factor across the active area or charging up effects resulting in drifts of gas amplification factor in time and its dependence on the local count rates across the detector area. A detailed description can be found in ref. 41, here only the major steps are mentioned: (1) detector high voltage bias applied for at least 10 h before the planned measurement, (2) measurement of the XRF radiation from a pure copper calibration plate, (3) placement of the object in the holder and adjustment of the measurement head with respect to the object plane, (4) selection of the investigation area and calculation of the measurement frames, (5) illumination of the first frame for 15 min before collecting any data, (6) scanning the object frame by frame according to a predefined route (automatic procedure). The movement and positioning plan of the measurement head is carried out using the robot control panel according to the embedded dedicated software.
The key measurement settings for all the investigated objects are summarised in Table 1.
Methodology of data analysis
To handle all analysis tasks and provide relatively easy data treatment, a custom-developed software based on the Python programming language using the NumPy package for scientific computing has been implemented51,52. After initial data pre-processing, that is, data merging, application of all necessary correction, calibration procedures, etc., the final data set in the form of a compressed numpy array (two axes correspond to the X and Y coordinates of the pixel and the third to its energy spectrum) was created. The overall procedures of data analysis are described in ref. 41.
After the data were processed, the final elemental distribution maps were generated. For both investigated objects listed in Table 1, two different methods were applied: (1) ROI analysis, and (2) NMF. For generation of the ROI maps, individual ROIs were manually selected using the cumulative energy spectrum constructed using the data from the entire investigated area of the given object. The maps from NMF analysis were derived using algorithms implemented in the hyperspy library53.
Selection of the above methods results mainly from our previous work41, in which we evaluated and compared in details performances, advantages, and limitations of standard ROI method and NMF factorisation algorithm. Briefly, while the ROI method works perfectly in the case of well-separated characteristic peaks of individual elements, it fails completely for spectra with low-energy resolution. The NMF analysis provided significant enhancement in selectivity of the elemental analysis, including detection of elements completely invisible in the cumulative spectra.
In general, the NMF algorithm performs decomposition of the input data matrix using an orthogonal transformation into two smaller sets: the eigenvectors (basis vectors) and the loadings, which describe how much each data point contributes to a particular component. Due to the constraint of the factorisation results to non-negative values only, individual components fully reflect the nature of XRF data, which allows for their relatively simple identification. Therefore the NMF algorithm is very widely used tool that supports the analysis of spectroscopic data of cultural heritage. In particular, it allows for the separation of overlapping XRF spectra of two different elements. However, it should be noted that factor representation cannot be interpreted quantitatively in terms of the concentration of elements in the investigated objects. In case of data obtained from our spectrometer, individual basis vectors can be interpreted as XRF spectrum of single elements, while individual loadings as distribution maps of these elements.
When discussing the results presented, it should be noted that the energy resolution of the GEM detector is limited, as mentioned before. Another specific feature of the GEM is the appearance of a satellite energy peak in the energy spectrum associated with each characteristic energy line. This escape peak corresponds to the characteristic energy lowered by 2.95 keV in the case of the argon-based gas mixture employed, which in turn corresponds to the characteristic energy of argon. Therefore, combining the two above mentioned methods helps to resolve some ambiguities which may occur during the interpretation of the data.
Results and discussion
Fragment of ornament from a church altar
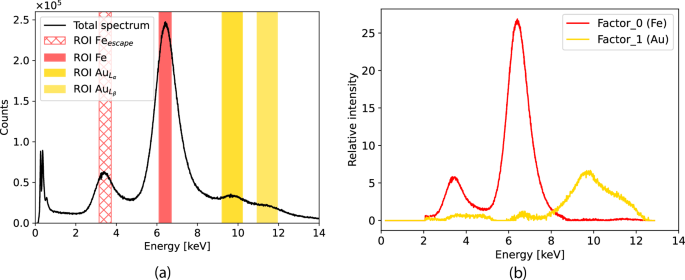
The results obtained for the object are shown in Figs. 5 and 6. Figure 5a shows the total cumulative spectrum collected from the entire investigated area with the selected ROIs. Due to the high complexity of the spectrum and the limited energy resolution, the assignment of only a few energy peaks with the corresponding energy line is straightforward (copper, iron, and calcium Kα lines). All additional ROIs were added in the second iteration, after observations of the results obtained from the NMF analysis. Although the wide and long tail of the spectrum may suggest the potential occurrence of elements with higher fluorescence energies, their identification and selection of specific ROI ranges based only on the spectrum cannot be justified. Each such attempt should be considered essentially as a ‘blind’ search.
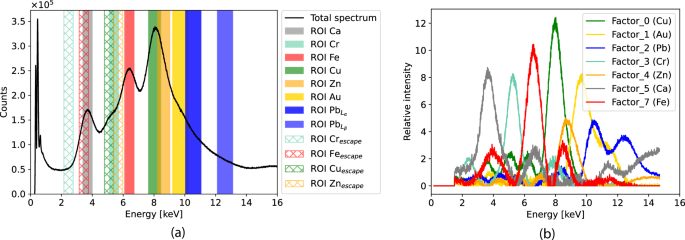
Cumulative spectrum for the whole measured area with marked 12 ROIs (a); factor composition obtained from NMF analysis (b).
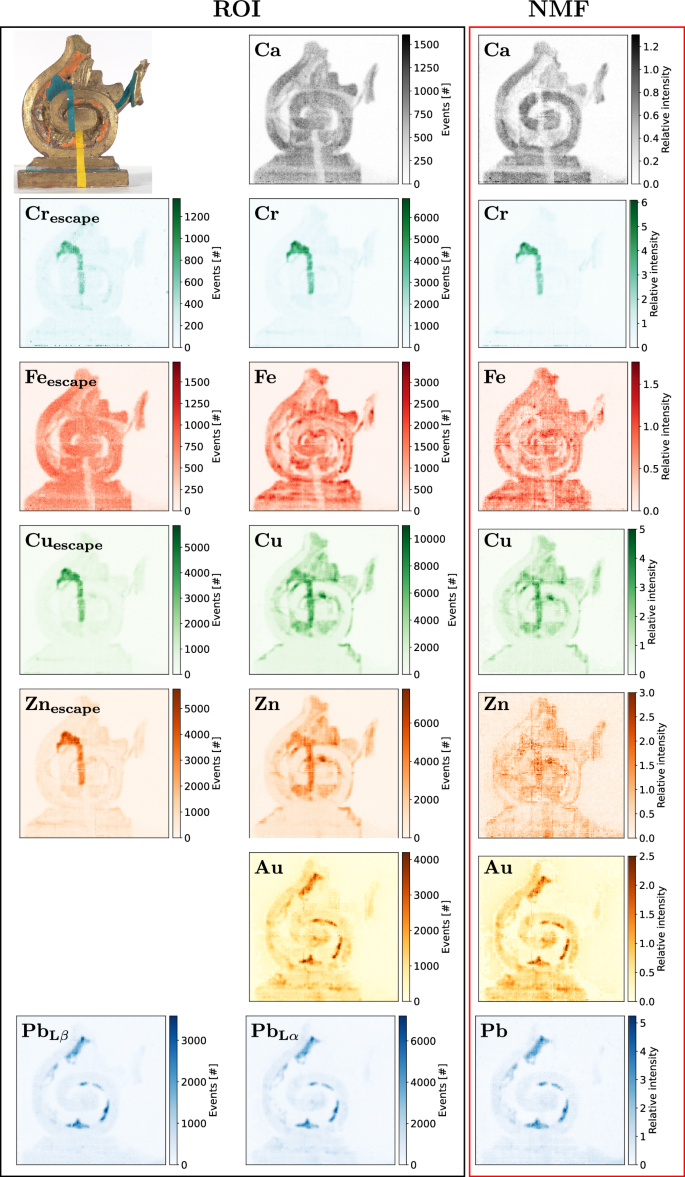
Elemental distribution maps obtained for the Fragment of ornament from a church altar by two different analysis methods: ROI (first two columns) and NMF (third column).
Figure 5b shows the composition of the factors obtained from the NMF analysis. The NMF reveals seven quite easily distinguishable factors, which can be assigned to the following set of elements: calcium, chromium, iron, copper, zinc, gold, and lead. The comparison of maps of loadings obtained from NMF analysis and the intensity maps for all ROIs marked in Fig. 5a spectra is shown in Fig. 6. Some particular observations can be formulated based on the maps obtained.
Despite irregular shapes of the object, the stitching procedure of the adjacent frames (object measured in four individual frames) is working correctly. No significant artefacts or discontinuities between the combined areas can be seen on the maps obtained.
The observed spatial resolution of the system remains constant and completely independent of the depth at which a given fragment of the investigated area is located at the object’s surface. This conclusion is confirmed by visual inspection of the horizontal insertion painted using chrome green paint. Despite a 2 cm difference in depth at which fragments of insertions are placed, the observed spatial resolution at each position is identical, i.e., the sharpness of edges remains the same along the insertion.
The chromium, zinc, gold, and lead signals detected by the NMF method are in agreement with the ROI maps, which clearly confirm the presence of these elements in the investigated object. The zinc and gold elemental distributions require an additional comment. Unlike the ROI technique, the NMF method indicates a complete absence of zinc in the area covered with chrome green paint, as expected. As already mentioned, during the preparatory process, the considered area, in addition to the chrome green paint, was additionally covered with a layer of copper-rich malachite. Hence, it is not surprising (due to the close proximity of the copper and zinc Kα lines and the limited energy resolution of the system) that it appears on the zinc ROI map. Therefore, the map obtained by the NMF method is considered correct. In the case of gold distribution, both the ROI and the NMF techniques provide virtually identical, consistent maps. However, both contain a dominant lead signal. Due to the relatively close proximity of the Lα lines of both elements (difference of approximately 0.84 keV), this effect is expected for the ROI method. In contrast, in the case of the NMF method, a better separation of these two signals could be expected. However, because of the large number of elements present in the data set and limited statistics, separation is limited.
The ROI maps corresponding to escape peaks of copper and zinc are virtually the same as the ROI map of chromium. This is not surprising, as the energies of all three considered signals are located in very close proximity. Since the chromium signal has a much higher intensity than the others, it dominates the maps of both escape peaks. This particular case proves the advantage of the NMF method. On the map of copper distribution, the signal from chromium is much weaker, and on the map of zinc it is hardly noticeable.
The spatial distributions of iron and calcium obtained using the ROI and NMF methods are consistent with each other. However, it should be noted that for calcium, the NMF version has higher selectivity (contrast). Similarly to the previously described chromium case, the significantly higher intensity of the calcium signal in relation to the signal of the iron escape peak results in the ROI map of the latter does not differ from the ROI map for calcium. Here, it is worth noting the area of reduced intensity, which corresponds to the location of the painted yellow stripe observed in the distributions of both considered elements. In addition, a vertical stripe of reduced intensity is also visible in the upper part of the calcium NMF map. This area corresponds to the location of the chrome-green painted inserts. This is due to the absorption of low-energy X-ray photons from calcium and iron in the overlaying stripe.
Although the signal related to the yellow vertical stripe was not detected directly by any of the applied analysis techniques, valuable information was revealed in the calcium and iron maps. That is, the element that creates this pigment must have a high absorption capacity. By combining this information with the other results obtained, it is possible to identify the considered yellow pigment using the deduction technique. Since the yellow strip is not represented by lead, zinc, iron, chromium, or calcium maps, it excludes the following set of pigments: naples yellow, lead-tin yellow, massicot, zinc yellow, chromium yellow, lemon yellow, yellow ochre, and Indian yellow. As a result, the filtration carried out above leaves only four potential candidates: orpiment (king’s yellow), cobalt yellow, bismuth-vanadate yellow, and cadmium yellow. If an arsenic-rich orpiment was used, its signal would certainly be observed on the lead map (fluorescence energy line of (A{s}_{{K}_{alpha }}approx P{b}_{{L}_{alpha }})). A similar situation occurs for cobalt and bismuth-vanadate pigments, for which the base elements have fluorescence lines located in close proximity to the iron, lead, and chromium energy lines, respectively. In the case of cobalt yellow, its signal would be visible on the iron distribution map, while for bismuth-vanadate yellow on the lead and chromium maps. Because none of the described situations is observed, the conclusion is to reject the three considered candidates and to associate the yellow strip with the only remaining pigment, that is, cadmium yellow. This is in agreement with the knowledge possessed a priori and proofs that despite the lack of direct detection of a given element and moderate system energy resolution, pigment identification using some indirect solutions is still possible.
Similarly to the cadmium yellow pigment discussed above, the silver signal was also not detected. Because of the anode material of the X-ray lamps (molybdenum), both silver and cadmium are identified in the fluorescence spectrum by the L-line only. Because emission efficiency of L-lines of silver and cadmium are relatively low (about seven times lower compared to the L-line of lead), their contributions to such a complex spectrum is virtually negligible. However, the presence of these elements is indicated by absorption of excited low-energy X-rays, in particular, of calcium characteristic X-rays.
The analysis of the Fragment of ornament from a church altar described in the above section demonstrates the capabilities of the system and shows the complexity of the entire data analysis process. For the next object under investigation, although both techniques were applied, only the analysis results of the best-performing method are presented.
Inkwell with lid
Figure 7 shows the cumulative XRF spectrum and the compositions of factors received by the NMF method for the investigated CH object Inkwell with lid. Although four different sides of the object were measured, no differences were observed for the cumulative spectrum and the factors obtained. Thus, Fig. 7 only shows the results for one selected measurement frame.
Cumulative spectrum for the whole measured area with marked four ROIs (a); factor composition obtained from the NMF analysis (b).
The investigation carried out resulted in the detection of iron and gold elements. The elemental distribution maps obtained for each of the four different measurement frames are shown in Fig. 8. The iron signal is observed over the entire area of the examined object, except for the fragments corresponding to the gold decorations. The distribution obtained is expected and fully understood, as regions of decreased iron intensity correspond to the outer gold layer, which attenuates the signal from iron. The detected element should only be identified with the construction material of the inkwell, not with the pigment. As mentioned above, the recorded signal of gold corresponds to the golden decorations depicting ancient scenes, festoons, masks, and the ball located at the top of the lid. Therefore, the reconstructed elemental distributions fully confirm the use of gold as a decorative material.
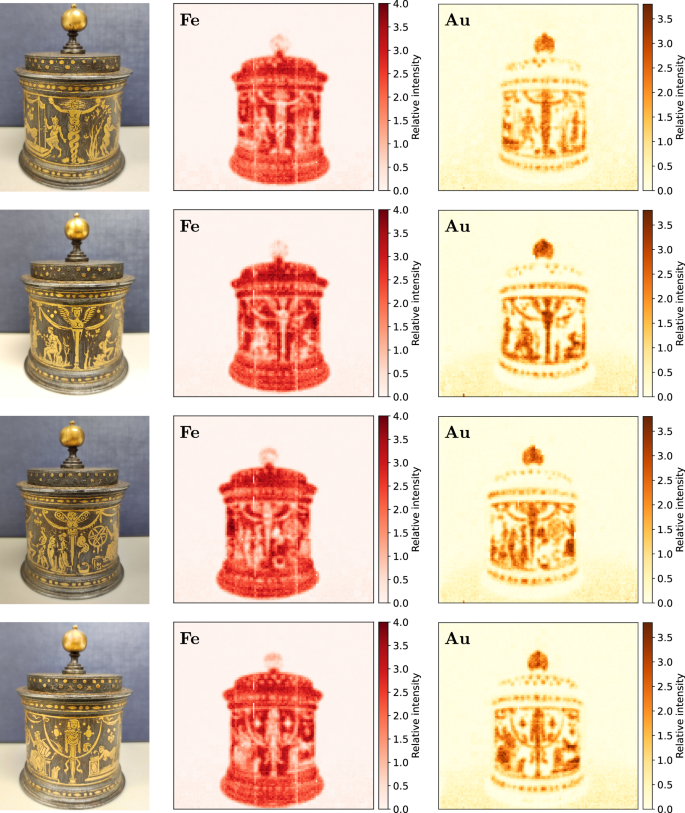
Elemental distribution maps obtained for the Inkwell with lid using the NMF analysis method.
The Inkwell with lid object, due to its cylindrical shape, is suitable for quantitative studies related to the infinite depth of field of the pinhole camera. The performance of our system regarding the expected infinite depth of field can be assessed by calculating the Laplacian of different parts of the image using the The OpenCV Library and Laplacian() function54. Here, the idea of using the Laplacian algorithm is to find areas of rapid changes in each part of the image, and then calculate the variance for the parts considered based on the Laplacian output in a similar way to that presented in ref. 55. We have divided the image of each four sides of the object into five vertical slices as shown in Fig. 9.
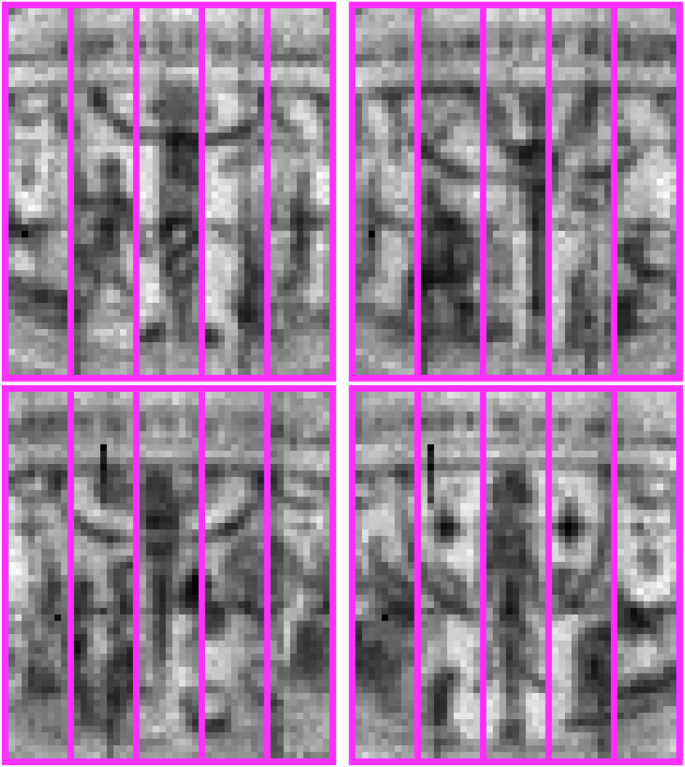
Original XRF images of each side (iron maps) of the central part of the Inkwell with lid object, with marked fragments used for variance estimation (see also Table 2).
These areas were chosen to investigate the effect of increasing the distance between the camera and a given slice—see Fig. 4. The Laplacian operator (which is effectively an edge detection algorithm) is applied to each fragment. Following edge detection, the variance is calculated to measure the amount of details in each slice. Due to the nature of the variance, no specific threshold value can be attributed to out-of-focus images. However, the higher its value, the greater the number of detectable details in the image. Although the actual values of variance do not provide a direct measure of the depth of field, they can be used to compare the fragments. For infinite depth of field, the variance of the Laplacian should be similar for all fragments, provided that the compositions of different fragments comprise a similar number and distribution of details. In addition, we normalised the variance values using overall average from all four object sides to ease of comparison.
The results are shown in Table 2. There are no significant differences between the fragments, which indicates that the depth of field is not affected by the variable distance between the object and the pinhole camera. This confirms the large depth of field of the developed system and its ability to image 3D objects.
Conclusions
This work presents the capabilities and performance of the developed XRF full-field imaging spectrometer applied to elemental mapping of 3D objects. The pinhole camera optics offer in principle infinite depth of field of the imaging system and indeed this feature has been clearly demonstrated in two case studies involving 3D objects.
Measurements and data analysis were performed on two different objects: a wooden fragment of a Rococo altar ornament and a decorated inkwell with cylindrical form. In both objects, the depth of the imaged areas varies up to 3 cm and no noticeable decrease in spatial resolution was observed. Such a range of focal depth is beyond the reach of MA-XRF spectrometers that use a focused X-ray microbeam.
It should be noted that the imaging results presented in the paper were obtained for a fixed geometry of the investigated object and the spectrometer head. Therefore, no manipulation of the object and/or the instrument is required during a given measurement session. In the case of valuable historical objects, this feature is greatly appreciated by art historians and conservators.


Responses