Seismic response of masonry pagodas considering soil-structure-interaction (SSI) effect and CFRP reinforcement
 effect and CFRP reinforcement")
Introduction
The construction of Chinese masonry pagodas began in the Han Dynasty and has developed over thousands of years, forming a unique architectural style and structural system. These ancient pagodas not only show the wisdom and creativity of the Chinese nation in the art of architecture but also carry the functions and meanings of religion, culture, society, and other aspects in the long history. As a special cultural heritage, ancient pagodas represent the treasures of human civilization and are witnesses to history, and earthquakes are one of the major natural disasters leading to the destruction of masonry pagodas1. Historically, many famous pagodas have been damaged or even collapsed due to earthquakes. The study of the seismic response of existing masonry pagodas can provide a scientific basis for their protection and restoration. At present, scholars at home and abroad have conducted a large number of studies on the seismic performance of masonry pagodas and achieved certain results. However, considering the complexity of seismic effects and the specificity of masonry structures, in-depth research on the seismic response of masonry pagodas still has important scientific value and application prospects.
Due to the complex structural system of ancient towers, there are usually two schemes, monolithic modeling2,3,4 and hierarchical modeling, and nonlinear dynamic behavior is a major issue in the study of ancient masonry structures. Li, M.D. et al.5 defined the nonlinear mechanical parameters of the contact surface between rigid blocks. Angela, F. et al.6 reproduced complex mechanical behavior between blocks and predicted the vulnerability assessment of historic masonry buildings. Bui, T.T. et al.7 used the discrete element method (DEM) to predict the final load and damage mode analysis of dry joint masonry walls under in-plane and out-of-plane loading. Wu, X.Q. et al.8 used two modeling approaches to compare them separately, and the hierarchical modeling approach provided higher computational accuracy and more realistic simulation results, especially when dealing with complex structures and material property variations, while holistic modeling has advantages in terms of computational efficiency and simplifying assumptions.
A large number of scholars have made corresponding studies on the SSI effect of ancient towers. Lu, J.L. et al.9 tested the dynamic characteristics of the model and its dynamic response under the excitation of seismic waves by designing and producing the structural model of the tower and the foundation model box, carrying out the shaking table test, and inputting seismic waves with different intensities. An, Y.J. et al.10 used equivalent linearized foundation soil and nonlinearized masonry materials to model Wenfeng Pagoda in tilted and un-tilted conditions by considering the geometric nonlinearity of the soil and structure separation slip.
Li11 combined field tests and numerical simulations with 3DEC modeling to consider brick and mortar as a rigid block assembly and introduced cohesive boundaries to account for soil–structure-interaction. Mitropoulou, C.C.12 considered three foundation models and showed that SSI has a significant impact on structural vulnerability assessment for high-rise buildings and a lesser impact for low and medium-rise buildings, but did not elaborate on the differences in the applicability of the different models for different site conditions. Sextos, A.13 assessed the influence of local site effects on building damage patterns through field investigations, and found that local site effects such as stratigraphy and topography were the main cause of building damage concentration in some areas, and also pointed out that factors such as the age of the buildings led to the serious damage in some villages, but the methodology of the site effect analysis had limitations. Tomeo, R.14 suggested that SSI has a significant effect on the seismic response of structures and simulated the SSI effect by plane-strain soil-structure finite element modeling and structure-spring method, but the study mainly focused on two-dimensional frame structures, and the applicability of three-dimensional is yet to be explored15. The effect of SSI-induced period lengthening on the spectral acceleration of hard rock under soft soil conditions and the change in soil extension were found, indicating that the effect of soil deformation on structural demands is more pronounced, but the complexity of soil–structure interaction is not sufficiently investigated. Brunelli, A.16 and Angiolilli, M.17 et al. considered the effects of soil-foundation–structure interactions on structural response with two types of soil conditions: free-field and bedrock conditions. Brunelli focuses more on quantifying the effects of site amplification and SFS interactions on susceptibility curves and validating the reliability of the specification method, but the linear equivalent method of simulating soil–structure interactions has limitations. Both agree that local mechanisms dominate at moderate to high damage levels under bedrock conditions and that internal mechanisms mainly control the overall behavior at all damage levels under free-field conditions.
An in-depth study of the seismic response characteristics of existing masonry pagodas is an important scientific foundation and practical guidance for their protection and restoration. At present, scholars at home and abroad have carried out extensive research on the seismic performance of masonry pagodas and adopted a series of strengthening measures. Man Zhou et al.18 introduced the causes of the tilting of the Dinglin Temple Pagoda in Nanjing and the corrective techniques, focusing on the correction of the pagoda body and foundation strengthening. Zhang, G.W. et al.19 analyzed the seismic performance of a wooden tower through field tests and finite element modeling, with a special focus on the effect of emergency strengthening methods on the seismic performance of the tower. Woo-Young Lim et al.20 investigated the flexural performance of granite reinforced with stainless steel rods in the restoration of a historical stone tower. Hao, W.M. et al.21 investigated the seismic performance of an ancient pagoda wall reinforced by GFRP strips embedded in the horizontal mortar joints, with a major focus on the improvement in seismic performance of the reinforcement methods. The main focus was on the enhancement of seismic performance by the reinforcement method. Zhou, Y.22 used the modified epoxy resin (MER) penetration technique to non-destructively reinforce ancient masonry towers. In this paper, we will use the new material CFRP to strengthen the ancient tower, which has been studied by a large number of scholars and proved the superiority of this material.
Ancient pagoda overview and determination of experimental parameters
Ancient pagoda overview
The pagoda studied in this paper is located in southwest China, for a hexagonal 6-stage dense eaves solid brick and stone tower, digital model as shown in Fig. 1, the tower height of 29.76 m, the tower has a rotary ladder to ascend to the top, the tower body is a dense eaves structure, by the brick masonry, the front six sides of the brick masonry decorative coupon door, the tower body detailed dimensions as shown in Table 1, at present the pagoda is relatively well-preserved, it is a key object of cultural relics protection.
 effect and CFRP reinforcement")
a 3d model, b elevation model, and c top view of the model.
Mechanics model
By measuring the data of the tower, the modeling software SolidWorks was used to model the tower in a monolithic manner, and the doorways, as well as the tower eaves were simplified during modeling. The analytical model was standardized according to the stress–strain relationship curve predicted by Laura, V.23, with Eq. (1) for the compressive stress–strain relationship and equation Based on the experiments, as shown in Fig. 2, the corresponding parameters of the masonry were derived24, masonry density ρ = 1800 kg/m3, modulus of elasticity E = 1800 MPa, Poisson’s ratio μ = 0.15, the design value of compressive strength ({f}_{{rm {c}}}) is 3.15 MPa, peak compressive strain ({varepsilon }_{0{rm {c}}}) is 0.04, the mean value of axial tensile strength ({f}_{{rm {t}}}) is 0.157 MPa and the corresponding tensile strain is 0.00012.
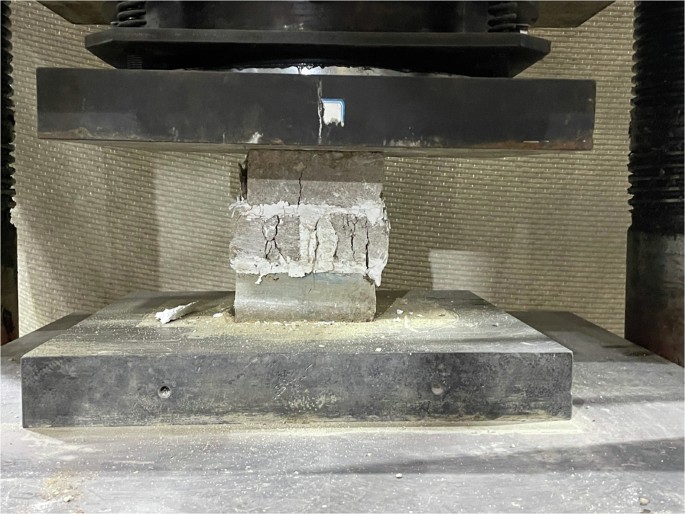
Compressive test.
In the equation:
n reflects the hardening behavior of the material before reaching peak stress.
x is defined as the ratio of the actual strain ε to the characteristic strain εcm.
({f}_{{{rm {cm}}}}) represents the compressive strength.
({varepsilon }_{{rm {{cm}}}}) represents the peak compressive strain corresponding to the compressive strength.
({{rm{sigma }}}_{{rm {c}}}) represents the shape parameter of the compressive stress–strain curve.
({{rm{sigma }}}_{{rm {t}}}) represents the shape parameter of the tensile stress–strain curve.
For masonry materials and concrete are consistent with brittle damage characteristics, so in this study, the CDP model is used to simulate masonry tensile and compressive damage, according to the tensile and compressive damage formula studied by Si Jianhui25, as shown in Eqs. (4) and (5). Input the material parameters into ABAQUS. When the structure is subjected to seismic loads, cracking events may occur. At this stage, the finite element program can automatically correct the elastic modulus in the material properties, so confirming the correctness of the simulation.
In the equation:
({{rm{varepsilon }}}_{{rm{c}}}) represents the compressive strain in the masonry.
(eta) is the ratio of the masonry’s elastic secant modulus to the initial elastic modulus, with a value of 1.633.
({D}_{{rm{c}}}) represents the uniaxial compressive damage variable of the masonry.
({{rm{varepsilon }}}_{{rm{t}}}) represents the tensile strain in the masonry.
({D}_{{rm{t}}}) represents the uniaxial tensile damage variable of the masonry.
Both the compressive and tensile damage variables have values in the range of 0–1, indicating the extent of damage experienced by the masonry under compressive and tensile loading conditions.
Numerical model
Establishment of solid model
According to the actual size and site category of the model, the foundation base-fixed model and SSI model were created separately, as shown in Fig. 3. The pagoda model adopts C3D4 cell type, with a total of 10,011 nodes and 41,151 cell grids. Foundation soil layer is a three-dimensional solid unit, the width of the site is greater than the lateral size of the structure by 5 times, basically can be ignored the influence of the lateral boundary on the dynamic response of the structure26, so the selected width of the soil body is 50 m, the depth is 30 m, and the physical and mechanical parameters of the soil layer are as shown in Table 2, which adopts C3D8R cell type, with a total of 35,599 nodes and 32,642 cell grids. In order to simplify the calculation, the mesh of the soil body adopts linear mesh, and the mesh of the contact surface between the soil body and the structure is appropriately encrypted to ensure that the nodes overlap and improve the accuracy of the calculation.
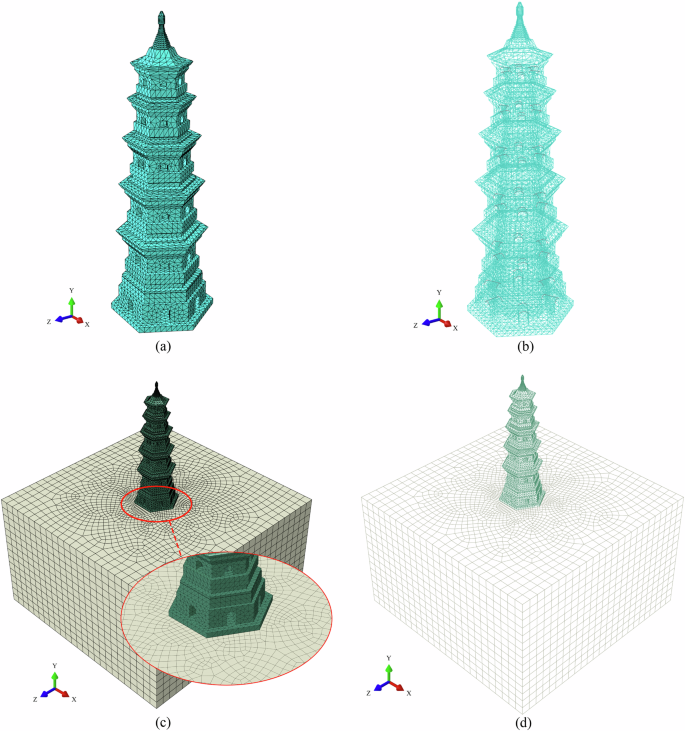
a Base-fixed model, b perspective view of base-fixed model, c SSi model, and d perspective view of base-fixed model.
The realization method of viscoelastic artificial boundary
The analysis of soil–structure dynamic interaction requires the introduction of artificial boundaries to simulate the infinite domain, the theory of the equivalent linear model of the soil body is more complete, the use of EERA iteration to obtain the equivalent shear modulus and equivalent damping ratio of the soil layer27, in the ABAQUS software, the viscoelastic boundaries of the spring damping unit can be simulated by simulating the contact of the spring unit fixed at one end as well as the viscous damper unit as shown in Fig. 4.
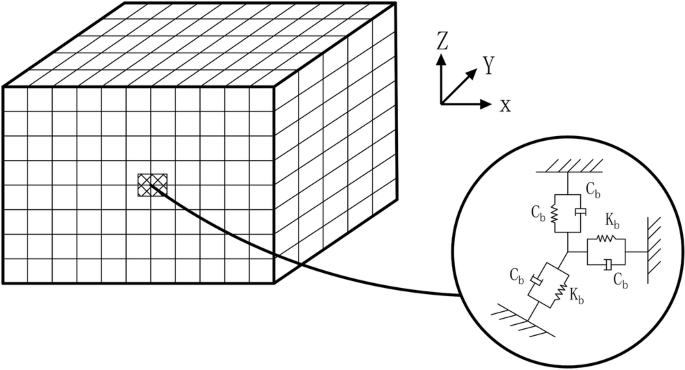
Schematic of viscous-spring artificial boundary.
Viscous dampers are mainly used to model the absorption of scattered wave energy in the far-field, while springs have been used to model the elastic resilience of the far-field foundations, where the equations for springs and dampers28 are as given below:
In the equation:
({rm{K}}_{{text{BT}}}) and ({rm{K}}_{{text{BN}}}) represent the stiffness coefficients of tangential and normal springs, respectively.
({C}_{{{{BT}}}}) and ({C}_{{{{BN}}}}) represent the damping coefficients of tangential and normal dampers, respectively.
αT and αN are the correction coefficients of the viscoelastic boundary.
R is the distance from the incident wave source to the artificial boundary point.
ρ and G are the density and the shear modulus of the medium, respectively.
({C}_{{rm{S}}}) and ({C}_{rm{{P}}}) are the shear and longitudinal wave speeds of the medium, respectively.
E and ν are the elastic modulus and Poisson’s ratio of the medium, respectively.
When applying seismic waves through a viscoelastic artificial boundary, the seismic waves need to be converted into equivalent nodal forces and applied to each node. This process needs to ensure that the displacements, velocities, and stresses generated at the nodes are equal to the displacements, velocities, and stresses under the action of the seismic wave, as calculated in equation29:
In the equation:
({rm{A}}_{{text{b}}}) is the area of influence of the node, i.e., the shaded part in Fig. 4.
({rm{K}}_{{text{b}}}) is the 3 × 3 stiffness matrix; ({rm{u}}_{{text{b}},{text{ff}}}) is the node displacement vector.
({rm{C}}_{{text{b}}}) is the 3 × 3 damping matrix; ({{C}}_{{text{b}}}{{dot{rm{u}}}}_{{text{b}},{text{ff}}}) is the node velocity vector.
σb,ffn is the node displacement vector.
n is the cosine vector of the direction normal to the outside of the boundary plane.
Within a sufficiently large soil domain, the energy of seismic waves can be freely scattered at the boundary without inducing significant effects on the structure from reflected waves at the boundary. In this case, a fixed boundary condition can be used, i.e., the soil displacement at the boundary is assumed to be zero. This boundary condition is suitable for modeling the propagation of seismic waves in semi-infinite media where the effect of boundary reflections is negligible. This is usually used when the soil layer is thick, or the soil domain is large in extent. In contrast, in this study, by explicitly simulating a finite soil body in the model, the nonlinear properties, stress-strain relationship, and plastic deformation of the soil body can be better taken into account, thus improving the reliability of the analysis results. In the SSI analysis, ground stress equilibrium is first required to ensure that the initial stress state of the model is in accordance with the actual situation. This can avoid errors in the analysis results due to inaccurate initial stress state. After that, according to the results of the ground stress balance, springs and dampers are set up, which can more accurately simulate the interaction between the soil and the structure, including the stiffness and damping characteristics of the soil, and simulate the absorbing boundary conditions at the boundaries of the model, which reduces the errors due to the boundary reflected waves, and thus more realistically reflects the response of the structure under seismic actions. This method is not only applicable to regular soil models but also can be used for more complex heterogeneous soil models, as well as considering the case of seismic wave incidence in different directions. By introducing cohesive boundary conditions, the soil size sensitivity check is effectively handled without the need for large-scale simulations of soil size changes.
Since the actual computational models usually have hundreds to thousands of nodes after meshing, and the displacement and velocity time range of the plasmas at each node are different, the equivalent nodal force will be different from node to node. It would be a very tedious and error-prone process to manually perform the application of the viscoelastic boundary and the calculation of the equivalent nodal force. In order to solve this problem, this paper utilizes the secondary development of ABAQUS on the open-source nature of the Python language and applies the corresponding Python script to realize the batch automatic application of equivalent nodal force in ABAQUS. This method greatly simplifies the pre-processing process and improves the computational efficiency and accuracy.
The spring parameters in Table 3 are obtained through the calculation of the ground stress balance. KBT and KBN reflect the ability of the soil body to resist deformation in different directions, and these stiffness coefficients affect the displacement and deformation of the structure in the soil body when the SSI effect is taken into account, and larger stiffness coefficients imply that the soil body restrains the structure more strongly, and the displacement and deformation of the structure will be relatively small. CBT and CBN represent the damping effect of the soil body on the movement of the structure in different directions. CBT and CBN represent the damping effect of the soil on the motion of the structure in different directions. When the SSI effect is considered, the damper coefficient affects the vibration response of the structure, and larger damper coefficients cause the vibration of the structure to decay faster and reduce the dynamic response of the structure. When the SSI effect is not considered, the foundation of the structure is usually assumed to be completely rigid, and the response of the structure mainly depends on the stiffness of the structure itself and the external force. When the SSI effect is considered, the flexibility of the soil body will make the foundation of the structure no longer completely rigid, and the deformation of the soil body will lead to an increase in the displacement of the structure, thus increasing the response of the structure. The change in soil damping is also an important factor. When the SSI effect is not considered, the damping effect of the soil body is usually ignored. When the SSI effect is considered, soil damping will have an effect on the vibration of the structure. However, soil damping does not always reduce the response of the structure. In some cases, soil damping may interact with the vibration frequency of the structure to induce a resonance phenomenon, thus increasing the response of the structure. In addition, the interaction between the structure and the soil body should not be neglected. Considering the SSI effect, the vibration of the structure will cause deformation of the soil, which in turn will affect the response of the structure. This interaction may lead to some unfavorable effects that increase the response of the structure.
Vibration mode and frequency
In order to determine the dynamic features of the pagoda and soil with structural Rayleigh damping, the Block Ianczos method is employed to conduct a modal analysis of the base-fixed model and SSI model. The findings are given in Figs. 5 and 6, and the natural frequencies of the two models are shown in Table 4.
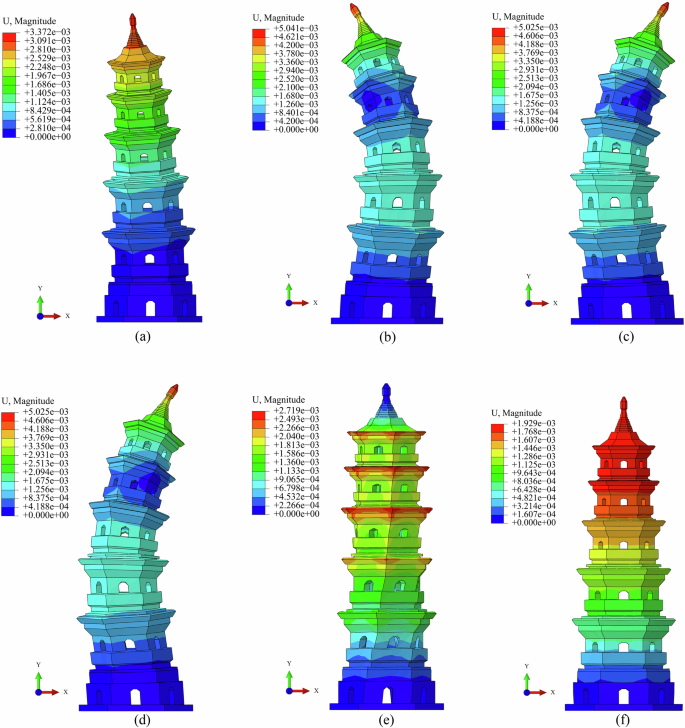
a First mode, b second mode, c third mode, d fourth mode, e fifth mode, and f sixth mode.
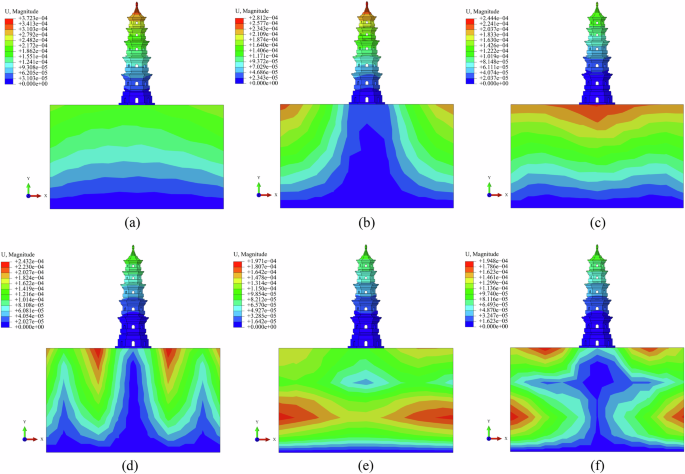
a First mode, b second mode, c third mode, d fourth mode, e fifth mode, and f sixth mode.
The cumulative mass fractions of the vibration modes of each order of the two models are shown in Table 5, and it can be concluded from the comparison that the vibration modes of the structure are mainly translational along the X-direction and vertical vibration along the Y-direction, and the motion is dominated by the horizontal translational compared with the vertical vibration. Based on Code for seismic design of buildings (GB50011-2010) and Technical specification for concrete Structures of tall building (JGJ3-2010). The effective mass of the selected vibration modes has exceeded 90% of the total mass of the model in both horizontal and vertical directions, which satisfies the required number of vibration modes.
Selection of damping parameters
The Rayleigh damping model is a linear damping model that assumes that the total damping of the structure is obtained from a linear combination of the mass matrix and stiffness matrix of the structure. It can be expressed by the following equation:
where (left[Cright]) is the damping matrix of the structure, (left[Mright]) is the mass matrix of the structure, ([K]) is the stiffness matrix of the structure, α and β are the mass damping coefficient and stiffness damping coefficient, respectively.Considering that the damping ratio of the masonry tower is in the range of 0.01–0.0530, and the different damage cracking of the tower under the three seismic protection levels, the damping ratio is defined to be 0.02 under small quake, 0.03 under medium quake, 0.04 under large quake, and the damping ratio is calculated to be 0.04 under large quake for the tower. damping ratio of 0.02 for small earthquakes, 0.03 for medium earthquakes, and 0.04 for large earthquakes. The α and β of the tower and the lower soil were calculated as shown in Table 6. The parameters were sequentially passed into the ABAQUS model for subsequent calculations.
Selection of seismic wave
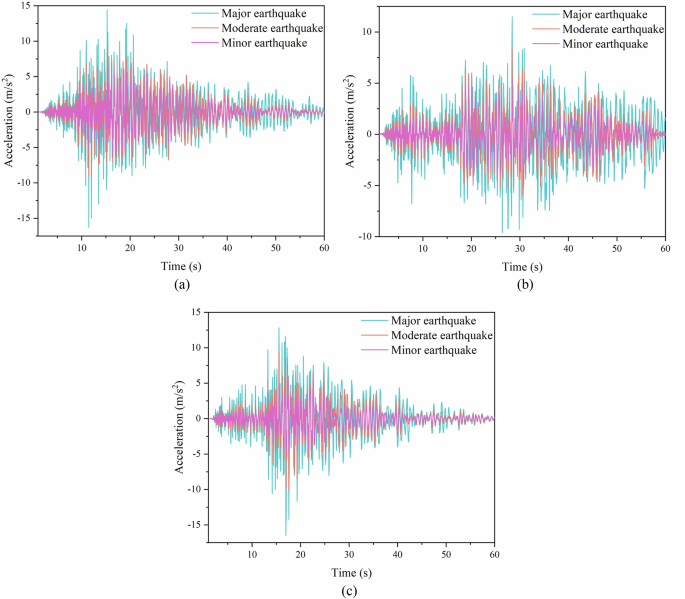
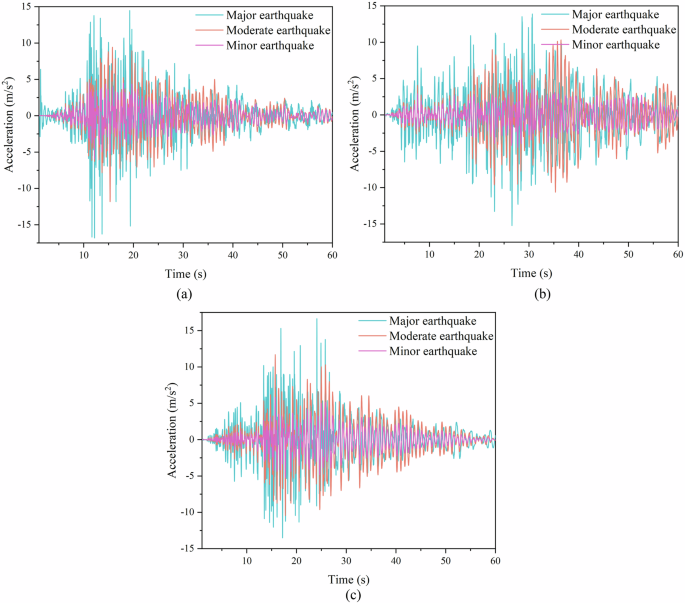
The tower is located in a class II site with a seismic intensity of 8 degrees. Three natural ground shocks are selected and the detailed information of these three ground shocks is shown in Table 7. Seismic waves are input according to the horizontal X: vertical Y: horizontal Z direction = 1:0.65:0.85. The peak acceleration of small, medium, and large earthquakes is adjusted according to 0.07×g, 0.2×g, and 0.4×g, and Fig. 7 shows the three ground shocks with 0.4×g as an example. Figure 8 shows the acceleration response spectrum curves for the selected ground shocks.
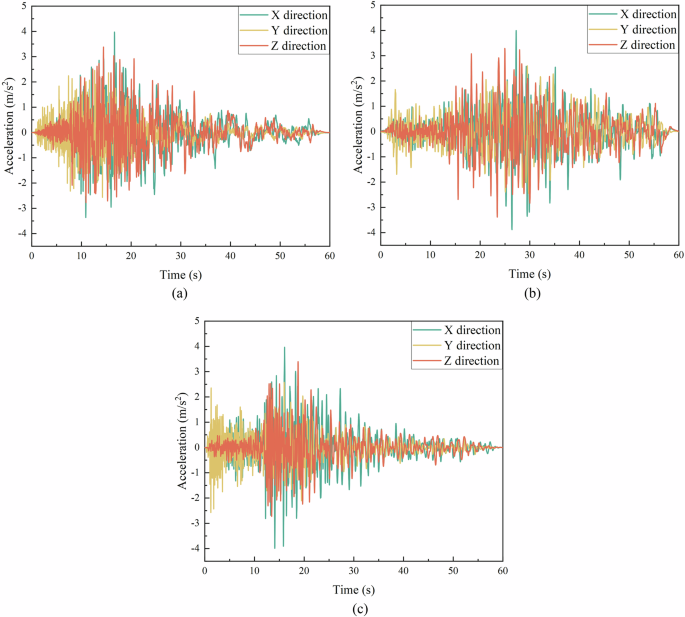
a El Centro, b Villa Park, and c San Francisco.
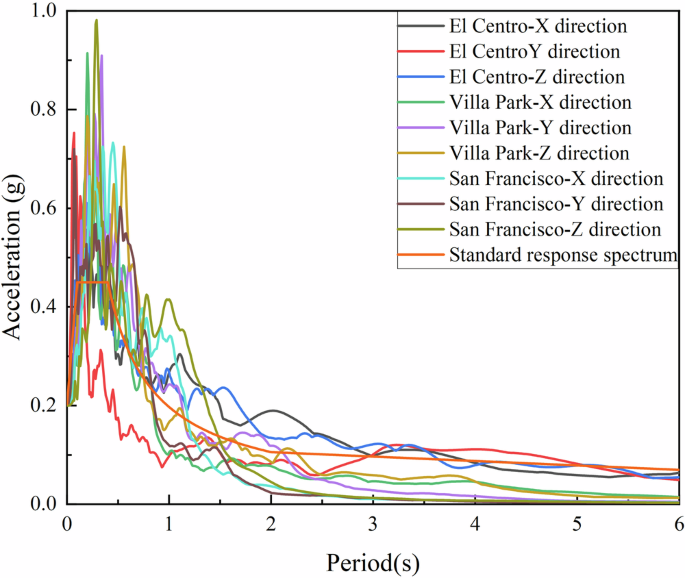
Acceleration response spectrum curve.
Novikova, E.I.31 explored the physical basis and empirical equations for ground shaking duration based on earthquake magnitude, epicenter distance, geological conditions, and local soil conditions. Lee, J.32 proposed an empirical predictive relationship using a nonlinear mixed-effects regression technique based on data from 620 horizontal motions to fit the predictive model. This research calculates the relative duration based on 10% of the peak ground acceleration (PGA) established by ground shaking as a defined threshold, indicating that ground shaking possesses an effective duration.
Seismic response
The base-fixed model and SSI model under major earthquake (PGA = 0.4×g) are selected for one-dimensional (1D), two-dimensional (2D) and three-dimensional (3D) seismic response analysis to calculate the seismic response of the tower under seismic waves, and the locations of the acceleration and displacement output points of the different floors and the node numbering are shown in Fig. 9. The specific output points are extracting the displacement data below the doorways of each floor of the model, the acceleration data below the gable end of each floor of the model and the top of the tower, and analyzing the horizontal and displacement response at these points as shown in Figs. 10 and 11. In this process, it is found that the response of the model under 3D seismic better reflects the real seismic effects, both in terms of inter-story drift and accelerations, the 3D seismic case is significantly different from the low-dimensional seismic case, and the SSI model exhibits more complex characteristics in the 3D seismic response. Through the comparative analysis, it can be seen that the model response under 3D earthquake is more representative and better reflects the real seismic effect, so the following section will take the 3D seismic response as the main content of the analysis for in-depth study.
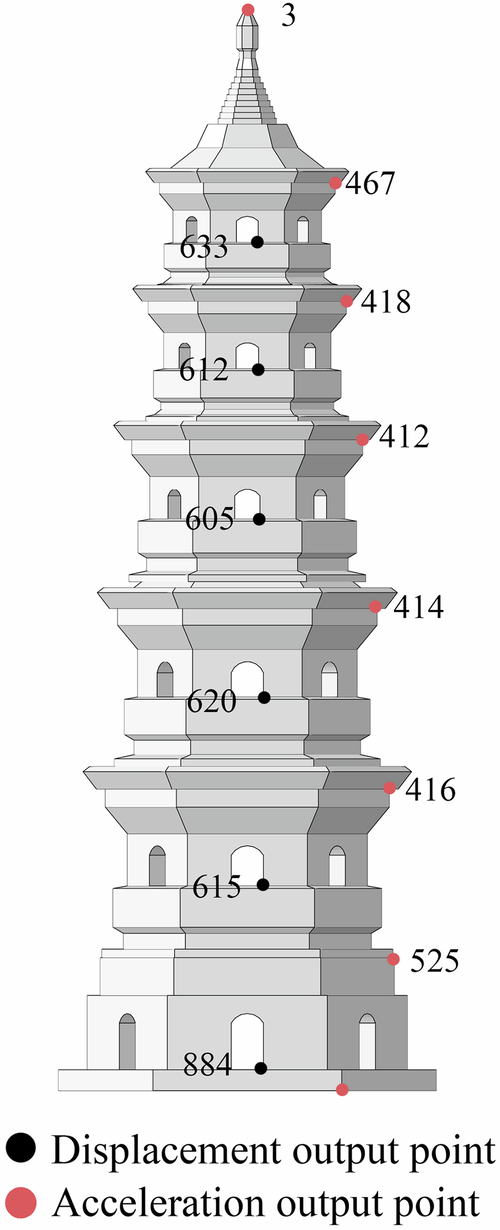
Arrangement of the output points.
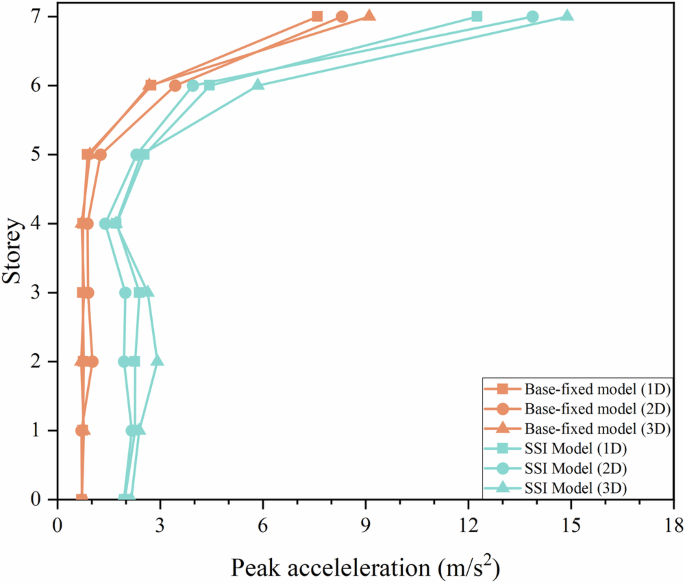
Peak acceleration under earthquakes of different dimensions.
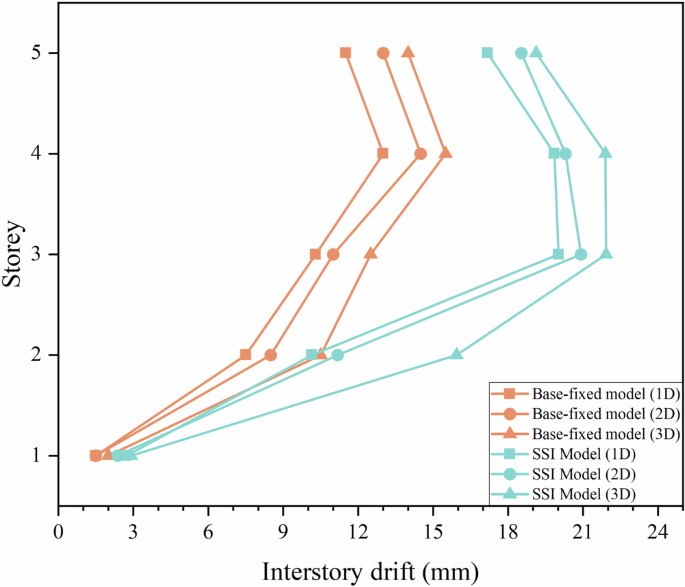
Interstory drift under earthquakes of different dimensions.
Horizontal acceleration
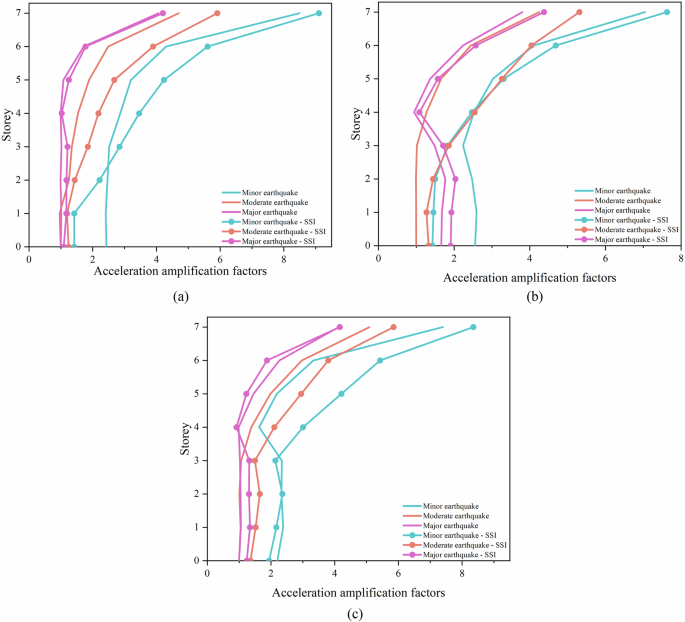
The horizontal acceleration amplification factor is the ratio of the maximum horizontal acceleration response of the structure under seismic action to the input peak ground acceleration (PGA). The horizontal acceleration amplification factor versus the floors of the pagoda is shown in Fig. 12, and the corresponding acceleration-time curves for the top floors are shown in Figs. 13 and 14. It can be seen that the horizontal acceleration amplification factor of the structure reaches its maximum value at the top of the tower, regardless of the base-fixed model or the SSI model, which roughly shows a ‘C’ shape. Meanwhile, it can be seen that the effect of the horizontal acceleration amplification factor is more obvious in small earthquakes than in medium and large earthquakes. Meanwhile, the acceleration amplification factor considering the interaction between soil and structure is more obvious than the base-fixed model.
a El Centro, b Villa Park, and c San Francisco.
a El Centro, b Villa Park, and c San Francisco.
a El Centro, b Villa Park, and c San Francisco.
Reflects the same trend under three different ground shocks. Taking the El Centro wave as an example, the acceleration amplification factor of the ancient tower reaches the maximum value at the top of the tower under the three fortification intensities. The acceleration amplification effect of the large earthquake effect under the base-fixed model can reach about 4.2 times, the acceleration amplification factor of the medium earthquake reaches about 5 times, and the acceleration amplification factor of the small earthquake reaches about 8.5 times. The acceleration amplification effect of the great quake under the soil-structure model considering the SSI effect can reach about 4.3 times, the acceleration amplification coefficient of the middle quake reaches about 6 times, and the acceleration amplification coefficient of the small quake reaches about 9.3 times. Under the action of minor earthquake, the structure is usually in the elastic phase, at this time the stiffness of the structure plays a major role, the structure will be relatively large stiffness to resist seismic action, the larger structural stiffness will make the structure produce a larger acceleration response. The frequency components of minor earthquakes are relatively rich, which contain more frequency components close to the structural self-oscillation frequency. When these frequency components are close to the structural self-oscillation frequency, the resonance phenomenon is likely to occur, thus amplifying the acceleration response of the structure. In moderate earthquakes and major earthquakes, the frequency characteristics of the seismic wave may change, and the frequency components close to the structural self-oscillation frequency may be reduced, the resonance phenomenon is weakened, and the acceleration response is relatively reduced. During moderate earthquakes and major earthquakes, the structure may enter the plastic phase. When the structure enters the plastic phase, the stiffness of the structure is reduced and the seismic energy is consumed through plastic deformation. According to the principle of conservation of energy, part of the seismic energy input to the structure is absorbed by the plastic deformation of the structure, resulting in a reduction of the acceleration response of the structure. As the mass of the pagoda gradually decreases from the bottom to the top, while the stiffness also changes. At the top floors, the mass is relatively smaller and the lateral stiffness of the structure is smaller relative to the bottom floors, the whip-tip effect is more pronounced at the top, resulting in greater acceleration at the top of the tower.
Horizontal interstory drift ratio
Based on previous scholarly research, two schemes are proposed to assess the response of the structure33. Through the ultimate displacement assessment, through the ultimate bearing capacity assessment. However, for masonry structures, a large number of studies34,35,36 have shown that assessing the structural response by ultimate bearing capacity is too conservative, and it often appears that the structure actually did not reach damage, while the calculation results show that it has been damaged, which makes the damage displacement of the structure obtained from the calculation too small. Interstory drift ratio is the ratio of relative displacement between floors and storey height of the structure under the action of external horizontal load, which is the key index to measure the lateral deformation capacity of the structure. Therefore, according to the interstory drift ratio to determine the masonry tower damage state judgment guidelines, as shown in Table 8.
The interstory drift ratio under small, medium, and large earthquakes under the base-fixed model and SSI model are shown in Figs. 15 and 16. Under the base-fixed model, the small earthquake is completely in the elastic stage and is in a basically intact state; under the effect of the medium earthquake El Centro wave, the 4th and 5th floors of the pagoda are in the state of level 2, which belongs to the medium damage, and the remaining two waves are in the elastic stage, which shows that under the effect of the medium earthquake, there is a probability of destruction of the pagoda; under the effect of the large earthquake, the pagoda belongs to the state of level 3 in the most severe case, which will cause serious damage. serious damage. Under the SSI model, the small earthquake is also in the elastic stage and in the basic intact state; under the effect of El Centro wave and San Francisco wave in the medium earthquake, only the first time of the pagoda is in the level 1-basic intact state, the second floor is in the level 2-moderate damage state, and the rest of the floors are in the level 3-serious damage stage, and only the first floor is in the level 2-moderate damage state under the effect of Villa Park wave, and only the first floor is in the level 3-serious damage stage. Under the effect of a Park wave, only the first floor is in level 1—basic intact state and the rest of the floors are in level 3—severe damage; under the effect of a large earthquake, the tower has the probability to reach level 4—collapse state. It can be seen that, regardless of the base-fixed model or the SSI model, in most cases, the inter-story displacement angle of the tower increases nonlinearly with the increase of the height, and reaches the maximum value at the top of the tower. Considering the soil–structure interaction will further amplify the seismic effect of the tower, so it is necessary to consider the soil–structure interaction.
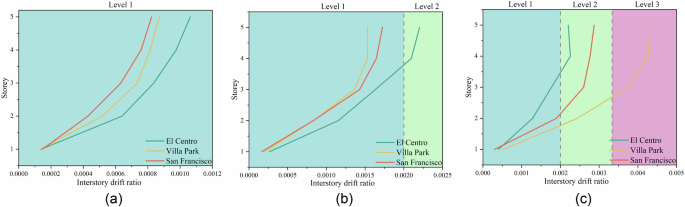
a Minor earthquake, b moderate earthquake and c major earthquake.
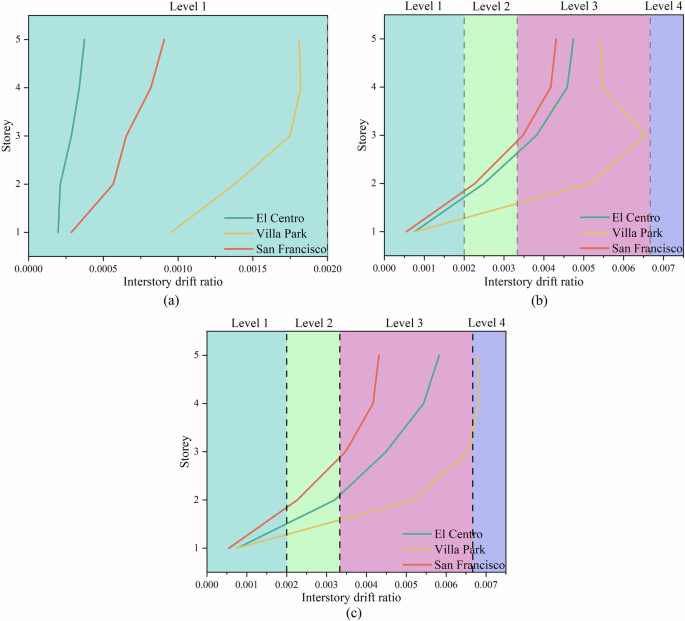
a Minor earthquake, b moderate earthquake and c major earthquake.
Stress state analysis
The masonry structure of the gurdwara is much less strong in uniaxial tensile strength than in uniaxial compressive strength due to its brittle characteristics. Under external forces such as earthquakes, masonry walls tend to crack due to the main tensile stress exceeding its tensile strength, leading to structural damage. Therefore, a criterion can be set: when the main tensile stress of a masonry unit exceeds the axial tensile strength of its material, the unit is considered to undergo damage. Based on this criterion, the structure of the pagoda can be evaluated to determine the specific areas that need to be strengthened. Figures 17 and 18 show the maximum principal stress cloud for the tower under the action of a major earthquake. The onset of the maximum principal tensile stress exceeding the value of the tensile strength of the masonry, as well as the area of initial cracking, are labeled in the figure. The same figure shows that the masonry cracking trends of the base-fixed model and the SSI model are consistent, both appearing near doorways and gables, and reinforcement measures are considered to be carried out at these locations to prevent further crack expansion.
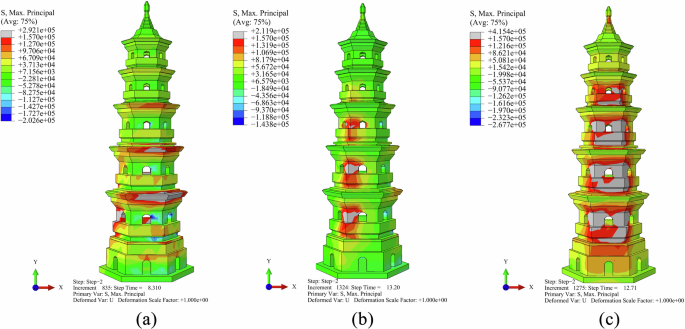
a El Centro, b Villa Park, and c San Francisco.
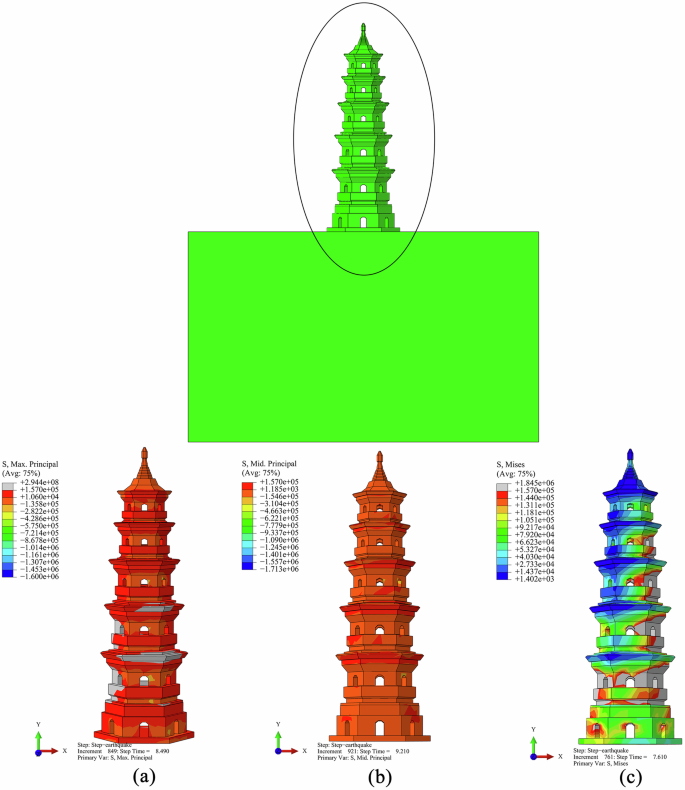
a El Centro, b Villa Park, and c San Francisco.
Reinforcement scheme
Introduction of CFRP
Carbon fiber-reinforced polymer (CFRP) is a high-performance composite material, which is widely used in the field of civil engineering for its lightweight, high strength, high stiffness, and excellent corrosion resistance37. The strength and stiffness of CFRP materials are much higher than that of traditional steel reinforcement materials38, which gives it a reinforcement of concrete structures. CFRP reinforcement technology is mainly applied to the surface of concrete structures by external application39,40 or wrapping41, which utilizes the high tensile strength of CFRP materials to share the tensile stresses of the structure, thus improving the structural load carrying capacity and stiffness.
Reinforcement program
In the above analysis of the main tensile stress cloud diagram of the tower body, the key reinforcement areas can be identified. As shown in Fig. 19, these areas are reinforced by external carbon fiber reinforced polymer (CFRP) material, which not only significantly improves the structural stability of the tower, but also effectively reduces the main tensile stresses in the tower, thus providing an additional protective layer for the blocks, limiting the displacement of the blocks when subjected to tensile forces versus the limit for the blocks to reach their uniaxial tensile strength. This method of reinforcement also maintains the original historical appearance of the tower.
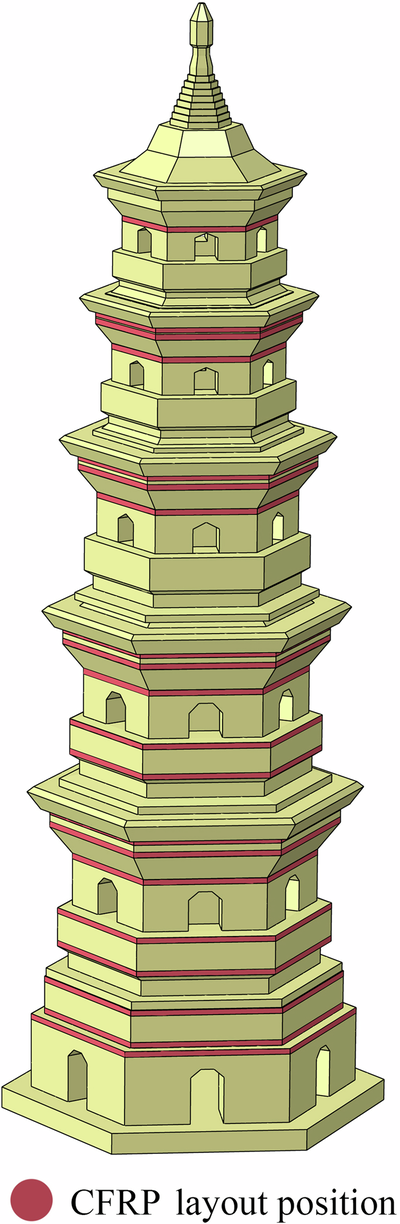
CFRP strengthening configurations of pagoda.
CFRP materials are widely used in the reinforcement of ancient buildings due to their excellent mechanical properties and construction convenience. According to the literature42, the properties of CFRP materials are shown in Table 9, and these properties make CFRP an ideal reinforcement material. Its construction process has less impact on the original structure of the ancient pagoda, which not only reduces the secondary damage to the pagoda but also ensures the reversibility of the reinforcement project, providing an effective solution for the long-term protection of the pagoda.
Damage analysis of ancient pagoda
The tensile damage cloud maps of three seismic waves under the action of large earthquakes of different structural types were extracted from ABAQUS finite element software, and the structural damage cloud maps do not differ much under the action of different waves, and the tensile damage cloud maps under some seismic waves are listed in Fig. 20. As can be seen from the figure, compared with the fixed-foundation model, after considering the soil-structure interaction, the damage of the tower will be further enlarged There are obvious crack extension phenomena on different floors, and the tensile damage occurs earlier, and the tensile damage rapidly expands along the direction of the seismic wave loading, and at the same time, it passes to the top of the tower from the bottom, and the tower brakes are also possible to fracture. 1–5 floors have a larger tensile damage factor, which is 0.9 or more, and the damage is more serious. The tensile damage factor of the 1st–5th floors is large, reaching 0.9 or more, and the damage is more serious. The second layer of tensile damage occurs earlier, and the final damage factor is larger, the weak area of the tower body masonry material is most likely to be damaged.
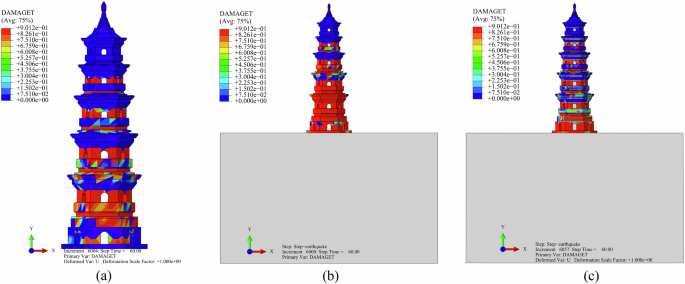
a Base-fixed model, b SSI model and c SSI reinforcement model.
Figure 21 demonstrates a comparison of the interlayer shear before and after reinforcement. Before reinforcement, the bottom shear of the pagoda was between 320kN and 360kN and the top shear was between 150 and 200 kN. After reinforcement with CFRP material, the bottom shear of the pagoda is between 215 and 240 kN, and the top shear is between 110 and 130 kN. The shear in the bottom layer of the strengthened pagoda was around 35%, in the top layer between 26% and 35%, and in the other layers between 15% and 35%. In comparison, the use of CFRP material reinforcement can effectively reduce the inter-story shear of the pagoda. The figure demonstrates a sudden change in shear in the second layer of the pagoda, where the wall thickness of the pagoda decreases from the bottom to the top, and the wall thickness of the second layer decreases relative to the first layer. This causes the stiffness of the second layer to decrease. Under seismic action, the change in stiffness does not affect the shear distribution linearly. When the structural stiffness is not uniformly distributed, the thicker walls in the first story will attract more seismic forces, but due to the sudden change in stiffness, some of the seismic forces will have a concentration effect when transmitted to the second story, which will lead to a sudden change in the shear force in the second story. In addition, the decreasing wall thickness will cause the mass of each floor to change accordingly, and generally, the thicker walls have a larger mass. The product of mass and acceleration determines the magnitude of inertial forces under seismic action. The second story walls are relatively thin and have less mass, however, the second story shear may change abruptly due to the inertial forces transmitted down through the structure from the mass of the floors above as well as changes in seismic force transfer due to differences in stiffness with the first story.
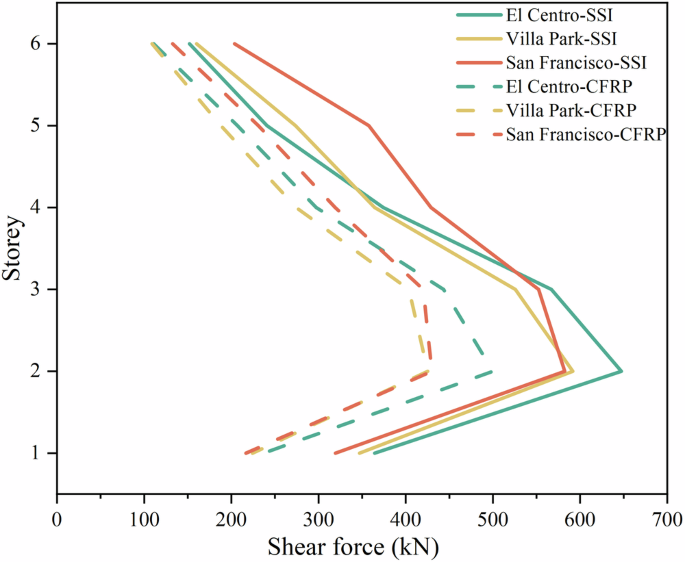
Comparison of shear force before and after reinforcement.
Under seismic action, the shear force of the tower structure reached the maximum value in the bottom layer, and these forces gradually decreased with the increase of the tower height. As a result, tensile damage occurs first at the bottom of the tower. In addition, the cross-section design of the ancient tower shrinks inward layer by layer, resulting in an abrupt change in the cross-section stiffness. Under strong seismic effects, the stress concentration phenomenon caused by this sudden change in cross-section stiffness is more serious, so that the damage area is mainly concentrated at the bottom of the tower at each layer and may spread upward from the bottom layer.
Under a major earthquake, the damage time courses of all units of each floor are extracted from the model and averaged, and the results are shown in Fig. 22. Under three kinds of ground shaking, the damage of the pagoda shows the same trend, with the bottom three floors having larger damage and the top floor having the smallest damage. It can be seen from the figure that in the first 30 s of the ground shaking, the damage changes are more drastic; after 30 s of the ground shaking, the damage reaches the maximum value. The damage factor of some floors reaches 0.9, which is in the state of complete destruction, and this process is basically completed instantaneously. The damage factor of the sixth floor of the pagoda is small and can be regarded as no damage. In the SSI model, since the foundation is regarded as a soil body with a certain degree of elasticity, there is an interaction between the foundation and the structure, and the deformation of the foundation affects the response of the structure, and the damage effect is mitigated for a certain period of time, but the damage factor still reaches 0.9 in the end.
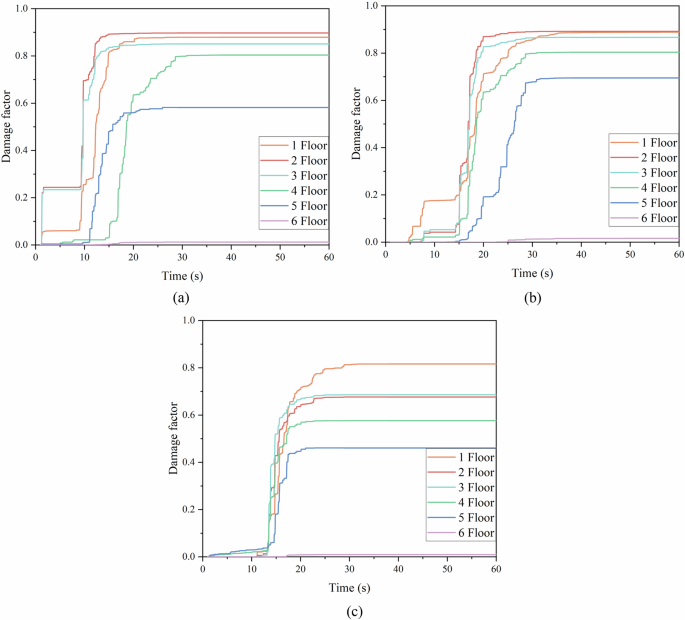
a El Centro, b Villa Park, and c San Francisco.
The CFRP reinforcement significantly improved the damage of the tower in tension, reduced the generation and development of cracks, and improved the durability of the structure. The damage reduction in the area below the doorway, which is the stress concentration area of the structure, is particularly obvious after CFRP reinforcement. From the overall view of the tower, the damage accumulation process of the structure is effectively delayed, extending the service life of the structure and not only improving the bearing capacity of the tower but also enhancing the resistance to seismic loads by improving the integrity and uniformity of the tower.
Conclusion
By comparing the base-fixed model and the SSI model, the following conclusions are drawn:
(1) The base-fixed model is suitable for simple foundation conditions, while the soil–structure interaction model is more accurate, complex, and realistic, and the latter is important in simulating the nonlinear behavior of soil and structural interactions, as the former ignores foundation deformation and soil dynamic properties.
(2) The amplification factor of the horizontal acceleration at the top of the tower is higher than that at other floors in both models, especially during minor earthquakes, and the whiplash effect increases the acceleration at the top, which is greater in the SSI model.
(3) Under the base-fixed model, the tower is elastically intact during the minor earthquake, some floors are moderately damaged during the moderate earthquake, and severely damaged during the major earthquake; under the SSI model, the tower is elastically intact during the minor earthquake, the angle of interstory drift during the moderate and major earthquakes increases significantly with the increase of height, and the top of the tower is in danger of collapse during the major earthquake, which is of great significance for the assessment of the safety of the pagoda under different seismic intensities.
(4) In this study, the damping coefficient is set differently under different seismic intensities, and the maximum value of the acceleration amplification factor of the minor earthquake is contradictory to the expected damping coefficient, which is, in fact, the result of the role of a variety of factors. Minor earthquake structural elasticity, stiffness dominant, easy to trigger resonance to acceleration amplification; major earthquake structure may enter the elastic-plastic phase, mechanical properties change, energy consumption mechanism is complex, which provides a basis for understanding the structural dynamic characteristics of the changes in the earthquake.
(5) According to the main tensile stress to determine the weak position, the CFRP material can effectively restrain the masonry brick wall, improve the brittle damage mode of the wall, and improve the deformation and damage resistance of the reinforced wall, which is of guiding significance for the reinforcement of ancient buildings.


Responses