Disparities in expert and community perceptions of industrial heritage and implications for urban well-being in West Bengal, India
Introduction
Industrial heritage assets have an impact on the social life and livelihoods of urban communities1. The domains of industrial tourism for economic development2,3, social cohesion4,5, place-making through industrial heritage regeneration6 and environmental sustainability through remediation of industrial brownfields7,8 have been widely studied. Although all of these have an impact on urban areas, few studies have included community viewpoints on determining the indicators of industrial heritage. This is especially needed in regions having no established definition of industrial heritage or even brownfields, like India. Indicator-based perceptions study for cultural heritage has been conducted9 and the relevance of residents’ suggestions for managing heritage sites have also been established in the Burra Charter10,11. Frameworks like UNESCO’s Historic Urban Landscape (HUL), adopted in 2011 have broadened the approach to heritage management acknowledging local communities as crucial stakeholders in heritage management12. This holistic perspective aligns well with industrial heritage landscapes13, particularly those in urban areas, where community involvement can mitigate issues like cultural homogenization and political marginalization that may arise from standardized heritage narratives14,15. Community members often hold diverse opinions on cultural heritage representation, influenced by their socio-cultural contexts, making a unified narrative challenging to establish16,17,18,19. Such disparities in perceptions, particularly in industrial landscapes, where identity, place-making, and socio-economic heritage impact community cohesion, suggest a need for inclusive heritage practices20. The “human dimension” of intangible heritage is the starting point of this argument in many researches21.
Collaborative heritage management between government bodies, private sectors, and local communities ensures heritage initiatives are relevant and beneficial to those directly affected20. Despite the recognition of community involvement in global heritage management22,23, research on community perceptions in industrial heritage landscapes remains limited15,24,25.
This study aims to address this gap by investigating the distinct values attributed to industrial heritage by experts and local communities, thus contributing insights that support the integration of industrial heritage into broader heritage management policies.
Industrial heritage in India
Phases of industrialization has generated significant urban assets, which were rarely valued as cultural heritage until the mid-twentieth century. According to studies, the term industrial heritage was derived from the concept of industrial archeology during the early twenty-first century15,24,25. The definitions of industrial heritage focus on valorizing the outcomes of historic industrial culture24,26. Categories of industrial heritage have evolved over time, from including machineries, buildings, and its supporting infrastructure24,25 to including large areas and landscapes27. The need for incorporating region-specific alterations in the definition have been highlighted in the Taipei Declaration for Asian Industrial Heritage28. Also, the focus gradually shifted from tangible evidential value to that of the socio-cultural associations28. According to literature sources, valid indicators for defining the values and attributes of industrial properties are lacking consensus29,30,31. Approaches that merge and compare, multi-expert valorization32 geographical context and social needs33, are to be taken forward in defining new domains of heritage. In India, heritage management is governed by laws and policies under institutions like the Archaeological Survey of India (ASI) and the National Monuments Authority (NMA). These organizations are responsible for protecting cultural assets, as outlined in the Antiquities and Art Treasures Act (1972), and the Ancient Monuments and Archaeological Sites and Remains Act (1958)34. While the existing framework emphasizes preservation of ancient monuments and archaeological sites, there is a significant gap in policies concerning living industrial sites and abandoned facilities of heritage significance. Despite growing awareness of the cultural and socio-economic value35,36,37 these sites contribute, the regulatory focus largely neglects the adaptive reuse and conservation of industrial heritage landscapes. The heritage protection decision -making system is expert-centric. The Indian National Trust for Art & Cultural Heritage (INTACH), India, in their inventory of heritage sites, has listed 174 industrial heritage locations in its National Register, though these lack statutory recognition. These industrial sites represent less than 0.4% of their total listed heritage38. Moreover, only two industrial heritage sites have UNESCO World Heritage status in India39.
Thus, the major gaps in the Indian heritage management system include the lack of protection of majority of living heritage sites, and lack of community-centric approaches for heritage value assessment.
Contribution of heritage on urban well-being
Well-being, quality of life, liveability and sustainability are established as synonyms in recent studies40. It has been argued that, although cultural heritage affects the well-being in urban areas, the topic has been often neglected41. Urban quality assessment tools mostly prioritize objective data, neglecting intangible or subjective indicators42,43. There is a need for focusing on community well-being during cultural heritage value assessment41,44. Although there are numerous studies of community well-being in geography, philosophy and sociology, there is a lack of a universal definition45. According to a study by the European Commission, more than seven out of ten Europeans believe that cultural heritage can improve their quality of life46,47. This study reflects on five dimensions (refer Table 1) identified in researches linking sustainability in urban areas, cultural heritage and quality of life or well-being.
The assessment of heritage value, particularly for living heritage assets such as industrial heritage, has highlighted key dimensions that directly impact urban well-being. Studies suggest that adaptive reuse and regeneration of industrial heritage sites hold potential for employment generation, especially through tourism-related activities, creating new job opportunities in areas surrounding these sites2,6,48. Additionally, nature-culture linkages within industrial heritage sites offers a significant opportunity to establish blue-green infrastructure, transforming these spaces into essential citizen services49,50,51,52. The living environment is directly impacted by the operational status and physical conditions of industrial heritage sites, which ultimately impacts the well-being of its end users. Moreover, regenerating industrial heritage contributes to cultural sustainability by preserving unique identities and fostering education through cultural diversity53,54,55,56. Collectively, these contributions of industrial heritage align with the five identified dimensions (refer table) of urban well-being.
Urban industrial community of West Bengal, India
Industrialization in West Bengal, India, began in the late eighteenth century and intensified throughout the nineteenth century, with dockyards, roperies, foundries, engineering workshops, cotton mills, jute mills, oil mills, sugar factories, and flour mills marking the region’s development. This period also saw brickworks, salt mills, and timber sawmills established along the Hooghly. The transformation from rural, agrarian settlements to large-scale industrial towns significantly impacted the region’s demographic profile, fostering an urban community that included migrant laborers, foreign entrepreneurs, and engineers, creating a cosmopolitan culture57,58,59. Bardhaman, Howrah, and Hooghly districts are West Bengal’s industrial leaders, hosting a wide array of industries from large-scale factories to micro, small, and medium enterprises57,58,59. The river Hooghly, which flows west of the Ganges and into the Bay of Bengal, has long served as a vital trade route and a focal point of settlement. By 1908, over 56 factories in the area employed approximately 8% of the local population. Most of these historically significant industrial establishments continue to function as fully or partially operational industrial facilities. This study identified the two districts of Howrah, and Hooghly where the population has encountered a wide range of industrial typologies, which are unprotected industrial heritage sites.
According to the Census of India 2011 data, West Bengal is the fourth most populous state in India with a population of 91,347,736, within which, the districts of Howrah and Hooghly appears amongst the five highest areas of urban population60. By 2018, Howrah had a daily average of 219,767 registered factory workers by 2018 and 76,801 micro and small enterprises. Simultaneously, Hooghly registered a daily average of 117,216 factory workers and 43,442 micro and small enterprises. The data further confirms the century-old establishment of an industrial community in the region, along with the concentration of industrial sites of heritage value.
Materials and methods
This study implemented an integrated method that incorporated researchers’ knowledge, experts’ opinion, and community perspective to reduce bias in outputs. The research was conducted in four stages which were as follows:
Content analysis
Prior to undertaking the comprehensive content analysis, relevant charters, acts, and principles pertaining to industrial heritage were selected, and the value definitions within each were identified. The comparative study of these value definitions resulted in the establishment of six categories of industrial heritage values, which were utilized for thematic coding in an Excel spreadsheet. For the content analysis, a literature search was conducted from the SCOPUS database using the search terms “industrial” AND “heritage*.” The search inclusion criteria are as follows:
-
Type: Articles and conference papers
-
Year: 2003–2023
-
Accessibility: Open
-
Language: English
-
Publishing Status: Published
2003 was specified as the lower limit of search, based on its linkage to the earliest charter on industrial heritage24. A final list of 109 sorted literature were read in full, for thematic coding of the indicators under the identified values. 22 indicators were taken forward for expert consensus in the next phase.
Fuzzy Delphi survey
To establish validity and attain consensus for a theoretical framework, the Delphi method of experts’ survey is conducted61,62,63,64,65. An expert questionnaire was designed, consisting of 5-point Likert Scale responses for all the 22 indicators. To overcome the subjectivity and complexity of interpretation, an integration of Fuzzy theory and Delphi method, called the Fuzzy Delphi method66, have been used. Studies indicate that a range of 10-50 experts with heterogenous background are required for significant results67,68. For this study, 11 experts from the different disciplines including heritage management, urban planning, academics, and architecture were identified. For a reliable response outcome, these limited number experts were identified, based on their familiarity to the geographical context and characteristics of the industrial heritage sites.
There were two important aspects in the Fuzzy Delphi technique, namely, the Triangular Fuzzy number and the defuzzification process68. A brief description of the research aims and background had been provided to the experts and terminologies were clarified before the survey. The steps for the Fuzzy Delphi survey have been provided (refer Fig. 1).
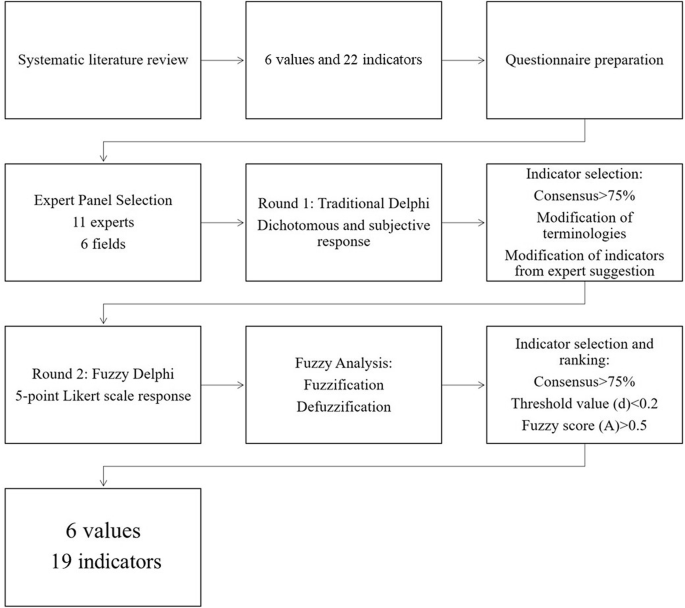
Flowchart showing steps of Fuzzy Delphi survey.
The data analysis for the Fuzzy Delphi method began by getting the Triangular Fuzzy number from the 5-point Likert scale, in the form of minimum value m1, reasonable value m2 and maximum value m3 (refer Supplementary data S1). The data were then tabulated to obtain the Fuzzy value (n1, n2, n3). To get the location between two fuzzy number, the formula as shown below was applied:
To get experts’ consensus on every item, the threshold value (d) should not be more than 0.269, the percentage of experts’ consensus needs to be more than 75%70 whereas, the defuzzification score (A) for every item must be more than the α-cut value, which is, 0.569. The defuzzification process also determines the position or rank of every item. Out of the three available formulae for defuzzification score68, the following formula have been chosen for this research:
Nineteen out of 22 indicators, which achieved consensus from the Fuzzy Delphi survey were taken forward for the questionnaire survey.
Questionnaire and sampling design
Using the 19 indicators, a questionnaire was designed, where each indicator was to be rated in a 5-point Likert scale, according to the agreement of the level of importance. As the questions are based on perceptions and prone to subjectivity, a pilot study (sample size, N1 = 164) was conducted in the district of Howrah, India in April 2022 to ensure the questionnaire is validly interpreted. The Cronbach’s alpha71,72 was used to determine the reliability of the questionnaire from the pilot study. All the statistical tests were conducted in Statistical Product and Service Solutions (SPSS) software. The results of the pilot survey had been used to further refine the language and items of the questionnaire. The sample size for the main survey was determined based on the literature on Principal Component Analysis (PCA) suggesting 10–20 samples per item73. Accordingly, data was collected (sample size, N2 = 438) during March–April 2023 ensuring a balance amongst the target communities, age-groups, and gender (refer Supplementary data S2). Purposive sampling was used to identify the three target groups comprising the urban industrial community which are as follows:
-
(1)
People involved in commercial activities in the industrial area.
-
(2)
Current and past industrial workers.
-
(3)
Residents of the area working outside in other sectors.
Within the Howrah and Hooghly districts, the neighborhoods having higher industrial land use were targeted for the survey (refer Fig. 2A, B).
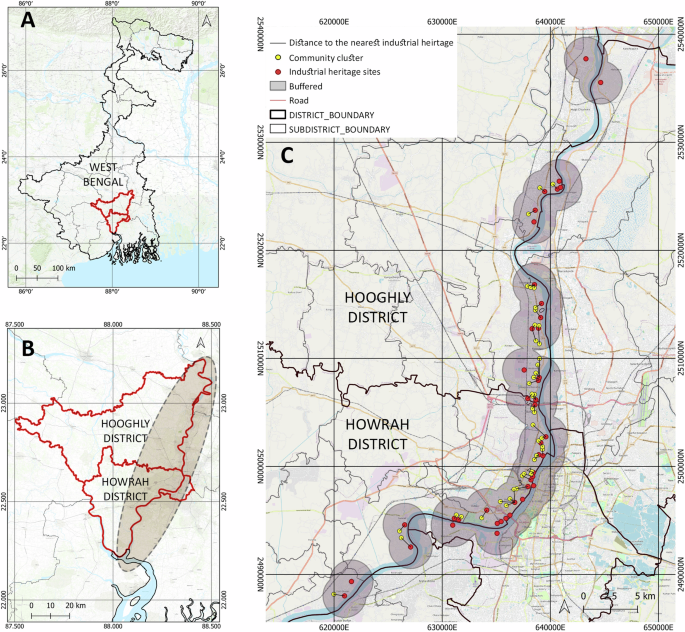
A Study area in West Bengal, India, B Identified zone for reconnaissance survey in Howrah and Hooghly districts, West Bengal, India, C Map showing industrial heritage sites and community clusters for survey.
The main selection criteria of the survey area included a proximity of surrounding industrial heritage sites. Using QGIS software, the industrial sites with existing historically significant resources were mapped based on archival research followed by a reconnaissance survey of the riverside blocks of Howrah and Hooghly districts. A 2 kilometers buffer was drawn from each of the sites. The buffers were overlapped with the Land Use Land Cover (LULC) data of West Bengal, to identify the areas with high built density. From these areas, 44 industrial community clusters were identified, which had physical accessibility via road networks to the identified sites (refer Fig. 2C). Eight to ten samples were collected from each of the clusters. The distance to the nearest industrial heritage site was also analyzed (refer Fig. 2C) to ensure majority of the identified sites have proximity to the community clusters.
Principal component analysis
Principal Component Analysis (PCA), a type of Factor Analysis, has been used to establish or validate theoretical constructs through evidences from empirical surveys and large-scale data in various literature74,75,76,77 without significant loss of information78. This study used a questionnaire survey, with data collected in ordinal scale, to explore the perceptions of urban communities towards indicators of industrial heritage in the historical industrial areas. According to requirement for PCA, a linear relationship77 was assumed between the group of indicators and their respective values. Finally, for ease of understanding and concise results, the varimax rotation was applied for extraction79,80. To ensure accuracy, a PCA was run on a pre-processed data, which rendered similar results as to the real (unprocessed) data. The pre-processing was done by column transformation, centered and standardized, of the 5-point Likert scale data.
Results
Experts’ opinion on industrial heritage values
Indicators of industrial heritage
The six value categories identified from comparative study of the charters, acts and principles of industrial heritage are, historical value24,27,28,81, architectural value24,27,28,81, technological value24,27,28, social value24,27,28,81, economic value28,81 and environmental value27,28. Each of these values were further studied from published research articles, to gain insight regarding their respective indicators.
The indicators of historical values focused on the connection to historical events3 or to advances in cultural developments of the region82. Industrial sites were often linked to industrial accidents, issues of environmental pollution83 and political uprisings84, and effects of traumatic pasts industrial heritage sites85. Indicators of architectural value included elements which embody the development trajectory of industrial architecture86. The industrial architecture was considered to reflect the aesthetics of simplicity and modernization87. Architectural indicators focused on different scales including the material88, construction techniques89, spatial distribution90, overall built form91, site layout and the landscape85. The indicators of technological of industrial heritage portrayed the intangible educational value92,93 through the techniques and innovations in the historic industrial process94. Indicators of social value included experiences of the industrial community95. A continued presence of the industrial community in the vicinity of the industrial asset adds to the social value96. for which, gentrification97 and fragmentation of asset, are potential risk factors. Also, memory and place attachment98 significantly contributes to the social value. Industrial activities had been one of the driving forces of economic growth in history, contributing the direct and indirect economic values99,100. Additionally, these properties as are identified as valuable real estate101. Brownfields, including the historic industrial sites were often associated with environmental pollution102. Indicators of environmental value included assets that have historically promoted waste management3 or promoted minimal transformation of the overall landscape89. Evidential connection with surrounding natural resources103 and presence of reusable materials2 and spaces also led to a positive environmental influence.
Fuzzy Delphi survey
Based on the criteria for Fuzzy Delphi analysis 19 out of 22 indicators have achieved a consensus more than 75% and the threshold values (d) less than 0.2 (refer Table 2).
Average threshold value (d) of 0.132 and consensus of 80% was achieved. Higher consensus was achieved for economic and environmental indicators, which are also widely researched. The experts have indicated how the social value indicators for industrial heritage are most prone to subjectivity.
Thus, the theoretical framework for evaluating and identifying industrial heritage consisting of 19 indicators under 6 values (refer Fig. 3) was established based on experts’ consensus.
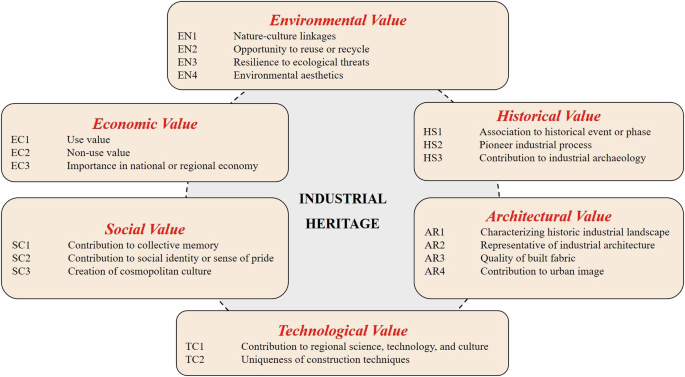
Indicators of industrial heritage value.
Perceptions of urban industrial community
Reliability and validity
The data obtained from empirical survey was in ordinal scale and linear relationship had been assumed. A Cronbach’s α value of 0.795 was attained, which exceeded the standard of 0.7, indicating that the questionnaire has acceptable reliability48,71,104. High values of Kaiser-Meyer-Olkin (KMO) Measure of Sampling Adequacy generally indicate validity of any factor analysis test. Values greater than 0.50105 are considered acceptable. Also, the Bartlett’s test of sphericity identifies the level of correlation71,72, in which the significance level should be below 0.05104. The results (refer Supplementary data S3) yielded adequate inter-correlation and sample size for conducting the Principal Component Analysis. Communality represents shared variances106 that can be explained by the common factors and an extraction value greater than 0.3 is acceptable107. Each of the indicators achieved the acceptable value (refer Supplementary data S4).
Principal component analysis
As per the experts’ consensus, the hypothesis is that six principal components will be extracted from the factor analysis. The results show the cumulative variance explained is 56.9% by the extraction of six components (refer Supplementary data S5), which may be considered as acceptable in social science research107,108. The inflection points in the scree plot (refer Fig. 4a) correspond to the sixth component, as hypothesized.
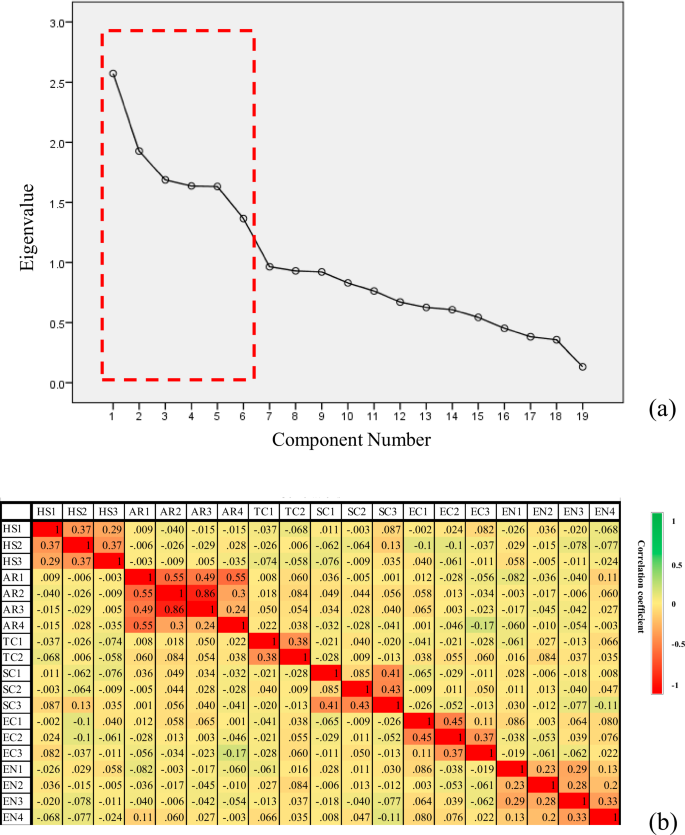
a Scree plot and b heatmap of Pearson’s correlation coefficient for the responses on industrial heritage value indicators.
Also, the correlation heatmap (refer Fig. 4b) show there is less cross-correlation across the indicator sets. After the orthogonal varimax rotation, the indicators were found to be grouped under the respective principal components or values (refer Table 3) as per the established theoretical framework (refer Fig. 3). The positive values of the factor loading confirm a well-structured analyzed data48.
The results of the PCA led to the understanding of the current views of the urban industrial community in defining industrial heritage, where a prioritization of the architectural and environmental indicators have been observed. They form the first two principal components contributing to majority of the explained variance (refer Table 3). Within principal component 1 which clusters the indicators of architectural value, indicator AR4 has a much lower factor loading, indicating its lower correlation. The factor loadings under component 2 and component 5 are comparatively low, indicating a potential correlation of the environmental and social value indicators with the other values. There are many non-functioning industrial properties around the area of survey, which led to the findings of the economic value indicators, where indicator EC2 has much larger factor loadings.
Discussion
Disparities in community perceptions and experts’ opinion
The study compares the disparities between perceptions of experts, who may or may not be directly associated with the industrial assets and the industrial community, in this case, the end users of the historic industrial landscapes. A comparison of the ranking of indicators have been interpreted through a radar chart (refer Fig. 5). The ranks from the experts were calculated from the fuzzy scores, whilst the rank from the industrial communities were interpreted from the eigenvectors or factor loadings (refer Supplementary data S6).
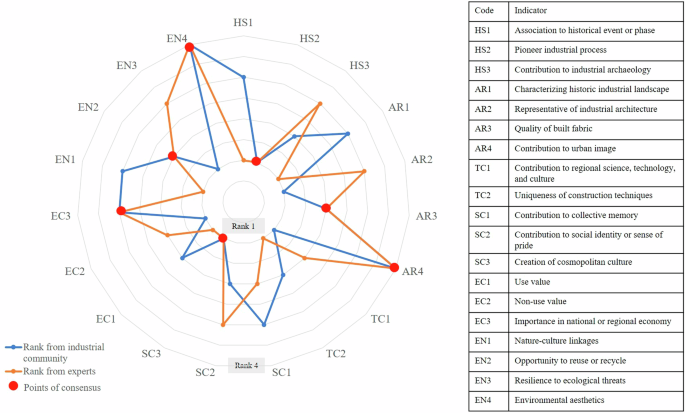
Radar chart showing ranking comparisons of industrial heritage value indicators.
Figure 5 highlights that 7 out of 19 have achieved consensus in ranking by the experts and industrial communities. Indicators with consensus of high prioritization, such as pioneer industrial process (HS2) and quality of built fabric (AR3) reflect the general notion of built heritage evaluation, common to experts and users, where, the integrity of the structure plays the crucial role. Moreover, the indicator contribution to urban image (AR4), which pertains to the broader impact of industrial heritage on urban character, also achieved consensus, highlighting the unique contribution of industrial sites to city identity. This consensus extends to social and economic indicators like creation of cosmopolitan culture (SC3), use value (EC1), and importance in national or regional economy (EC3). The social indicator of these landscapes, evidenced by creation of cosmopolitan culture (SC3), is acknowledged by both groups. Economic indicator, use value (EC1) and importance in national or regional economy (EC3) similarly reveal alignment, suggesting that both experts and community members recognize the foundational role these sites play in the economic heritage of West Bengal, sustaining local livelihoods and contributing to regional economic identity. Interestingly, despite prior research highlighting the role of nature-culture linkages in industrial heritage value, there is a shared lower prioritization of environmental aesthetics (EN4).
Disparity is observed in 12 out of the 19 indicators, particularly in indicators associated with technological, architectural, economic, and environmental values. Technological value, which comprises three indicators, displays the highest degree of divergence between groups, reflecting differing perceptions of technological heritage. This divergence suggests that technological aspects of industrial heritage may be more relevant to experts focused on historic processes and innovations. Architectural, economic, and environmental values display moderate disparities. For example, the ranking of characterizing historic industrial landscape (AR1) and nature-culture linkages (EN1) demonstrates distinct perceptual differences. Experts prioritize these indicators, possibly viewing the landscape holistically in terms of its historic and aesthetic coherence. The community, however, tends to prioritize attributes that directly influence their lived environment and quality of life. Indicators such as representative of industrial architecture (AR2) and resilience to ecological threats (EN3) further illustrate these differences. The industrial community assign greater importance to resilience, likely due to environmental vulnerabilities faced in riverine areas along the Hooghly River. Experts, in contrast, emphasize architectural representation, reflecting a focus on preserving built forms and architectural heritage. Overall, it is observed that experts and the end-users of the industrial area differ in their priorities and views of how industrial heritage should be defined. Expert-centric heritage assessment may result in neglect of the values integral to the industrial community.
Impact of industrial heritage on urban well-being
This section highlights distinctive spheres in industrial heritage value indicators that impact the five dimensions of urban well-being (refer Table 1). The cross-tab bar charts interpret the response patterns for the selected indicators, with respect to the three age-groups (refer Fig. 6).
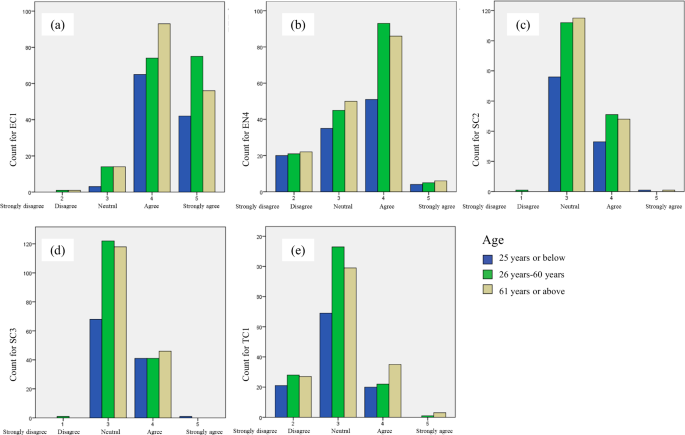
Bar graph comparing responses of three age-groups on respective industrial heritage indicators a Indicator EC1, b Indicator EN4, c Indicator SC2, d Indicator SC3 and e Indicator TC1.
The impact of employment dimension of urban well-being40 has been linked with indicator EC1, which deals with the economic benefits from direct use of the industrial facilities. The perceptions regarding EC1 (refer Fig. 6a) reveal higher rating provided by the oldest age group (61 years and above) compared to the younger age-group, revealing a lack of trust in industrial employment availability in historic industrial areas. This argument corresponds with the studies highlighting concerns caused by the industrial sickness in West Bengal leading to decline of industrial job opportunities during the post-independence era109,110. The living environment in an industrial neighborhood is impacted by the multi-sensory component of environmental aesthetics111. Higher ratings have been given by the working age-group (26–60 years), for indicator EN4 (refer Fig. 6b). This demonstrates that multi-sensory traits are highly valued by those who physically access the neighborhood the most. Figure 6c depicts that industrial heritage contribution to identity, which has been linked to citizen services112, has most neutral ratings from all the age-groups. Initiatives in urban branding constituting reused industrial heritage for public utilities may mitigate this loss of identity. The cultural diversity dimension of urban well-being corresponds with the indicator SC3, which represents the cosmopolitan industrial culture as a mix of migrant industrial workers and residents. Although, the diversity is evident in the industrial neighborhoods of the study area, Fig. 6d depicts neutral to low acknowledgement of these diversified community practices. Future researches may identify the factors causing these disparities. Historic industrial sites have been sources of education for technological or architectural development and social history related to the industrial culture113, corresponding to indicator TC1. The ratings for TC1 (refer Fig. 6e) show that the agreement and disagreement counts are almost equal, especially amongst the youngest age group (25 years or below), who are more willing to learn modern skills and technologies, rather than considering the traditional technologies as a source of future education.
Conclusion
This study adds to the continuing conversation about emphasizing the necessity of involving local populations in shaping urban environments. Community or stakeholder participation has been vital in recent approaches of urban heritage valorization and management, including the Historic Urban landscapes approach12,114,115. The arguments mention how the diversity of stakeholder perceptions needs to be addressed. This study examines the difference in needs or expectations between a community and experts of a living heritage asset in the urban context. Addressing these disparities is required for accurately capturing the multi-dimensional value of industrial heritage, and catering to the end-users of the sites.
All stages of this research have discrete outcomes. The content analysis determines the overall constructs and establishes the theoretical framework for industrial heritage, while the Fuzzy Delphi method reduces the subjectivity of the researchers’ findings through experts’ perspective. Finally, the Principal Component analysis incorporates the perceptions of the end-users of the industrial heritage assets and develops a robust approach for integrating empirical survey into heritage valorization. By comparing the results of the Fuzzy Delphi method and the PCA, it is observed that models for architectural, technological, and environmental value assessment of industrial heritage requires stakeholder involvement, as these portray the significant disparities with expert opinions. Inclusive evaluation can provide a more balanced representation of industrial heritage significance for urban industrial landscapes like those along the river Hooghly. The next section of the research explores whether an external factor like the sense of urban well-being may act as mediator for the value perceptions. The results highlight how heritage-led urban well-being initiatives should incorporate public participation from all age-groups. Based on the results, future research may identify the sensitivity of these disparities with respect to geographical variations to derive dynamic strategies of community involvement in heritage valorization. Moreover, in this research, urban well-being has been explored as a mediator to discuss the value perceptions. Future researches, may explore other factors like education level of community, tourism exposure, physical connectivity, etc. It is widely discussed how revitalized cultural heritage sites can be used as a social infrastructure like a public gathering space, exhibition hall, administrative or commercial space or even housing116,117,118. The findings imply the need for incorporating a more localized and inclusive approach to heritage management.
Responses