Optimum corrosion performance using microstructure design and additive manufacturing process control
Introduction
Laser powder bed fusion (LPBF) has risen to prominence as a significant method within the field of additive manufacturing (AM), attracting substantial focus within the marine and defense sectors. This technique is highly regarded for its efficacy in fabricating a wide range of components and metallic elements1,2,3,4. This process is well-known for its exceptional capabilities allowing it to produce components with intricate geometries and making it an ideal choice for industries such as shipbuilding and aerospace5,6,7,8,9. Moreover, highly localized melting, strong temperature gradients, and high solidification rates uniquely characterize AM processes, leading to the evolution of nonequilibrium hierarchical microstructures. These microstructures typically include grains ranging from 10 μm to 100 μm, each containing a forest of solidification cells, which differ significantly from the microstructures developed during conventional manufacturing processes10.
The LPBF method has numerous process parameters, but only a few are considered critical. Some of these include laser speed, laser power, scan strategy, beam diameter, and hatch spacing11,12,13,14, which have an impact on both large defects and microstructural features. By optimizing the specified process parameters, adjusting the input energy, and modifying the laser irradiation path, substantial changes in the microstructure can be achieved, thereby facilitating more precise control over and design of the microstructural characteristics.
Microstructure design is being used to create advanced materials with tailored properties for a range of applications15. This involves manipulating various features, such as grain size, phase, grain shape, and crystallographic texture, to achieve specific material properties. This can be accomplished through techniques such as controlling processing parameters, selecting appropriate materials, utilizing advanced manufacturing processes, and special post processes. The main approach for designing microstructures is through various heat treatment processes, especially for additively manufactured parts. However, due to the unique hierarchical microstructural features developed during the LPBF process, it is possible to control microstructural features at sub-micron scales by manipulating process parameters. This allows the design of microstructures to achieve desirable functionalities according to the specific requirements of the fabricated component. Recent studies have focused on controlling microstructures by adjusting process parameters during additive manufacturing16,17,18. This approach notably eliminates the need for costly equipment and reduces the time required for heat treatments.
Recent investigations have explored the microstructural design of various alloys by process parameters, such as AlSi10Mg19, Cu-36.8Fe20, 316L21, and CoCrFeNiMn22 alloys, which have been additively manufactured. The study on Inconel 718 explored the effect of process parameters using the electron beam melting technology on grain morphology23. Modifying the scan strategy by alternating point and line heat sources increased thermal gradients and the interface speed, leading to specific regions with equiaxed solidification patterns and different grain morphologies23. Plotkowski et al.24 reported a novel scan technique applied to a binary representation of the Mona Lisa as a representative geometry. The researchers introduced a new scan path algorithm that is independent of the specific geometry being printed. This algorithm allows for the manipulation of the spatial arrangement of solidification conditions and alterations in the texture components during the additive manufacturing process. Moreover, it was found that the texture control of 316 L can be obtained not only by changing the scan strategy but also by the direction of shielding gas flow25. For instance, the microstructure can go under a specific scanning aligned with the shielding gas flow direction leading to shallow and conduction type of melt pools and a strong Goss {110} <001> texture component along the laser scan direction. Conversely, when the laser scan was performed perpendicular to the gas flow direction, it resulted in deeper melt pools. This was accompanied by a reduction in the Goss {110} <001> texture component and the emergence of a <100> fiber texture aligned with the scanning direction25. Marattukalam et al.26 found that the rotation angles in LPBF-316L favor the development of fiber texture, which is associated with increased hardness, Young’s modulus, yield strength, and elongation at fracture. This indicates that LPBF-316L components can be printed with either isotropic or anisotropic properties as needed.
Most studies have reported that controlling the texture and dimensions of the melt pool is paramount, considering that grain size exerts the most substantial influence on mechanical and corrosion properties. Hence, a profound comprehension of the interconnection among process variables, microstructural characteristics, and the possibility of substantial defect formation is imperative in the pursuit of flawless material production27. Therefore, this work explores the effects of changes in energy density and scan strategies on microstructural features developed during solidification, aiming to design controlled microstructural features using LPBF process parameters manipulation.
Moreover, investigations into the changes in corrosion resistance of LPBF components due to variations in process parameters have primarily focused on the effects of defects such as porosities and cracks, which serve as preferential sites for corrosion28,29,30,31. However, the influence of grain structure, in the absence of significant porosity and crystallographic orientations, is not yet fully understood. Our previous studies on the corrosion behavior of LPBF stainless steel and non-ferrous alloys have demonstrated that grain boundaries play a critical role in controlling electrochemical reactions, which, in turn, impact passivity and resistance to localized corrosion attack32,33. Optimizing LPBF processes for metallic components with both superior mechanical properties and high corrosion resistance necessitates identifying key parameters, such as grain manipulation, that govern corrosion behavior among other factors like texture, internal stress, and impurity segregation. This study aims to explore how controlling additive manufacturing process parameters, especially scan strategy, influences the corrosion performance of additively manufactured 316 L alloy by controlling the microstructure. Furthermore, given the close correlation between controlling the microstructure and corrosion performance, electrochemical measurements are conducted to unveil these associations.
Methods
Manufacturing
This study examined the microstructure development and subsequent corrosion properties evolution of 316 L by varying process parameters, particularly scanning strategies in the laser powder bed fusion (LPBF) technique. To manufacture the samples, gas-atomized powders of 316L were used as the raw materials. The experimental design and characterization of the raw powders used in this research are presented in Fig. 1.
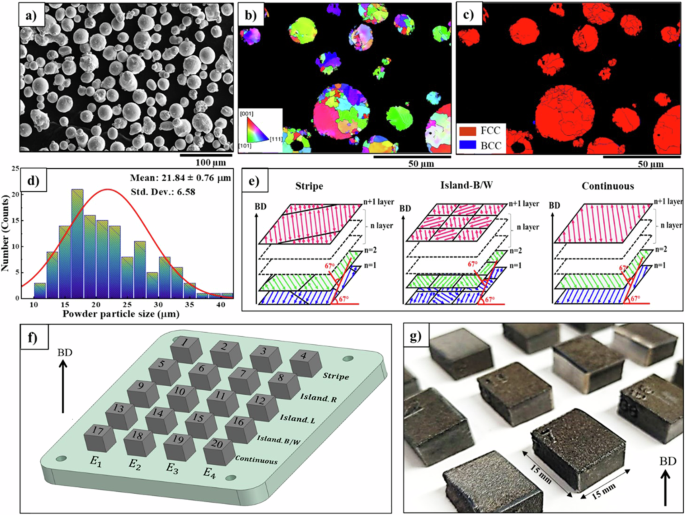
a Scanning electron microscopic (SEM) images of the initial powders indicating the spherical morphology of the powders with some satellites. b Inverse pole figure (IPF) map; and c Phase map of the initial 316 L SS powders; illustrating the single FCC (austenitic) phase. d The powder particle size distribution is symmetric and narrow with the mean powder particle size of ~22 µm. e Schematic of continuous, stripe, and island-B/W scan strategies. f A view of the samples designed in four diverse input energies and five various scanning strategies. g A view of the manufactured cubes that have been cut to align with the building direction to examine the microstructure.
Figure 1a–c illustrates the SEM images and the EBSD inverse pole figure (IPF) map of the initial powders, indicating the spherical morphology of most particles and a single austenite phase. As can be deduced from the particle size distribution diagram presented in Fig. 1d, the average particle size of the powder particles used in this study is 21.84 ± 0.76 µm. Cubic samples were fabricated using a GE Concept Laser M2 Version 5 machine (Germany) equipped with a 400 W continuous Nd: YAG Laser, a 316 L build plate, and a hatch spacing of 90 µm. To prevent the oxidation of molten materials, nitrogen gas was used during the manufacturing of the samples. The temperature of the chamber, build plate, and powders were measured at 55 °C, 34 °C, and 50 °C, respectively.
At first, to influence the energy input on the structural and microstructural characteristics, different energies of 44.4, 47.6, 50.0, and 60.9 (frac{J}{{mm}^{3}}) are considered while manufacturing the samples. It is known that based on the equation (E=frac{P}{{vhd}}) 34,35, the input energy can be changed by alternating power (P) and speed ((v)) during the additive manufacturing process. Since the energy of 60.9 (frac{J}{{mm}^{3}}) obtained the highest value of density (the lowest amount of porosity), in the second part of the experiment, the microstructure development and corrosion resistance evolution were investigated under the different scanning strategies (stripe, island, and continuous) at a constant energy of 60.9 (frac{J}{{mm}^{3}}). The rotation angle in all scanning strategies for each layer is 67°, as shown as a schematic of scan strategies in Fig. 1e. In previous studies, it has been determined that an angle of 67° leads to a more homogeneous microstructure. The main reason is that with the rotation of 67°, the position of the melt pools in the new layer and the previous layer has a mismatch, which leads to the suppression of columnar growth, and fiber texture as well as the reduction of porosity26. It is worth mentioning that the continuous scan strategy has a laser reciprocating pattern, while in the stripe scan strategy, the length of the laser reciprocating movement is several times smaller because the stripe lines are a barrier to the laser movement (Fig. 1e). This bidirectional movement of the laser is repeated in different bands with a specific distance. In the case of the island scan strategy, the material deposition layer is divided into square domains, which exist in each scanning island of the bidirectional strategy.
Characterization
The density of each sample was measured using the mapping density and Archimedes method according to the ASTM B962-17 on five separate occasions, and the average density value was subsequently reported. To analyze the microstructure evolution, the samples were cut parallel to the building direction. After mechanical polishing with silicon carbide sandpaper, the specimens were polished in different sizes of 6, 3, and 1 µm. Eventually, the samples were polished on a vibratory polisher using oxide polishing suspensions (OPS) mixed with water for 6 h. To reveal the solidification substructure, polished samples were etched with Kaling etch solution (100 ml Hydrochloric acid, 5 g Copper Chloride, and 100 ml Ethanol). The ImageJ software was used to measure microstructure features. The cells were measured as an average of at least 30 measurements and 3 random positions using the line method based on ISO 64: 2019 standard for each sample. To ensure accurate melt pool measurements, those with shapes closer to semicircles were selected. These melt pools, unaffected by rotation or elongation, are likely formed by a laser path perpendicular to the analyzed cross-section. Once selected, the deepest point on the boundary of the melt pool in the building direction was considered as the melt pool depth, and the boundaries were extended to this reference line. The height and width of each melt pool were then measured, and their averages for each sample were used to calibrate and validate the model. A scanning electron microscope (SEM) equipped with a high-resolution (1244 × 1024 pixels) Oxford Electron back scatter diffraction (EBSD) detector was used to investigate the microstructural evolution of the samples (including grain size, crystallographic orientation, and morphology).
Electrochemical evaluation
Electrochemical measurements in DC and AC modes were applied to three types of LPBFed 316 L stainless steel samples, namely continuous, island B/W, and stripe samples. These three samples were fabricated using the highest energy density (60.9 J/m3) and different scan strategies during the LPBF process, resulting in the highest degree of density. Sampling for the electrochemical measurements was performed by removing samples’ surfaces that were parallel to the building direction (BD) of the LPBF process. In addition, each surface was also divided into two areas and then mounted in epoxy resin, leaving a two-dimensional area of 0.304 to 0.344 cm2 exposed to the electrolyte. The locations of the specimens cut for the electrochemical measurements are also shown in Fig. 1h.
Electrochemical tests were conducted in a three-electrode electrochemical cell connected to a computer-controlled Gamry potentiostat/galvanostat model reference 600 + , with a graphite rod serving as the counter electrode, a saturated Ag/AgCl reference electrode, and the LPBF 316 L stainless steel samples as the working electrodes. Before each test, the working electrodes were wet-polished to achieve a mirror-like surface, followed by rinsing with distilled water and absolute ethanol. Electrochemical corrosion measurements were obtained after immersing the samples in a 3.5 wt% NaCl solution for 24 h at open circuit potential (OCP) and at room temperature. Before commencing the electrochemical measurements, the OCP of the samples was monitored for 1 h to attain a semi-constant potential. Electrochemical impedance spectroscopy (EIS) data were acquired from the sample surfaces at OCP over a frequency range of 100 kHz to 0.01 Hz with an AC amplitude of ± 10 mV (rms). To determine the electrical parameters of an electrochemical reaction by fitting an appropriate equivalent electrical circuit (EEC), the EIS experimental data were analyzed using Z-View software. Subsequently, the samples immersed in the 3.5 wt% NaCl solution were polarized from −0.5 V (versus OCP) up to 1.5 V (versus OCP) at a scanning rate of 0.166 mV/s. All experiments were repeated at least three times to ensure the reliability of the reported data in the manuscript.
Theory
Based on established research in welding36 and additive manufacturing, the solidification velocity of grains in the melt pools can be calculated based on R ≅ VCosα, where V is the welding speed in welding and the laser scanning direction in additive manufacturing. The velocity of the liquidus isotherm demonstrates a non-monotonic pattern of change. This pattern is a result of the gradual variation in the angle (α) between the normal to the liquidus isotherm and the solidification direction. The schematic outlining the procedure for determining the angle between the laser scanning direction and the heat temperature gradient is shown in Fig. 2. At the deepest point of the melt pool, the temperature gradient direction is perpendicular to the laser scanning direction, and as a result, Cos90° = 0 and subsequently R ≅ VCosα equals zero. Although, at this point, the temperature gradient (G) experiences its highest value. As we move from the lowest point of the molten pool towards the edges and the top of the pool, the angle between the boundary’s normal vector and the solidification direction diminishes. Therefore, the angle between these two vectors is zero, which results in Cos0° = 1, and then R ≅ Vcosα = V 37. It should be noted that in this statistical method, the laser scanning direction is assumed to be firm without any rotation or turns.
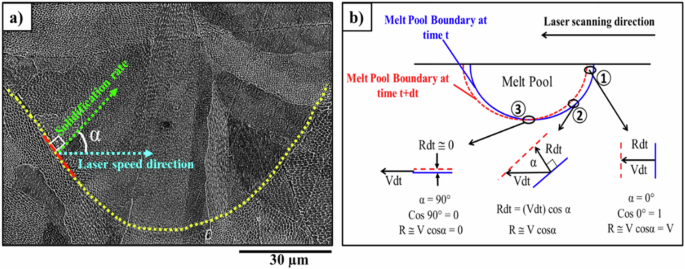
a The laser speed and solidification rate directions. b Schematic of the angle (α) between the laser speed direction (V) and the solidification growth direction (R) in different positions of the melt pool boundary; At point 1, the solidification growth and the laser speed direction are the same and the α is zero. Therefore, based on R @ Vcosα = V, the solidification growth rate and the laser speed are equal. In the area 3, since the solidification growth direction is perpendicular to the direction of the laser speed, R @ Vcos90° = 0, while in the boundaries similar to the region 3,the α is different depending on the angle between R and V and R @ V cosα at any point of the melt pool boundary.
Simulation
A three-dimensional transient heat transfer model was employed to attain a comprehensive understanding of the temperature distribution inside and around the melt pools, for both the continuous and stripe scan strategies. The finite element (FE) method was introduced and implemented in the ABAQUS software utilizing custom subroutines. The model employed a multi-track and multilayer three-dimensional heat transfer approach, integrating a moving heat source following a reciprocating bidirectional pattern. This heat source rotates at a 67° angle on the x–z plane’s orthogonal surface in the “y” direction, accompanied by a 67° rotation in subsequent layers. The continuous scan vectors encompass the entire scanning region, while the stripe scan vectors traverse the stripe width, also at a 67° angle. To ensure simplicity and practicality, several assumptions and simplifications were adopted within the model:
-
1.
The powder bed was considered a continuous and homogeneous medium.
-
2.
Transitions between powder, liquid, and solid phases were considered, within the region, where solid and liquid coexist designated as a mushy zone.
-
3.
Metal evaporation was not accounted for. These assumptions were chosen to streamline the modeling process and concentrate on critical aspects of the heat transfer analysis.
Five layers of 316 L powder were stacked, each layer measuring 2.7 mm × 2.7 mm × 0.25 mm (with a 50 μm thickness per layer), onto a dense substrate sized 2.7 mm × 2.7 mm × 0.9 mm. The scanning region’s dimensions in the x–z plane for each powder layer were 1.5 mm × 1.5 mm. Both the laser scanning region and the adjacent powder bed employed a fine hexahedral mesh with elements measuring 15 μm × 15 μm × 10 μm. A portion of the substrate beneath the scanning region, extending to a height of 0.2 mm, was also finely meshed using hexahedral elements. This refinement ensures accurate prediction of temperature distribution around the molten pool. Conversely, areas encompassing the loosely arranged powder bed and substrate were coarsely meshed.
This meshing approach remained consistent in both thermal and structural analyses throughout the simulation. The laser beam contributes to heat transfer through radiation to the powder bed, although conduction has a significant impact on heat transport. The governing equation for conduction is expressed as follows38,39:
where ({C}_{p}) is specific heat capacity, (T) signifies temperature, (rho) represents material density, (partial T) stands for temperature gradient, (Q) is internal volumetric heat generation, (t) denotes time, (k) is thermal conductivity, and ({alpha }_{x}), ({alpha }_{y}), and ({alpha }_{z}) are enhancement factors applied to (k). The calibration of these enhancement factors was carried out to minimize the discrepancy between the predicted melt pool size and the experimental outcome40.
In this study, the enhancement factors remain constant at 1 when the material temperature is below the melting point. However, when the phase transitions to the liquid state, these factors are determined to be 10, 25, and 10 for(quad {alpha }_{x}), ({alpha }_{y}), and ({alpha }_{z}), respectively.
In LPBF and various other additive manufacturing techniques, conduction is the predominant mode of heat transfer, accompanied by a fraction of heat being transferred through radiation and convection, which contributes to heat loss. The radiative heat loss is quantified using the Stefan-Boltzmann law, while convective heat loss can be described as follows:
where σ stands for the Stefan-Boltzmann constant, ε represents radiation emissivity, h denotes the convective heat transfer coefficient, and ({T}_{a}) signifies the ambient temperature. The parameters are detailed in Table 1. In addition, the adiabatic boundary condition at the bottom surface of the substrate is defined as41:
The initial condition, ({T}_{0}), of uniform temperature distribution throughout the whole base plate and powder bed is considered as:
To ensure precise temperature predictions, several material properties such as density, and specific heat need to be considered as temperature-dependent, particularly given that the material can exist in all three phases, powder, liquid, and solid (as illustrated in Table 1)39.
The homogeneous and continuous powder bed is characterized by specific thermal properties that are contingent upon the porosity of the powder bed42. The effective thermal conductivity of the powder bed is computed using the solid thermal conductivity as outlined in the Eq. (6) 43:
where ({k}_{{solid}}), ({k}_{{gas}}), (phi) are thermal conductivity of dense 316 L, argon gas, and porosity of powder bed, respectively. In addition, the exponential factor, (psi), can be expressed as Eq. (7) 43:
The effective powder density is determined using the powder’s porosity and the properties of the bulk material, as expressed by the Eq. (8) 43:
During the interaction of the laser beam with the powder bed, a fraction of the energy is absorbed by powder bed particles, while the remainder undergoes multiple reflections within the inter-particle gaps39,41,44,45. The intensity of penetrated beams diminishes exponentially in the depth direction, in accordance with the Beer-Lambert law46. The Gaussian heat source model is recognized as the most employed heat source for representing volumetric heat distribution44,47,48:
where (A) is laser absorption coefficient, (P) is laser beam power, (eta) stands for the optical penetration depth, (r) denotes radial distance from the laser axis, and ({r}_{0}) is laser beam radius. Considering the existence of elements such as Cr, Fe, and Mn, which exhibit a great affinity for oxygen, a certain degree of oxidation reaction is inevitable during the gas atomization process. The absorptivity of 316 L powder particulate oxide has been shown to vary from 0.36 to 0.55 ± 0.2, as determined through measurements46.
The latent heat produced during phase changes, such as melting and solidification, cannot be disregarded because it influences simulation accuracy38. In such situations, enthalpy is utilized to represent the latent heat and is formulated as a function of temperature:
In the mushy zone, which corresponds to the temperature range between the solidus and liquidus temperatures, the effective specific heat capacity is considered. This is necessary to incorporate the release of latent heat during melting and the absorption of latent heat during solidification49.
where (Delta H) is the latent heat of fusion, ({T}_{l}) stands for liquidus temperature and ({T}_{s}) denotes solidus temperature.
Results
Energy density
In the first part of the present work, to determine the optimal input energy required to achieve the maximum density in 316 L samples, four input energy levels from 44 (frac{{boldsymbol{J}}}{{{boldsymbol{m}}}^{{boldsymbol{3}}}}) to 60 (frac{{boldsymbol{J}}}{{{boldsymbol{m}}}^{{boldsymbol{3}}}}) were examined using the stripe scan strategy. Figure 3 illustrates the inverse pole figure (IPF) maps at low (Fig. 3a–d) and high magnifications (Fig. 3e–h) providing insights into the microstructural evolution of 316 L fabricated under varying energy input conditions. Accordingly, the energy input significantly affects both the microstructure and the occurrence of significant defects in the LPBF process50,51. As depicted in Fig. 3a, i, a substantial lack of fusion (LOF) volume fraction is evident at an energy density of 44.4 (tfrac{{boldsymbol{J}}}{{{boldsymbol{m}}}^{{bf{3}}}}) with a corresponding relative density of 96.4%.
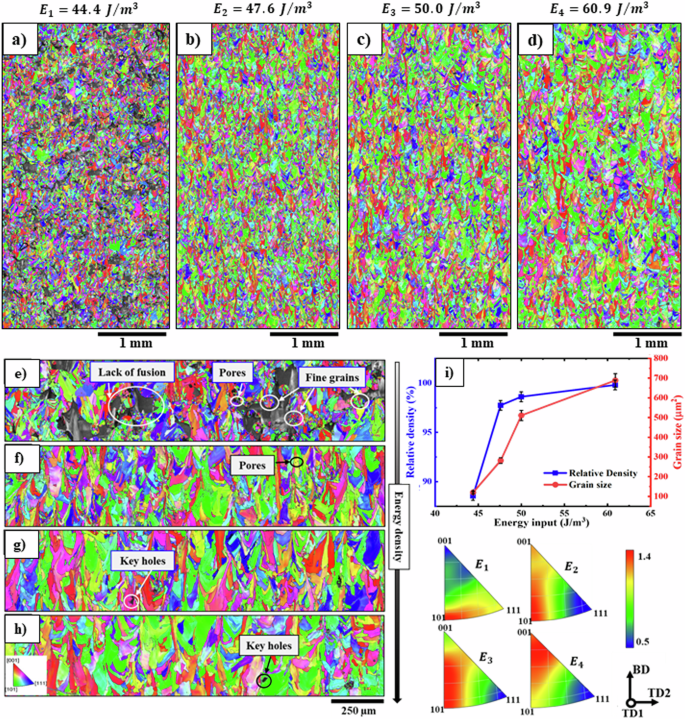
Low and high magnification BD-IPF maps of the microstructure of the samples fabricated using Stripe scan strategy in various input energies of a and e 44.4 ({textstyle tfrac{J}{{m}^{3}}}); b and f 47.6 ({textstyle tfrac{J}{{m}^{3}}}); c and g 50.0 ({textstyle tfrac{J}{{m}^{3}}}); and d and h 60.9 ({textstyle tfrac{J}{{m}^{3}}}), respectively. i Evolution of relative density, grain size, and melt pool dimensions with increasing energy. The sample manufactured with the lowest amount of energy input illustrates a significant volume fraction of lack of fusion defect, which are surrounded by very small grains attributed to thermal insulation. With increasing the energy, a substantial reduction in the volume fraction of porosity can be seen and at energy density of 60.9 (frac{J}{{m}^{3}}) (the relative density has reached 99.8%), and the grains size and melt pools experienced a noticeable increase.
One of the most important large defects in samples manufactured in low density is LOF defects that can be caused due to different reasons, including inadequate energy input, improper scan strategy, or insufficient powder bed preparation52. The LOF defects typically occur due to insufficient melting or bonding of adjacent layers, which results in a discontinuity in the melt pool and a reduced heat input to the surrounding material53. Therefore, the grains around the LOF defects experience a rapid cooling rate and solidify quickly, resulting in finer grains formation (Fig. 3e). In LPBF, while the laser moves across the powder bed, the Bernard Marangoni-driven instability (BMI) generates a localized high-temperature zone at the melt pool center54. This temperature differential triggers the Marangoni effect, causing the liquid metal to migrate from hot to cold regions. BMI’s non-uniform melting and solidification can result in inadequate fusion between certain regions, leading to gaps and defects.
As the first result of the increase in input energy, it can be mentioned a decrease in porosity and a rise in density. Increasing the energy input during LPBF can improve the density of the final product by several mechanisms as follows: First, the additional energy can help to melt and fuse the powder particles more effectively, resulting in fewer voids or defects in the final structure. Second, the higher energy input can increase the temperature of the melt pool, allowing for better flow and wetting of the surface, which can lead to better bonding between adjacent layers. Eventually, the increased energy can also help to diminish residual stresses in the final structure, which can lead to fewer defects and better overall density1.
Another reason for improving the density by increasing the input energy is dynamic viscosity (µ), which refers to the velocity of a moving object or fluid at any given moment in time. Dynamic viscosity depends on various parameters such as absolute temperature (T) and liquid surface tension (γ) written as Eq. (12)18,55:
where m and K are atomic mass and the Boltzman constant, respectively. Raising the energy input during the process results in an elevation of the absolute temperature (T) and a decrease in liquid surface tension (γ), then these changes will result in a reduction in dynamic viscosity (µ). When the viscosity is lower, the melt reaches the previous solidified layer more easily to prevent balling and filling the density1. If high energy is applied, a strong temperature gradient occurs on the surface, and this gives rise to a surface tension gradient, referred to as the Marangoni convection flow. Marangoni convection serves as a driving force for the spreading of the molten material across the preceding layers, resulting in an increase in density at a higher energy18. Therefore, the primary factors contributing to the increase in density are lower viscosity, the presence of Marangoni convection flow, and a larger melt volume.
The sample fabricated at an energy of 60.9 (frac{J}{{m}^{3}}) has reached the maximum relative density of 99.8% (Fig. 3i). An increase in energy results in a pronounced grain coarsening, from approximately 120 to 690 µm², as shown in Fig. 3i. This is accompanied by a transition in orientation from the Rotated Cube texture component (<101> orientation) to the Goss texture component (<100> orientation), though the overall texture intensity remains low.
Scan strategies
Addition to the laser speed and power parameters, the scan strategy in LPBF can exert a substantial influence on both the microstructure and the properties. The scan strategy refers to the specific pattern of laser scanning used to fabricate the part layer by layer. It determines the path that the laser beam follows as it melts the metal powder. Therefore, after estimation of optimal energy density, diverse scan strategies of stripe, islands, and continuous were considered in this work, as shown in Fig. 1e. As illustrated clearly in Fig. 4a–d, alterations in the scanning strategy have yielded grains of varying sizes. The stripe scan strategy led to the largest grain size of 688.6 µm2 (Fig. 4f), while the continuous scan strategy resulted in the smallest grain size (205.2 µm2). Interestingly, both the island random and black/white strategies, which include domains spaced equivalently to the stripes in the stripe strategy, showed no significant impact on grain size alterations.
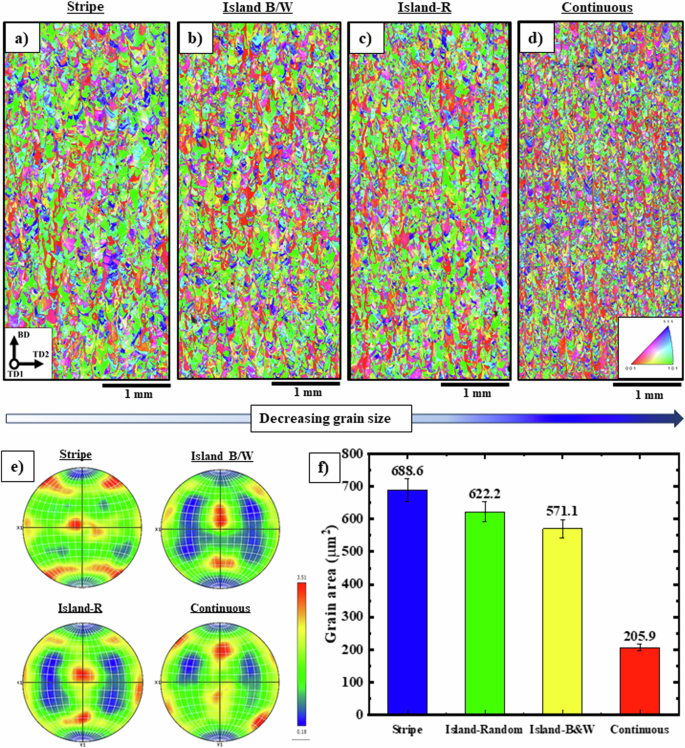
Large-IPF maps of samples fabricated at constant energy input of 60.9 (frac{J}{{m}^{3}}) in diverse scan strategies including a stripe, b island B/W, c island-R, and d continuous associated with e The related pole figures of {111} plane and f 3D bar chart of grain size distribution in various energy density and scan strategies. It is clearly known that changing the scan strategy at constant energy leads to severe microstructural evolution. Based on the pole figures and grain size distribution, by changing the scan strategy from stripe to continuous, the texture component orientations changes from Brass {001} <110> to Goss {112} <110> as well as the average equivalent diameter of grains has decreased by approximately 50%.
The main effect of scan strategies is on the thermal history (the heating and cooling rate) of the microstructure. In each strategy, the duration of the laser exposure to a local area of the sample is influenced by the specific scanning pattern employed. The differential exposure duration can have an undisclosed effect on the sample’s cooling rate. To elaborate further, the stripe strategy, similar to the island strategy, involves the use of strips (or domains in island strategy) with parallel distances (Fig. 1e). Due to the structure of this strategy, the round-trip path of the laser in each layer is more limited and shorter compared to the continuous strategy. Consequently, the heat retention in the previous powder layer of a region of the sample is greater, resulting in a lower cooling rate than other scanning strategies. In other words, the cooling rate, defined as G (thermal gradient) × R (solidification rate), controls the fineness of grains; a higher G × R value results in finer grains. This is the main reason for the resulting grain size. This slow cooling rate allows more time for the atoms to diffuse and form a coarser-grained microstructure37.
In a continuous scan strategy, the laser beam scans continuously over the powder bed in a back-and-forth motion, melting and solidifying the metal powder in a series of parallel lines (detailed in the methods section). In this laser pattern, the laser travels a longer distance, and this leads to a reduction in the time of maintaining heat in the region, decreasing the heat accumulation, and subsequently to an increase in the cooling rate of the alloy. This results in more uniform heating and cooling of the metal powder, with little variation in fine grain structure within the part. Therefore, the stripe pattern typically leads to the largest grain size, while the continuous scan yields the smallest grain size. Hence, depending on the desired properties of the sample, the grain size can be controlled by selecting the appropriate scanning strategy. This knowledge is particularly important in the design and fabrication of advanced materials, where the ability to control grain size is critical to achieving desired material properties. As seen in Fig. 4e, changes in strategies result in the modification of texture components in pole figures of the {111} plane. Specifically, the printed sample using stripe shows the Brass {001} <110> texture component, while the Island B/W and continuous strategies illustrate the orientation of Goss {112} <110> texture components.
The impact of process parameters extends beyond just grain size, as it can also affect the size of the melt pools. This, in turn, can influence the solidification mode of the material. Figure 5a–c indicates the average size of the melt pools for the samples manufactured by stripe, island-B/W, and continuous scan strategies. The sample fabricated by stripe pattern exhibited the largest melt pool width (approximately 210 ± 19 µm). In contrast, samples manufactured by island-B/W and continuous, displayed smaller melt pool widths of 150 ± 15 and 130 ± 15 µm, respectively.
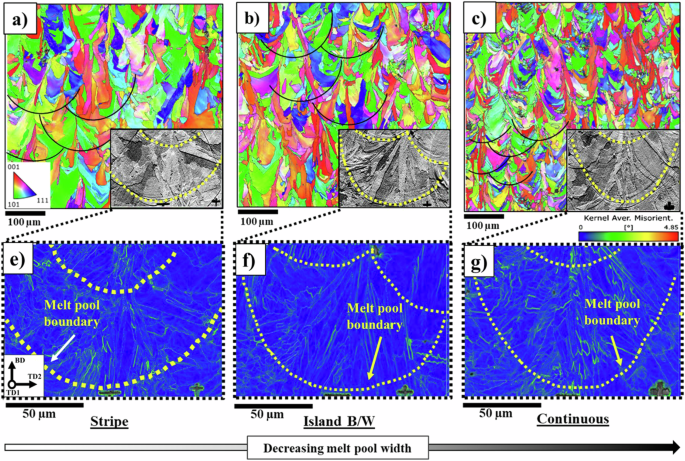
Low- and high-magnification electron back scatter diffraction (EBSD) images of melt pools formed in LPBF 316 L microstructure manufactured by a and e stripe, b and f island B/W, and c and g Continuous scan strategies along with KAM maps. The stripe and continuous scan strategies have led to the formation of the largest and smallest melt pools, respectively.
In the kernel average maps (KAM) (Fig. 5e–g), discernible residual strains were observed around the sub-grain (cellular) boundaries. Moreover, it can be seen that the epitaxial growth of grains becomes apparent toward the central region of the melt pools. The columnar grain growth is caused by the vertical direction of the thermal gradient. The direction of the heat flux is influenced by convective heat transfer and the fluid flow within the melt pool due to heat and mass transfer and as a result the direction of dendrite growth56. The sample additively manufactured by the continuous strategy has shown the melt pools like a nail-head. The formation of this melt pool can be ascribed to favorable thermocapillary movement. This convectional motion travels from the center of the molten pool towards its lower section because it disperses heat more effectively downward compared to around the molten area. As illustrated, the primary growth of columnar grains occurs at right angles to the edge of the melt pool. The flow of molten material opposes the primary direction of heat transfer, thereby determining the primary direction of solidification37.
Substructure evolution
It is evident that each grain consists of a cluster of cellular dendrites aligned in the same orientation as the grains. Figure 6 demonstrates the influence of different strategies in the LPBF process on cellular size (both equiaxed (Fig. 6a–c) and columnar cellular (Fig. 6d–f). The cell size decreases with varying the scan strategy from stripe to, island B/W, and continuous, respectively. To have a comprehensive understanding of substructure evolution by alternating the process parameters, the plots in Fig. 6g, h summarize the grain size and primary dendritic arm spacing (cell size) evolution of all samples studied in this study, respectively. In areas where the energy density (P/V) is elevated, both cell and grain size are higher. This suggests that as energy input increases, the cellular structure becomes coarser because of a reduced cooling rate.
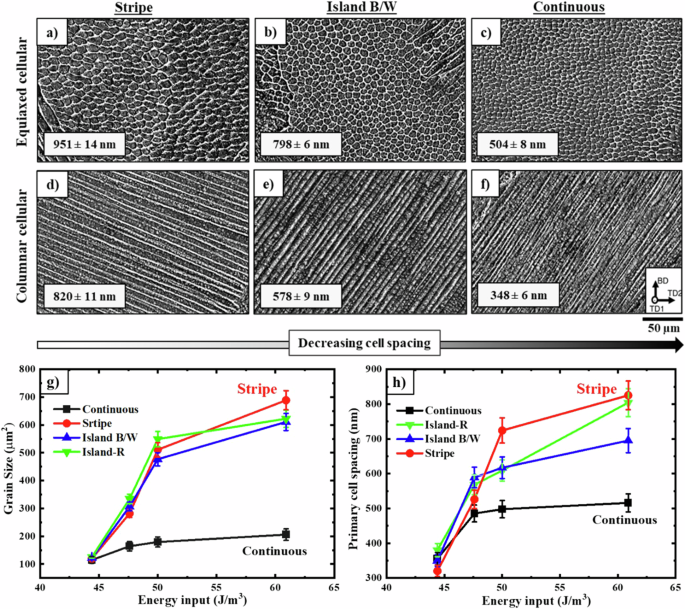
SEM images of sub-structures (columnar and equiaxed cellular) of printed samples by three different scan strategies of a and d stripe, b and e island black/white, and c and f continuous. As can be seen, the largest size of the cells (columnar and equiaxed) is related to the sample fabricated by the stripe strategy and the smallest cells created using continuous scan strategy. g Grain size as a function of energy input indicating the stripe strategy has resulted in the creation of the largest grain size, while the continuous strategy has led to the smallest grain size. h The cellular changes depicted in the graph correspond to an increase in energy. Remarkably, the evolution of the cells exhibits an ascending trend similar to that of grain dimensions.
The thermal gradient (G) to solidification rate (R) ratio is a crucial factor that impacts the solidification microstructure, which serves as a significant control parameter. In the context of multilayer LPBF, the influence of this parameter (G/R) on the creation of a columnar or equiaxed cellular structure has been previously explained23,26,56. The modification of intragranular cell spacing could be attributed to the differences in thermal history and undercooling levels within the melt pool, which vary depending on the chosen scan strategies. Therefore, not only can grain size at the micron scale be controlled, but also the size of the cells at the nanoscale can be designed through the manipulation of energy and scanning strategies.
Modeling
The microstructural analysis revealed that the specimen fabricated using the continuous strategy exhibited the smallest grain size, melt pool size, and cell size. Conversely, the opposite trend was observed for the stripe strategy. To gain a deeper comprehension of the connection between solidification factors and microstructure, a model has been proposed for the diverse scan strategies and energy inputs. Figure 7a–d showcases the predicted melt pool dimension as a function of linear energy density for both stripe (Fig. 7a, b) and continuous (Fig. 7c, d) scan strategies. To calibrate the model proposed in this study, an examination of the predicted melt pool dimensions is conducted at the energy densities of 60.9 and 50.0 J/mm3. It is worth highlighting that the projected trend of decreasing depth as the P/V ratio decreases aligns closely with the experimental findings.
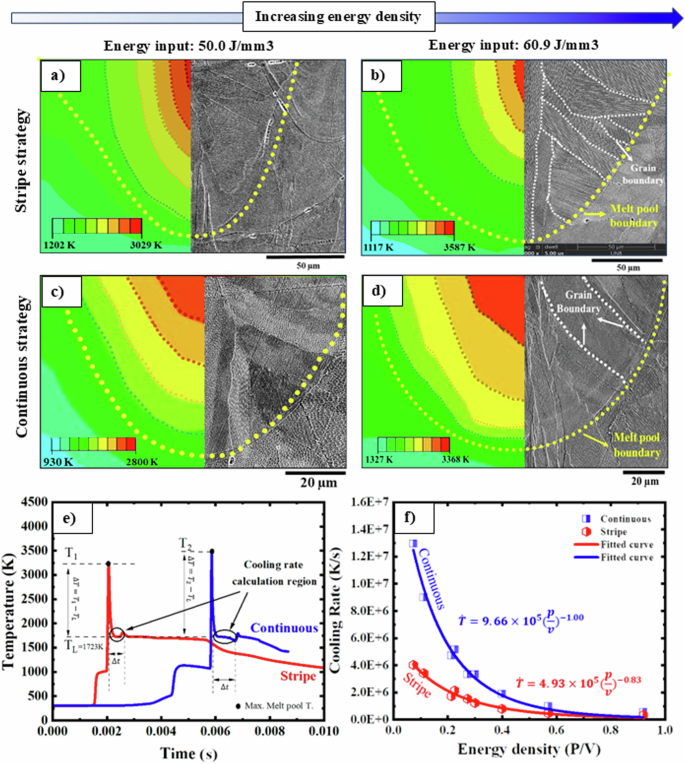
Simulated melt pool dimensions of the 316 L SS samples manufactured at different energy density of a 50.0 J/mm3/stripe strategy (calibration) and b 60.9 J/mm3/stripe strategy (validation). As can be seen, the dimensions of the predicted melt pools are completely consistent with the experimental melt pools which confirms the model presented in this work. c The predicted melt pool for samples printed at energy density of 50.0 J/mm3/continuous strategy. d The predicted melt pool for samples printed at energy density of 60.9 J/mm3/continuous strategy. e Temperature variation over time for both strategies. f Simulated cooling rates ((dot{T})) samples fabricated using stripe and continuous scan strategy in different energy density (P/V). As the energy density in the LPBF process increased, the cooling rate decreased dramatically, while the cell spacing increased.
The temperature variation of a specific element within a melt pool over time is illustrated in Fig. 6e for both the stripe and continuous strategies. The bidirectional stripe scan vector reaches a designated area more quickly compared to the continuous strategy, as the stripe only needs to traverse the width of the stripes, while continuous scanning covers the entire area of the part. Consequently, this results in a higher cooling rate for the continuous strategy compared to the stripe strategy, attributed to the reduced exposure time of continuous scanning in specific areas. It is evident that the temperature reaches its maximum value under the laser beam and subsequently decreases after the laser passage. A thorough analysis of the graphs reveals a minor peak preceding the plateau, which arises due to the overlap of scan vectors.
Consequently, to establish the correlation between the cooling rate and the energy density, the model predicted cooling rates for various laser powers and speeds, as shown in Fig. 7f. As the energy density in the LPBF process increased, the cooling rate decreased dramatically. The important point is that the cooling rate in the printed sample with the continuous strategy is noticeably higher than the cooling rate in the sample manufactured with the stripe strategy. This highlights the smaller grain and cell size in the continuous strategy.
It is well-known that the solidification microstructure formed at different depths of the pool are directly influenced by the solidification parameters, specifically the solidification velocity (R) and the thermal gradient (G)23. The prediction of the microstructures resulting from the solidification of specific alloys in the AM process has relied on theoretical assumptions57,58,59,60. In steady-state processes, the thermal gradient reaches its maximum value when the solidification velocity is at its minimum (Fig. 8a). This phenomenon occurs at the bottom of the melt pool (melt pool boundary) corresponding to the transition between remelting and solidification and leads to grow the columnar cells. As the thermal gradient decreases with increasing distance from the boundary of the melt pool, the growth of columnar cells can be entirely halted.
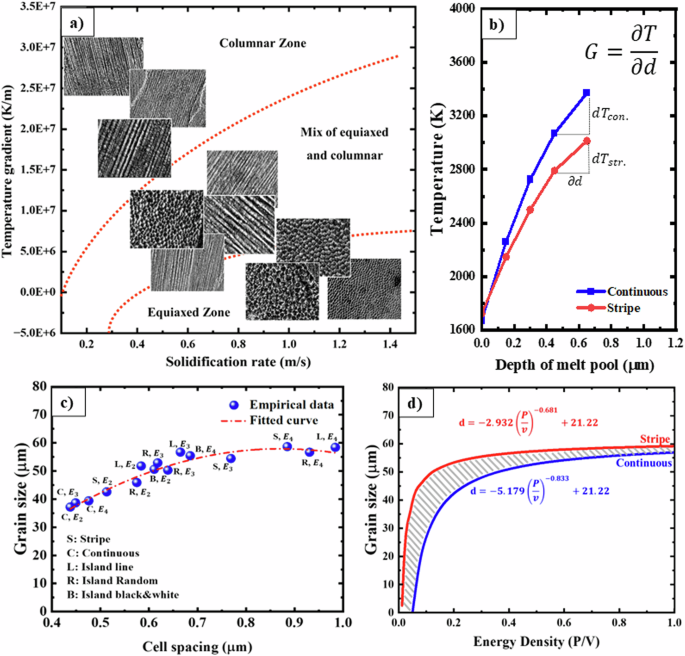
a Empirical solidification map of the LPBF 316 L. b Predicted temperature-time curve. c Grain size as a function of the cell spacing; based on the curve fitted with the data, the relationship between grain size and cells is (d=left(-3.237right){{rm{lambda }}}^{-2.524}+62.12). d Grain size versus energy density curve indicating in a constant energy density, the largest grain size is produced for the stripe strategy, while the smallest grain size is achieved for the continuous strategy.
The temperature variations as a function of distance from the melt pool boundary are presented in Fig. 8b for the two discussed scanning strategies. The analysis of temperature gradient changes and solidification rates at various distances from the melt pool boundary can be justified using these diagrams. Specifically, as the distance from the perimeter of the melt pool expands, the slope of temperature changes, and consequently, G, decreases. It is also noteworthy that the temperature variations at a specific depth are more pronounced for the continuous strategy compared to the stripe strategy. Examining the mean grain size of the samples in relation to their corresponding cell spacings, as illustrated in Fig. 8c, reveals a mutually influential connection. This implies that the manipulation of cell spacings can affect grain size, and conversely, modifying grain size can impact cell spacings. By considering the correlation between cell size and cooling rates, as well as the link between cooling rates and energy density as derived from Fig. 8f, it becomes feasible to establish a connection between grain size and energy density, as depicted in Fig. 8d. In a constant energy density, the stripe strategy yields the largest grain size, while the continuous strategy results in the smallest grain size. Consequently, there exist two distinct equations for controlling grain size based on energy density, each tailored to its respective scanning strategy. These relationships are further elucidated in the discussion section.
Corrosion performance
Potentiodynamic polarization experiments were conducted in a 3.5 wt% NaCl solution to compare the electrochemical response of LPBFed 316 L stainless steel components fabricated using three different scan strategies. Figure 9a displays representative plots for various processing routes of the LPBF process, such as stripe, island B/W, and continuous strategies. In addition, it includes KAM maps derived from the EBSD results, enabling the estimation of differences in residual stresses by identifying areas with higher KAM values. The effect of scan strategies as the variable parameter during the LPBF process on the electrochemical behavior of the samples, in the form of corrosion density (jcorr), corrosion potential (Ecorr), and pitting potential (Epitting), is detectable from the potentiodynamic polarization plots (Fig. 9a). The variations of jcorr, Ecorr, and Epitting are shown in Fig. 9b, wherein the jcorr of the continuous samples is about two and three times lower than those of island B/W and stripe samples, respectively. In general, LPBFed 316 L stainless steel samples fabricated by continuous scan strategy show the lowest jcorr and the highest values of Ecorr and Epitting among the two other samples, indicating higher corrosion resistance of this type of sample in the chloride solution compared to those printed by island B/W and stripe strategies. In addition, passive regions are formed on the surface of all samples; however, significant differences are observed in their passivity characterizations. Figure 9c also presents the average value and standard deviation of the difference between the potential at which a significant increase in the anodic current is observed (Epitting) and Ecorr. These values indicate the passivity range of each specimen in the anodic polarization curves. The results suggest that a rather extended passive behavior is formed on the surface of the continuous scan strategy sample, while the passive regions for island B/W and stripe-printed samples are smaller than those for the continuously printed sample.
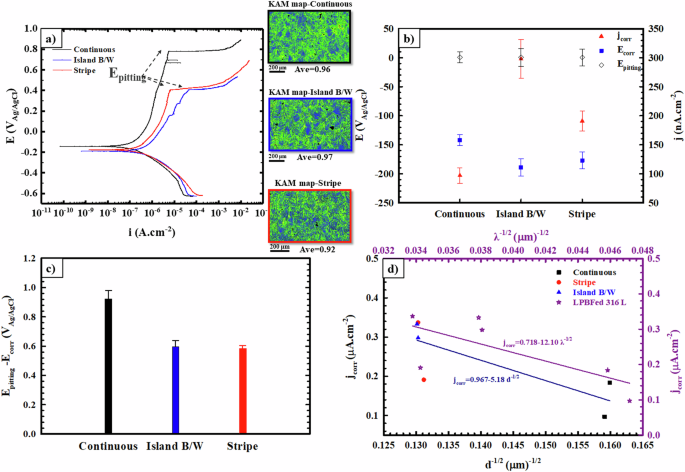
a Potentiodynamic polarization curves of the LPBFed samples fabricated by three different scan strategies, with the KAM maps of three samples inserted in this figure. b Average corrosion potential, corrosion current density and pitting potential for all samples, c passivity region calculated as the difference between pitting potential and corrosion potential. d A plot with linear regression showing a relationship between jcorr and grain size/cellular size.
The variations in electrochemical parameters among the three different LPBF-processed samples provide insights into the differences observed in their microstructural features developed during the LPBF process with various strategies. The potential existence of a plausible relationship between the grain size of the samples, a key microstructural feature that changes during printing with different strategies, and the electrochemical parameters, especially jcorr, is also examined. Figure 9d also presents an abridged overview of the average jcorr values for the different LPBF-processed samples plotted against grain size (d) raised to the power of −1/2. Employing a power transformation of the data in Fig. 9d aimed to illustrate the potential presence of a plausible Hall-Petch relationship between jcorr and ({{rm{d}}}^{-1/2}). Each data point displayed in Fig. 9d represents the average of at least three experiments and is indicative of each scan strategy applied during the LPBF processes. The trend lends itself to linear regression, revealing a relationship suggesting that as grain size decreases, corrosion rate decreases. The linearization aims to demonstrate a general relationship between grain size and corrosion current density across three different scan strategies of the LPBF process, acknowledging the presence of outliers in the data. While the scattering in the data shown in Fig. 9d may arise from inherent challenges in measuring the true grain size from two-dimensional images, as well as the effects of changes in other microstructural features such as the development of textures and residual stresses, it appears that an overriding effect persists. In other words, the prominent distinctions in microstructural features among the three LPBF-printed samples, resulting from varying scan strategies, primarily stem from significant variations in grain sizes derived from their cellular structures formed during the LPBF process. This observation stands out in comparison to other microstructural parameters. Therefore, the presence of a liner trend between jcorr and ({{rm{d}}}^{-1/2}) is more apparent in the data presented in Fig. 9d.
Furthermore, EIS tests were employed to compare the relative stability of the passive films formed on the LPBFed 316 L stainless steel samples fabricated using three different scan strategies, confirming the initial conclusions drawn from the DC electrochemical tests. Figure 10a, b illustrates the EIS results represented in the forms of Nyquist and Bode plots, respectively, where the points represent the experimental data, and the solid lines depict the fitting results. The Nyquist diagrams of the EIS spectra exhibit a similar shape for all samples, characterized by a somewhat incomplete capacitive semi-arc, indicating a similar passive mechanism, as depicted in Fig. 10a. A preliminary qualitative analysis of the EIS spectra concerning the samples’ corrosion resistance can be conducted by considering the diameter of the semicircles: generally, a larger diameter suggests greater corrosion resistance of a material61. Hence, the initial analysis suggests that samples fabricated using the continuous strategy exhibit the highest resistance to general corrosion, as they demonstrate the largest diameter of the capacitive semi-arc in their Nyquist plot compared to the other samples.
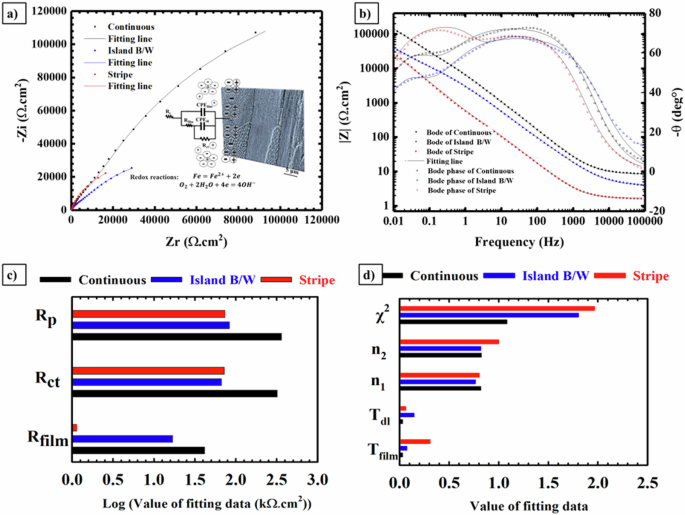
a Nyquist plots with the EEC model inserted in. b Bode plots. c Fitted resistance parameters for impedance spectra using EEC model, and d the fitted values of the capacitance parameters for the CPE element in unit of μF sn−1 cm−2, n values as the constant phase exponent, and the chi-squared (χ2) values ×1000.
Moreover, in the Bode plots (Fig. 10b), a linear region with a slope close to −1 can be observed in the impedance moduli over a wide range of frequencies, with corresponding phase angles evolving between 60° and 80°, indicating that the formed passive film is primarily capacitive. In the low-frequency area, the impedance modulus value (at a frequency of 0.01) of the LPBFed sample fabricated using the continuous strategy is significantly higher (about 140 kΩ·cm2) compared to those of the island B/W and stripe scan strategy printed samples (about 40 and 65 kΩ·cm2, respectively), consistent with the arc diameters observed from their Nyquist curves, indicating greater resistance to charge transfer and higher corrosion resistance. The Bode phase diagrams of all samples also exhibit two-time constants observed at low-frequency and high-medium frequency ranges of the EIS spectra, corresponding to the presence of charge transfer reactions: oxidation of the substrate/oxygen reduction through the double layer and the passive layer formed on the surface of the samples, respectively. The noticeably lower maximum phase angle of the LPBFed samples printed by island B/W and stripe strategies in the medium-high frequency range of the Bode phase plots compared to that of the LPBFed sample fabricated by the continuous strategy indicates a reduction in the passivity behavior of the oxide layer formed on the surfaces of the LPBFed samples fabricated by island B/W and stripe strategies.
Consequently, a more detailed analysis of the EIS spectra was conducted by fitting them using an equivalent electrical circuit (EEC) inserted in the Nyquist plots (Fig. 10a). In the EEC, the high-frequency time constant (Rfilm and CPEfilm/Tfilm) is associated with the passive film resistance and its pseudo-capacitance, respectively, specifically referring to the processes of charge transport (ions and electrons) through and charge distribution/separation within the passive layer. On the other hand, the second parallel combination of Rct and CPEdl/Tdl is linked to the charge transfer resistance and electrochemical double-layer capacitance, respectively. In addition, considering that corrosion of the material involves both electron transfer and charge (ions) transport, the sum of the two resistances (Rct and Rfilm) defines the total resistance of the materials to general corrosion, i.e., the polarization resistance, Rp62. Notably, the constant phase element (CPE) in EEC was employed to simulate the behavior of an imperfect capacitor because the double-layer and passive layer are not purely capacitive and often exhibit a certain frequency dispersion due to surface irregularities61,63. In such cases, the impedance of the ideal capacitor, 1/(jωC), must be replaced by the impedance of a CPE as follows61:
where T is the parameter related to the electrode capacitance (F sn−1 cm−2), ω is the angular frequency, j is the imaginary number (j2 = −1) and n is the constant phase exponent (0 < n < 1) associated with the deviation of the straight capacitive line from 90° by an angle (alpha ={90}^{circ },(1-n).)
Accordingly, the electrochemical parameters extracted from the fitting of the EEC model are presented in Fig. 10c, d, with the chi-squared (χ2) in the order of 10−3, indicating the best fitting agreement of the EEC model. As depicted in Fig. 10c, the highest values of Rfilm and Rp (about 41 and 360 kΩ·cm2) correspond to the LPBFed sample fabricated by the continuous scan strategy, while the lowest value of Tfilm is associated with the sample fabricated by the continuous strategy, indicating the formation of a thicker and more stable passive layer on the LPBFed sample fabricated by the continuous scan strategy compared to those of the samples fabricated by island B/W and stripe scan strategies. The constant phase exponents (n-values) serve as an index of the deviation of pure capacitance behavior of the passive and double layers formed at the interface areas between the sample surface and the electrolyte, ranging from about 0.8 to 1. This indicates a similar deviation of pure capacitance behavior in all samples, suggesting a similar surface heterogeneity for all LPBFed samples.
Discussion
The solidification process is a fundamental aspect in designing the microstructure of an additively manufactured part and is significantly influenced by the temperature gradient (G) and solidification rate (R)37. These two control parameters play a critical role in regulating the process of solidification, and therefore, have a profound impact on the final product’s properties and performance. Understanding how the temperature gradient and solidification rate interact is key to producing high-quality printed parts with the properties needed for the manufacturing industry. The solidification rate refers to the velocity at which the solid/liquid interface progresses within the melt pool. The rate at which the solidification front moves, has an influence on the solidification substructure, undercooling growth, and solute redistribution during the solidification process. Moreover, at the solid/liquid interface, the temperature gradients in the solid (Gs) and liquid (GL) have a key impact in designing the solidification substructure37. A high temperature gradient (G) can lead to a rapid cooling rate, resulting in a fine microstructure, while a low temperature gradient can lead to a slower cooling rate and the formation of a coarse microstructure.
The temperature gradient (G) and solidification rate (R) within a melt pool are variable, with differing values along its depth. This variability gives rise to a spectrum of columnar and equiaxed dendrite microstructure within the melt pool. While various models have been proposed to predict the solidification map for different alloys such as AlSiMg57, Ti-6Al-4V58,64, Ni-Nb60, Inconel 71865, and 316 L66,67, the present study is the first to empirically map the solidification map of localized regions within melt pools for the LPBF 316 L. Figure 8a depicts the empirical solidification map for the LPBF 316L, which was created using both stripe and continuous strategies. The map includes dendrite sub-structures that are present at multiple locations within the melt pools. Columnar dendrite microstructure tends to form under conditions of high-temperature gradient (G) and low solidification rate (R) (deepest regions), while equiaxed grains form under conditions of low G and high R. As the ratio of the temperature gradient to the solidification rate (G/R) decreases, the system undergoes a transition from a columnar solidification interface to equiaxed dendritic morphology. Furthermore, the heat gradient experiences significant variations depending on the location within the melt pool. In the vicinity of the melt pool centerline, the gradient is minimal. However, as one moves from the centerline towards the fusion line along the solidification front, the temperature gradient progressively increases and reaches its maximum at the fusion line37,68.
Although changing the solidification rate (R) and thermal gradient (G) can control the cell, grain size, and subsequent properties, the relationship between the process parameters and their effects on the solidification parameters is crucial. To this end, the presented model computes the cooling rate ((dot{T})) at diverse laser speeds and powers (as shown in Fig. 7f). Based on the calculated data and the curves in Fig. 7f, the Eqs. (14) and (15) are proposed for continuous and stripe strategies, respectively:
Previously, researchers aimed to discover the relationship between cooling rate ((dot{T})) and linear energy density ((frac{P}{V})) of LPBF 316 L. For instance, Liang et al.69 reported an equation of (Gtimes R=1.6times {10}^{5}{(frac{P}{v})}^{-1.182}) for the LPBF 316 L with a stripe strategy (rotation angle of 90°). In another study, Bertoli et al.70 investigated the similar alloy using an island scan strategy (90° rotation) and reported a relationship between cooling rate ((Gtimes R)) and energy density ((frac{P}{V})) as (Gtimes R=6.28times {10}^{5}{(frac{P}{v})}^{-1.01}). Nonetheless, it was noticed that the previous equations presented for the 316 L were not precise for the current investigation (using a continuous and stripe scan strategy with a rotation of 67°). Although the curves depicted in Fig. 7f indicate that a mutual inverse correlation exists between the cooling rate and the (frac{P}{V}) ratio in all studies, there needs to be significant modifications in the constants of the equation.
On the other hand, the relationship between the cooling rate ((dot{T})) and the cell spacing (λ) follows the ({rm{lambda }}=80{dot{T}}^{-0.33}) equation, which is derived for stainless steels69,70,71 perfectly. Accordingly, the Eqs. (16) and (17) are derived and proposed for the continuous and stripe strategies, respectively:
where (P,) ({rm{lambda }},) and (v) are the laser power, cell spacing, and speed, respectively. The ratio of (frac{P}{v}), which is also known as the linear energy density, refers to the amount of heat input per unit length of distance covered by the laser source. It has been widely utilized in literature as a parameter for comparing various process conditions. Accordingly, by controlling the (frac{P}{v}) ratio (linear energy density), the cell spacing can be controlled. The relationship between grain size variations and changes in cell spacing is mathematically derived as follows and it is shown in Fig. 8c.
where d and (lambda) are grains size (µm) and cell spacing (µm), respectively. In this study, the circle equivalent diameter is considered as the grain size. By substituting Eqs. (16) and (17) into Eq. (18), we can arrive at Eqs. (19) and (20), which represents the relationship between grain size (d) and (frac{P}{v}) (linear energy density) in the LPBF 316 L using continuous and stripe scan strategies, respectively (Fig. 7d):
In addition to this, while the significant influence of microstructural features on the electrochemical corrosion behavior of metallic components is widely acknowledged in corrosion science, dissecting the individual effects of different microstructural features on corrosion behavior can be exceedingly intricate and challenging. Thus, it is crucial to acknowledge that the corrosion behavior of metallic samples produced via rapid-rate solidification processes like LPBF can be shaped by a diverse microstructural entity generated during the LPBF process. These include small grains, typically a few microns in size, each housing a multitude of solidification cells with an average sub-micron size, alongside fusion boundaries, dendritic and cellular walls, dislocations, precipitates, segregated elements, and atomic-scale impurities, collectively known as compositional effects. Furthermore, the formation of pores, residual stress, and the preferential growth of grains, known as texture, are additional microstructural features whose development relies on process parameters during rapid solidification processes such as LPBF. Accordingly, employing the LPBF process with various scan strategies for fabricating 316 L stainless steel specimens resulted in the production of samples exhibiting the highest relative density (~99.8%) when the energy density (P/V) was set to 60.9 J/m3. Therefore, this study focuses on the corrosion behavior of samples printed using continuous, island, B/W, and stripe scan strategies at an energy density of 60.9 J/m3.
In terms of microstructural factors arising from manufacturing parameters, the formation of porosities stands out as a key factor influencing corrosion behavior, especially the stability of passive layers formed on 316 L stainless steel samples. The presence of pores in all three samples was measured to be consistent. Consequently, the impact of porosities on passivity and the stability of passive layers across all samples could be considered similarly significant. Furthermore, the influence of different scan strategies on thermal histories, closely tied to changes in temperature gradients (G) and grain growth rates (R) within the solidification process, led to the development of texture components with multiples of uniform density (MUD) values, approximately three in this case, indicating a weak texture due to the preferential growth of grains during the LPBF process (refer to Fig. 4e). The presence of a Brass component with {001} <110> orientation in the stripe samples, as opposed to the Goss {112} <110> component detected in continuous and stripe-printed samples, may exert an influence on electrochemical reactions affecting sample corrosion behavior. It is conceivable that atomic packing, which varies across different crystallographic orientations, could influence reaction rates within grain interiors. However, further research is needed to elucidate the relationship between textures and the reaction capabilities of grain boundaries. Consequently, one could suggest that the variances in weak textures observed among the three samples might contribute to differences in their corrosion behavior. Nonetheless, it is worth noting that employing the continuous scan strategy led to the development of the smallest micrograins (with an average grain size of 39.5 μm) bound within the smallest cells (with an average cell size of 0.47 μm) when compared to the other two samples, with average grain sizes of 55.4 μm for island B/W sample and 58.7 μm for the stripe sample. This could be interpreted as a predominant alteration in the microstructure formed during the LPBF process.
Moreover, it has been noted that residual stresses, whether tensile or compressive, emerge within the lattice due to heterogeneous distortions during the LPBF process. The rapid solidification rate and intricate thermal history experienced by the layers induce localized distortions across the alloy, resulting in residual stresses4. While the magnitude and nature of residual stress may vary with the alloy’s properties and process parameters, including different scan strategies72,73, it appears that the residual stresses in LPBF 316 L samples printed using continuous, island, and stripe strategies are nearly equivalent. This observation is supported by KAM maps obtained from various areas of the 316 L stainless steel samples, as depicted in Fig. 5e–c and Fig. 9, confirming similar average KAM values across all three samples. This suggests a comparable influence of residual stresses on the corrosion behavior of all samples. Furthermore, the impact of residual stresses developed within the LPBF process predominantly affects stress corrosion cracking mechanisms rather than the overall corrosion resistance of the printed samples52. Consequently, it is more judicious to prioritize the role of grain size and their interiors, such as cellular structures, as the primary microstructural features that could govern the corrosion behavior of 316 L samples printed using three different scan strategies via the LPBF method.
As depicted in Fig. 9b, a noticeable trend emerges where increasing corrosion rates correlate with a less noble Ecorr value. In addition, it is observed that as Ecorr becomes nobler, jcorr decreases, indicative of classical behavior within a system under anodic control. If the decrease in jcorr were attributed to slower cathodic reaction kinetics, it would lead to less noble Ecorr values, which is not evident in this context. Thus, based on the data presented in Fig. 9b, d, it is plausible to propose a hypothesis regarding the influence of grain size and their interiors, particularly in the form of cells, on corrosion behavior. The presence of dislocation networks along cellular boundaries has been highlighted in previous studies as playing a pivotal role in the corrosion behavior of LPBF samples21,28,74. It is proposed that the cellular boundaries as well as the grain boundaries are regions which include a high density of dislocations. Consequently, dislocations demonstrate elevated activation energy due to localized lattice distortions75, leading to the formation of chemically active regions within the microstructure that enhance electron activity and diffusion76. Therefore, these microstructural features could augment anodic reactions and facilitate nucleation sites for oxidation, thereby promoting the formation of a thicker passive layer. Moreover, if cellular boundaries and grain boundaries are deemed to be more reactive compared to their interiors, it is plausible that near Ecorr, grain-refined specimens such as those produced using a continuous strategy, swiftly develop an oxide layer. Judging by the data presented, this oxide layer appears to be protective and capable of yielding a lower jcorr than coarse-grained counterparts, including island B/W and stripe samples. It is also noted that solute segregation along the cellular solidification substructure boundaries forms during the rapid solidification process, such as in LPBF33. These features play a crucial role in influencing the corrosion behavior of LPBF components. This segregation contributes to the role of grain and grain boundaries in determining the corrosion resistance of LPBF components fabricated using three different scan strategies. Cell boundaries enriched with solute elements like Cr, Ni, and Mo tend to remain intact, whereas cells depleted of these elements are more vulnerable to corrosive attacks, with pitting likely to initiate in these areas.
The results obtained from potentiodynamic (Fig. 9) and EIS (Fig. 10) measurements confirm that the passive layer formed on LPBFed samples printed using the continuous strategy exhibits greater protection and thickness against corrosion attacks in chloride mediums compared to those printed using island B/W and stripe scan strategies. The Epitting values of the continuous samples, as well as the Rp values, are ~370 mVAg/AgCl and about 4 to 5 times higher than those of the stripe and island B/W strategy samples, respectively. The formation and breakdown of passive films on stainless steels can be attributed to the concentration and migration of point defects within the passive film, which are influenced by the electronic properties of the passive film itself76. Consequently, the accelerated formation of a thicker passive layer with the reduction of cellular/grain size results in more protective layers with lower accumulation of point defects, as described by the point defect model (PDM). According to the PDM, the fundamental process leading to passivity breakdown or pitting is cation vacancy condensation at the metal/barrier layer interface in response to an enhanced flux of cation vacancies across the barrier layer77. Therefore, the presence of a thicker passive layer with fewer defects increases the diffusion layer thickness and consequently decreases the electrochemical reaction rates at the film/solution interface, resulting in higher resistance of the passive layer to the formation of pits77.
When considering grain and cellular size as the primary microstructural features influencing the corrosion current and the formation of a stable passive layer on LPBFed 316 L stainless steel samples, contingent upon grain boundary density, it is plausible to propose a correlation between grain size (d)/cellular size (λ) and corrosion current densities (jcorr) in the form of the Hall-Petch relationship:
where A and B are constants that depend upon environment and material (composition and purity), respectively. The presence of a plausible Hall-Petch relationship between grain size and corrosion current was also previously proposed in metallic components with passive abilities by Ralston et al.78. In this relationship, the value of B is considered negative to indicate that the reduction in grain size leads to an improvement in corrosion rates due to passivation. According to the linear fitting on data obtained from the potentiodynamic tests on the LPBFed samples fabricated by continuous, island B/W, and stripe strategies, the Hall-Petch relationships are supposed to the material with the manufacturing conditions in this research as Eq. (23) and (24):
In conclusion, our results establish a framework to modify additive manufacturing process parameters, particularly scan strategies, for controlling and designing microstructures at macro, meso, and micro scales. This allows to design alloys with optimized melt pool shapes and specific grain and cell sizes. The electrochemical measurements of the fabricated parts suggest a potential relationship between the grain size, manipulated through hierarchical design in the microstructure developed during rapid solidification processes, such as LPBF, and corrosion resistance. It is evident that grain and cellular size, unique features of microstructure evolution during LPBF, play a crucial role in influencing corrosion behavior. Designing microstructures with targeted changes in process parameters, especially scan strategy, helps minimize the effects of texture, residual stresses, and porosity on corrosion performance, highlighting the importance of grain and cellular sizes in enhancing corrosion resistance. Moreover, we developed a set of analytical equations, which explain the relation between power and speed during the LPBF process (continuous and stripe scan strategies) and the grain size for 316 L. This framework can be utilized further to control the microstructure of other complex alloys such as super alloys, martensitic stainless steels, and high entropy alloys to further design their atomic structures, phases, and precipitates for optimum mechanical, chemical, and physical properties.
Responses