Mechanisms of corrosive freeze-thaw damage in AA7075 using time-resolved x-ray microtomography and correlative electron microscopy
Introduction
Age-hardened aluminum alloys in the 7XXX family are important structural materials in aerospace, marine, and transportation industries due to their high strength-to-weight ratios1. Furthermore, aluminum resists general aqueous corrosion through a protective oxide layer2. However, chloride-containing solutions dissolve the protective layer and initiate various forms of localized corrosion such as pitting, intergranular attack, and exfoliation3,4,5,6,7,8,9. These sharp surface defects reduce overall alloy performance by serving as sites for fatigue crack initiation10. A fundamental understanding of corrosion in high-strength aluminum alloys has been developed over the last several decades11. In 7XXX-series alloys, localized corrosion is largely initiated by galvanic coupling between the matrix and Fe-rich inclusion particles and is accelerated by the dissolution of grain-boundary precipitates7,12,13. Localized corrosion precedes fatigue cracking by creating a defect with higher stress concentration than undamaged surface, a process that has been studied, in detail, through in situ x-ray tomography methods13.
Despite advancements in correlating microstructure and corrosion performance, a critical research gap exists in a key area: the effects of thermal cycling in corrosive environments. While on the tarmac, an aircraft’s structural components accumulate aqueous fluids (e.g., saltwater spray from the ocean) in pre-existing cracks and corrosion pits. While in the air, these residual fluids are cooled below their freezing point, leading to expansion and stress development. At various points in an aircraft structure, the surrounding temperature may drop to ~−50 °C14. This cyclic exposure to an aggressive medium and the thermal cycling of exposed components proves to be challenging for even the most sophisticated models of localized corrosion15. Therefore, there is a need to study the damage mechanisms of aluminum alloys under cyclic temperatures in aggressive corrosive environments.
To date, limited studies have investigated the effects of cyclic exposure to corrosive environments and temperature variations on aluminum alloys. Larignon et al. 15,16,17 conducted cyclic temperature corrosion tests on AA2024 (at −20 °C) in a chloride solution environment. The investigators observed an increased density of corroded grain boundaries during the cyclic corrosion tests. However, it remains unclear if the susceptibility to grain-boundary corrosion is dependent on the crystallographic orientation of the grains. These studies are also focused on low immersion times with long cycles. In most aerospace applications, thermal cycles will be short but extend over years of service18. In these environments, the native corrosion product layer19 may lose its protective capacity. Long-term studies are essential to understand structural damage to the corrosion product layer and associated changes in kinetics when compared to conventional continuous immersion testing20.
Additionally, the orientation and distribution of second-phase particles (such as Al2CuMg, Al7Fe2Cu, and Mg2Si) in AA7075-T65121 can impact freeze-thaw-induced corrosion damage. For instance, elongated or rod-like particles aligned along the rolling direction can create continuous paths for corrosion propagation. In contrast, more uniformly distributed and equiaxed particles might result in more sparsely distributed and finer localized corrosion sites. In short, the corrosion behavior of aluminum is known to change under thermal cycling, but the influences of microstructure and extended cycling have not been characterized sufficiently to understand mechanisms for freeze-thaw damage.
Addressing the above important questions presents a significant challenge with conventional surface-based measurements or observations. Consequently, there is a need for a nondestructive three-dimensional characterization tool to conduct subsurface, extended, and time-resolved studies to comprehensively assess the progression of corrosion over significant freeze-thaw cycles. Such studies are essential for advancing our understanding of the mechanistic explanation for freeze-thaw-induced corrosion in aerospace-relevant aluminum alloys.
In this study, we have carried out a comprehensive investigation of the time-dependent degradation in a peak-aged 7075 aluminum alloy (AA7075-T651) subjected to cyclic freeze-thaw conditions within a chloride-containing solution. Employing in situ 3D X-ray Computed Tomography (XCT), we analyzed the dynamic evolution of corrosion damage over several hundred freeze-thaw cycles. We investigated microstructural evolution under both freeze-thaw and continuous immersion conditions, with the aim to understand the differences in mechanistic damage evolution. This comparison enabled us to study the precise mechanisms of corrosion under freeze-thaw cycling, and by examining the corrosion volume loss over time, we determined the corrosion kinetics in both environments. In addition, we investigated the anisotropic effects of directional rolling and the nature of cracking along elongated grain boundaries along with crystallographic orientation effects. In 7xxx-series aluminum alloys, stress corrosion cracking (SCC) mechanisms, including anodic dissolution and hydrogen embrittlement, are known to play a critical role in intergranular crack propagation in the chloride environment. While this study primarily focuses on the effects of freeze-thaw cycling, the potential contribution of hydrogen embrittlement in crack growth is also acknowledged as an area for further investigation. Our findings contribute significantly to formulating a plausible mechanistic explanation for AA7075-T651 corrosion degradation in a freeze-thaw environment.
Results and discussion
In the following sections, the surface corrosion features observed in the continuous immersion and freeze-thaw samples are first discussed. Subsequently, the microstructural changes observed in the samples under a corrosive environment by XCT are presented. Finally, the evolution of cracks within the corrosion samples is described, and its dependence on the crystallographic orientation of the grains within the sample is explained.
Surface corrosion morphology: freeze-thaw vs. continuous immersion
Prior to the quantification of corrosion damage, the corroded samples’ surfaces under the two immersion conditions (continuous-immersion and freeze-thaw) were observed. Figure 1d shows a rendering of the uncorroded surface obtained from the XCT scans of the sample. After 85 days of continuous immersion, this surface accumulated a porous white layer (see Fig. 1b). SEM-EDS analysis confirmed that this porous white layer consisted of aluminum oxides containing Na, Cl, Mg, and Cu in trace quantities (see Fig. 1e, f). This porous layer is assumed to be produced by the dissolution of Al matrix and second-phase particles into the solution and reaction with hydroxyl ions to form porous aluminum hydroxide, similar to the anodizing of Al alloy in sulfuric acid electrolyte22. The presence of aluminum hydroxide can serve as a protective layer, slowing down the exchange of ions with the corrosive electrolyte.
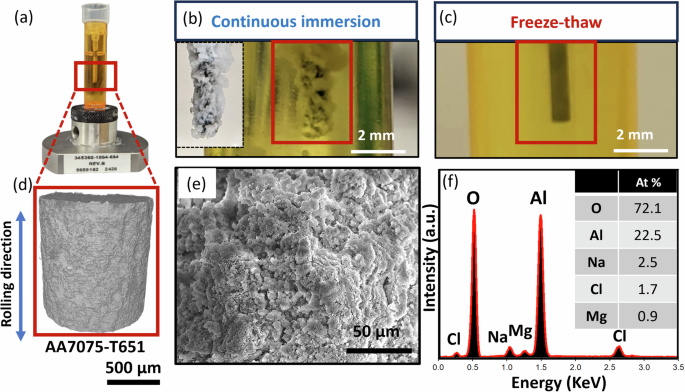
a AA7075 sample set up exposed to NaCl solution. d 3D XCT rendering of the AA7075-T651 sample obtained after EDM cutting. b A macroscopic view of the continuous immersion corroded sample after 85 days in the immersion fixture (equivalent to 2000 freeze–thaw cycles), showing corrosion product accumulation. c Macroscopic view of the freeze–thaw corroded sample after 2000 freeze–thaw cycles in the immersion fixture, with no visible white porous corrosion product. e, f SEM-EDS analysis shows the white layer is a corrosion product composed of an oxide of aluminum.
In comparison, the absence of a significant oxide layer in the thermally cycled sample (2000 thermal cycles), see Fig. 1c, provides initial insights into the impact of freezing on the corrosion processes. During the freeze-thaw process, the volumetric expansion of ice generates mechanical stresses within and around the corrosion product aggregates, causing them to break apart or become dislodged from the surface. It can be hypothesized that these mechanical stresses on the corrosion product agglomerates result in the removal of the corrosion product and the exposure of fresh AA7075 substrate to the corrosive liquid, potentially accelerating corrosion. To assess this hypothesis of accelerated corrosion, we have used the XCT data to quantify the corrosion damage in the two samples, as described in subsequent sections.
Corrosion damage evolution
3D renderings and the corresponding XCT slices are shown in Figs. 2a, b, 3c, d, respectively. These illustrate the initiation of cracking in the FT sample after 1100 freeze-thaw cycles and the progress of surface damage after 1600 cycles. Longitudinal cracks originated from pits on the surface and are oriented along the rolling direction. Thus, corrosion damage normal to the surface is redirected along the rolling direction. After an additional 500 freeze-thaw cycles, elongated subsurface cracks along the longitudinal direction are observed. Figure 2d reveals that the thickness of the corrosion layer around the crack opening is relatively thinner compared to the nearby region, facilitating the ingress of corrosive chloride ions into the crack and causing enhanced corrosion damage around the pit. Furthermore, the enhanced damage in the region marked with a red dashed circle occurs around the intermetallics at the bottom of the sample, as shown in Fig. 2c, d, leading to aggressive alloy dissolution in the region. Figure 2e, f shows a 2D XCT slice of a sample before exposing to freeze-thaw cycles and after 2000 freeze-thaw cycles (total exposure time 130 days) scanned in the corrosive chloride solution. Initially, the sample showed no visible cracks. However, after 2000 freeze-thaw cycles, significant cracks have developed, with a maximum length of approximately 900 µm and a width of around 300 µm. The observed internal cracks, highlighted by a yellow dashed box, demonstrate the severe impact of freeze-thaw cycles on damage.
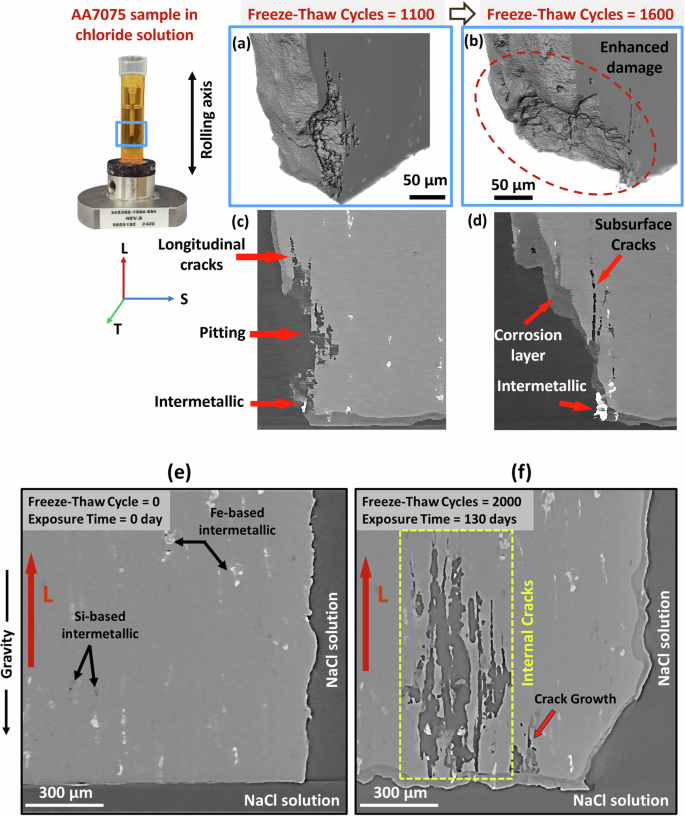
After 1100 freeze–thaw cycles (a, c), 1600 freeze–thaw cycles (b, d), and 2000 freeze–thaw cycles compared to uncorroded sample (e, f).
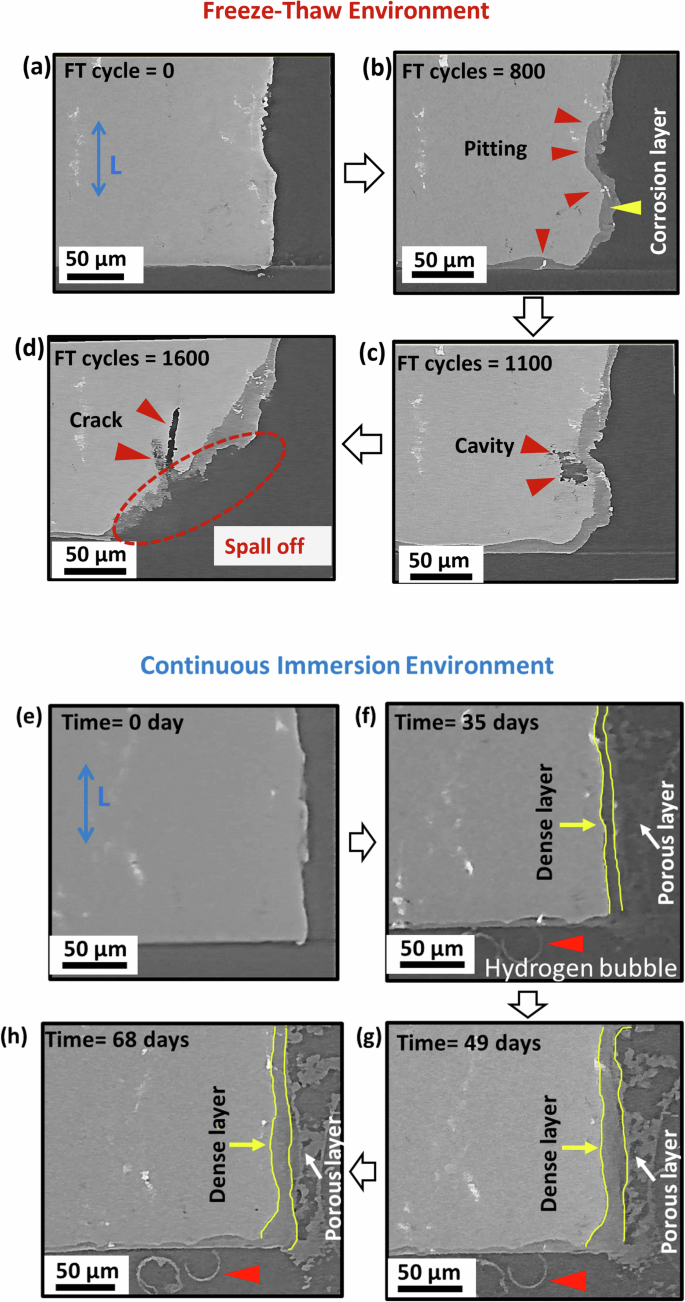
a 0 cycles, b 800 cycles, c 1000 cycles, and d 1600 cycles to damage in the CI sample after e 0 days, f 35 days, g 49 days, and h 68 days.
Figure 3 presents longitudinal views of time-resolved XCT data from the lower region of the FT and CI samples at various stages of corrosion. The sequential imaging captures the progression of corrosion defects in the same region of interest over time. Both continuous immersion and freeze-thaw corrosion environments reveal a combination of uniform material dissolution and localized pitting. These dynamic observations highlight the evolution of both homogeneous and localized corrosion features. The 2D slices extracted from the 3D tomography data clearly show the initiation and propagation of corrosion defects over time. Corrosion damage evolution in the FT environment initiates with surface pitting, primarily at the periphery of intermetallic particles, causing circumferential trenching as shown in Fig. 3b. This localized dissolution occurs due to microgalvanic coupling, where noble intermetallic particles such as Al7Cu2Fe and Al2CuMg act as cathodes relative to the surrounding Al matrix23. During alternating freezing and thawing cycles, the concentration of NaCl solution in the pits can increase, leading to accelerated dealloying of anodic intermetallic phases like dealloying of Mg2Si and MgZn2 to form cavity as shown in Fig. 3c. After the cavity is formed, the volume expansion of the frozen solution potentially generates localized stress in the surrounding microstructure. This stress, combined with the weakened grain boundaries due to intergranular corrosion (discussed in section “3D observations of cracking and spalling”), causes material detachment, referred to here as “spall-off”, as shown in Fig. 3d. The spallation process is likely exacerbated by the repeated FT cycles, which causes cyclic stresses and fatigue-like effects on the corroded regions. Furthermore, at 1600 freeze-thaw cycles (Fig. 3d), spallation is observed, along with the formation of ~50 µm subsurface cracks aligned with the rolling direction, originating from the spallation surface. The spallation caused by freeze-thaw cycling likely exposes a fresh, irregular surface, which could serve as a site for local pit initiation. In this region, Mg-rich intermetallics near the spalled surface act as preferential dissolution sites due to their high reactivity to cause crack formation along the longitudinal direction.
In comparison, the CI samples show a more uniform corrosion damage evolution, characterized by the development of a dual-layer corrosion structure on the surface, as shown in Fig. 3e–h. The inner corrosion layer, termed the “dense layer” is more compact and adheres closely to the metal substrate. The outer layer, referred to here as the “porous layer” forms on top of the dense layer and consists of mainly a mixture of aluminum hydroxide and oxide (as discussed in section “Surface corrosion morphology: freeze-thaw vs. continuous immersion”). Over time, the dense layer thickens and the outer porous layer becomes denser, likely due to the corrosion products precipitation and re-deposition on the surface.
In CI samples, the presence of both a dense and a porous layer contrasts with FT samples, where only a dense layer is observed. The presence of the outer layer in CI samples relatively hinders the diffusion of chloride ions to the underlying metal, potentially mitigating the acceleration of the corrosion process24. However, near iron-rich inclusions, similar to the FT sample, corrosion is locally accelerated, forming hemispherical pits. In the CI sample, these pits, once formed, show halted growth and are filled with corrosion products to passivate the surface. Sinclair et al.25 and Niverty et al.5 observed that these galvanically-driven pits grow until inclusions are decoupled from the matrix. Moreover, hydrogen evolution in the form of bubbles can be seen in Fig. 3f–h. This phenomenon is not observed in the FT sample because the bubbles likely rupture during the freezing stage of each freeze-thaw cycle, resulting in hydrogen from bubbles possibly diffusing into the alloy and causing enhanced corrosion damage due to hydrogen embrittlement26,27,28
The finding that crack formation drives spalling near the base of the cylinder raises questions about how far cracks propagate and how crack propagation differs on the flat base surface compared to the rounded axial surface. In Fig. 4, renderings of the sample interior are sliced in planes parallel to the rolling direction. This shows defects with lengths approaching ~1 mm in the interior of the sample, aligned along the rolling direction. Surface pits are a likely site for freeze-thaw cracking, and the ingress of the electrolyte, and specific points are highlighted where corrosive species create pathways for corrosion damage. The width of the crack features suggests that liquid in cracks has contributed to the extensive internal damage observed. These 3D observations expand the previous hypothesis of crack formation at surface pits. Corrosive attack appears to act synergistically with crack growth to accelerate damage. Such behavior may alter the rate of corrosive activity along different rolling orientations. While these qualitative observations provide insight into the mechanisms of crack formation and propagation, a detailed quantification of corrosion loss is necessary to fully understand the extent of damage. The following section focuses on quantifying corrosion loss and assessing the correlation with rolling orientation and corrosion rates.
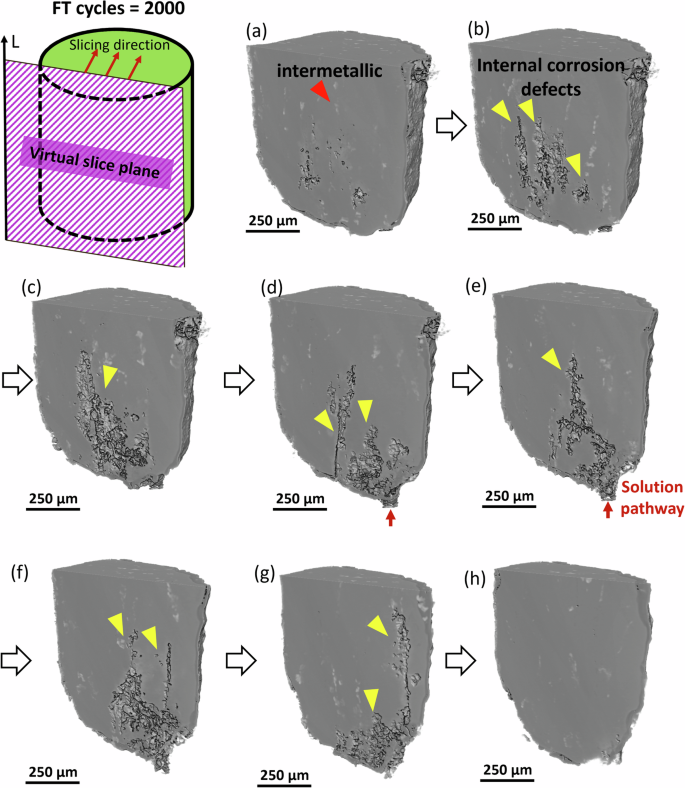
a–h show individual slices through the thickness for a sample after 2000 freeze–thaw cycles.
Corrosion-induced weight-loss estimation
XCT was used to calculate corrosion-induced weight loss by acquiring high-resolution 3D volumes of the AA7075 sample exposed to a corrosive solution. Image segmentation techniques were used to distinguish the corroded and uncorroded regions, enabling precise measurement of the remaining uncorroded AA7075 volume at multiple time points throughout the FT and CI environments. The difference in uncorroded volume between scans was used to calculate the volume loss due to corrosion. This volume was then converted into mass loss using the known density of AA7075, allowing for direct comparison with traditional gravimetric measurements29. Furthermore, the weight loss was normalized to corrosion-exposed surface area (mg/cm2), enabling standardization across different FT and CI samples. These measurements illustrated the increased damage caused by cracking and found systematic differences in damage rates on different surfaces (corresponding to different orientations). The weight loss per unit area (mg/cm2) was calculated based on the original uncorroded surface areas, which measured 596,254 µm2 and 245,145 µm2 for the curved and flat surfaces, respectively. After 1600 freeze-thaw cycles, the corners of the FT samples were rounded due to spalling. To accurately measure and compare weight loss per unit area, the region of interest was chosen slightly away from the edges for both the flat and curved surfaces. This comparison allowed for an analysis of time-resolved behavior on the flat transverse surface (S-T plane) and the curved axial surface (L) under both freeze-thaw and continuous immersion conditions.
Comparing normalized weight loss with corrosion-exposed surface between the freeze-thaw and continuous immersion conditions provided insight into different kinetic processes (Fig. 5). Generally, the kinetics of cumulative volume loss due to corrosion in aluminum for continuous immersion experiments in a chloride solution exhibit logarithmic kinetics with a decreasing rate of volume loss throughout an immersion period30. In continuous immersion tests, the corrosion rate decreased with time due to the formation of a thick corrosion layer on the surface, which impeded the migration of corrosion species toward the metallic substrate31. Conversely, in a freeze-thaw environment, the rate of mass loss per unit area increased with extended freeze-thaw cycles, primarily due to the rupture of the protective porous oxide layer during freeze-thaw cycles as discussed in section “Surface corrosion morphology: freeze-thaw vs. continuous immersion”.
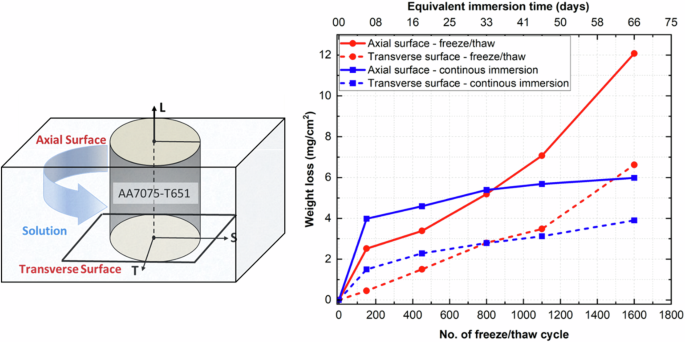
The equivalent thaw time (during continuous immersion) for the axial curved surface along L and transverse plane (S-T) is shown.
Figure 5 demonstrates higher weight loss per surface area on the axial surface in both the freeze-thaw and continuous immersion environments. This behavior can be attributed to microstructural variations, as the axial surface exhibits a different grain orientation and intermetallic phase alignment compared to the transverse plane21. Although the density of grain boundaries per unit area is higher in the S-T plane compared to the L-T/S plane, the density of inclusions per unit surface area dominates corrosion-induced weight loss on the L-T/S surface32. The elongated inclusions on the axial curved surface create a greater overall area for galvanic exchange, leading to rapid dissolution across the surface.
Cracks evolution in the freeze-thaw environment in 3.5 wt% NaCl solution
So far, it has been hypothesized that the freezing process induces spalling in AA7075 through the generation and propagation of subsurface cracks. This phenomenon of material degradation is driven by a synergistic interaction between microstructurally influenced localized corrosion and volumetric expansion stresses caused by the ingress of chloride into these defects. The cyclic nature of the FT environment exacerbates this process, leading to corrosion-induced volume loss in AA7075. Visualizations of crack formation and propagation can support this hypothesis and elucidate the effects of the AA7075 microstructure on cracking. This section thus presents a multimodal analysis of crack formation and propagation in AA7075 during freeze-thaw corrosion. From this analysis, a core mechanism of environmentally assisted freeze-thaw cracking is proposed.
3D observations of cracking and spalling
Figure 6a–c shows 3D cracks (depicted in red, green, and blue) within the AA7075 matrix (light gray) of the sample exposed to chloride solution in an FT environment. Resolvable subsurface cracks were initially observed after 1100 FT cycles (Fig. 6a), propagating primarily along the longitudinal direction. In the subsequent XCT scans after 1600 FT cycles, cracks observed after 1100 FT cycles had been removed due to spalling, and a new crack (shown in green) had emerged (Fig. 6b). By 2000 FT cycles, the cracks from the previous time steps were again removed by spalling, and a new cluster of cracks (Fig. 6e) had formed, extending hundreds of microns along the sample’s length. This progression demonstrates the cyclic nature of crack formation, propagation, and material loss through spalling in the FT environment. To characterize the kinetics of crack formation and growth, the volumes of the sample and cracks at the 1100th, 1600th, and 2000th freeze-thaw cycles were calculated, as illustrated in Fig. 6d. On the left axis, the matrix volume in the region of interest is normalized with respect to the original volume (prior to corrosion exposure). On the right axis, the crack volume in the region is normalized with respect to the initial matrix volume. The sample volume decreases with an increasing number of freeze-thaw cycles, primarily due to spall-off. Initially absent, cracks exhibited approximately an eightfold increase in volume from the 1100th to the 2000th freeze-thaw cycle, indicating that crack formation and propagation were more rapid with higher numbers of freeze-thaw cycles. This rapid increase is partly caused by the formation of new cracks at later time steps, with the late-stage crack growth potentially exacerbated by a gradual accumulation of localized corrosion sites and surface damage.
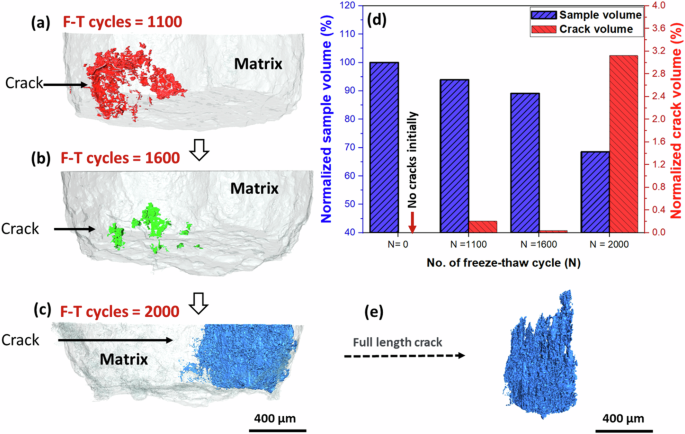
a Cracks in the Al matrix after a total of 1100 freeze-thaw cycles, b Cracks after 1600 freeze-thaw cycles, c Cracks after 2000 freeze-thaw cycles. d Material volume and crack volume in the volume after various freeze-thaw cycles. e Full-length crack evolution in the sample exposed for 2000 freeze-thaw cycles.
Impact of microstructure on crack growth orientation
The alloy microstructure has multiple features which may impact crack growth, with the most significant being precipitates and intermetallic inclusions. These microstructural features result in differences in electrochemical activity with respect to the matrix, particularly during the corrosion process. The alignment of inclusions in AA7075 due to rolling is visible in XCT renderings of the sample matrix. Figure 7a–c shows the front view of the 3D region of interest, while Fig. 7d–f presents the corresponding top view after 1100 and 1600 freeze-thaw cycles. The Al matrix, intermetallic phases, and internal cracks are represented in light blue, dark blue, and red, respectively. At 1100 freeze-thaw cycles, the subsurface crack, depicted in red, is observed propagating radially outward. In the top view, the crack is aligned with intermetallics along the transverse direction. After 1600 freeze-thaw cycles, new internal planar cracks, represented in green, are visible in the top view (Fig. 7e), indicating that these cracks also follow the orientation of the intermetallics. However, the crack formed after 1100 freeze-thaw cycles has spalled, creating a new surface. Figure 8c, f show the superposition of the two time steps at 1100 and 1600 freeze-thaw cycles, in front and top views, respectively. This superposition clearly reveals that the crack propagated perpendicular to the intermetallic orientation from 1100 to 1600 cycles.
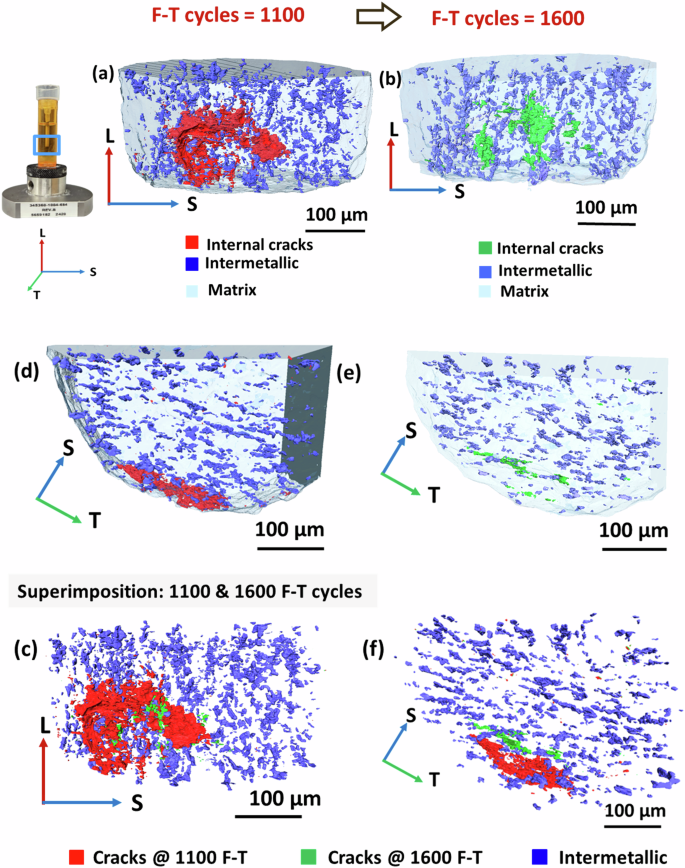
The panels illustrate the evolution and propagation of cracks after 1100 and 1600 freeze–thaw cycles.
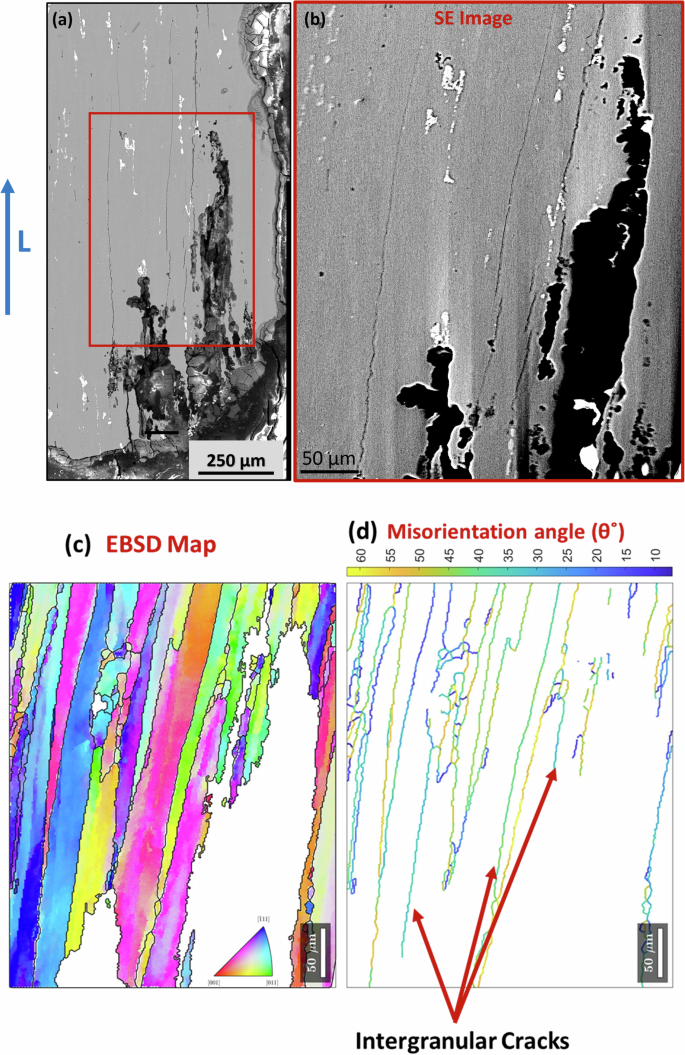
a SEM-BSE image, b SEM image of the red box from a for EBSD analysis, c EBSD orientation map analysis of region (b), d Misorientation angle distribution of the red box subregion.
Based on these observations, corrosion initiates primarily at the inclusions on the surface due to electrochemical heterogeneity with the matrix, eventually forming pits. These pits then transition into cracks that propagate along the subsurface intermetallic-matrix interface. The cracks appear parallel to the intermetallic orientation in the longitudinal direction, as the intermetallics are typically aligned with the rolling direction of AA7075-T651. The initial formation of cracks parallel to the intermetallic orientation can be attributed to the presence of subsurface inclusions, coupled with the cyclic stress of freeze-thaw cycles. This cyclic stress may lead to the nucleation and propagation of cracks radially from their point of initiation. Subsequently, the crack would act as a preferential site for the ingress of corrosive species, initiating corrosion along the crack path. The freezing of those same species would then increase cyclic stresses and eventually lead to spalling off as the crack propagates. Thus, the combination of electrochemical corrosion and the mechanical stress induced by freeze-thaw cycles creates a synergistic effect similar to stress corrosion cracking (SCC). In this case, stress is generated internally due to the volume expansion of aqueous solution instead of an external load source.
Furthermore, hydrogen embrittlement (HE) is a critical factor in the stress corrosion cracking (SCC) of AA7075-T651. The diffusion and trapping of hydrogen atoms, particularly at grain boundaries, can significantly reduce local cohesive strength and exacerbate the evolution of corrosion defects. There is a clear correlation between increased hydrogen content and the observed intergranular cracking during thermal and environmental cycling in chloride solution16 In this study, as shown in Fig. 3f–h, hydrogen bubble formation was observed on the S-T surface under continuous immersion conditions. In contrast, during freeze-thaw cycling, these hydrogen bubbles appear to rupture, as seen in Fig. 3b–d. This rupture likely contributes to the higher density of corrosion defects under freeze-thaw conditions.
Crystallographic nature of crack growth during freeze-thaw cycling
The growth of a crack through the matrix raises questions regarding the effects of crystallography. To provide a general overview of grain effects, SEM-EBSD analysis was conducted on the interior of the freeze-thaw sample exposed to 2000 cycles. Micrographs reveal significant crack fissures and longitudinal cracks on the L-S/T cross-section plane, which were not visible in XCT (Fig. 8). The large cracks depicted in Fig. 8b illustrate the pits-to-crack transition with dissolution of grains, originating as pits on the S-T plane and leading to grain boundary corrosion, followed by grain dissolution due to intensified corrosion at the grain boundary.
An EBSD inverse pole figure map and misorientation map (Fig. 8d) indicate that cracking is predominantly intergranular. The grain boundaries which experienced cracking are highlighted with arrows. The intergranular corrosion is attributed to the electrochemical activity differences between precipitates and the Al matrix in chloride-containing environments. For instance, precipitates such as MgZn2 (ƞ-phase) are more electrochemically active than the matrix, resulting in localized galvanic coupling at the grain boundaries, where the MgZn2 precipitates act as anodes, causing grain boundary corrosion. Furthermore, cracks propagated along grain boundaries with intermediate misorientation angles of 25°–40° (Fig. 8d). The preference for intergranular corrosion attack on grain boundaries with intermediate misorientation angles is attributed to the distribution of precipitates along these grain boundaries. Zhao et al.33 used TEM and diffraction contrast tomography to study the relationship between grain boundaries with misorientation and precipitate distribution. Their results demonstrated that grain boundaries with misorientation angles below 25° and above 45° exhibited enhanced resistance to intergranular corrosion, whereas those with misorientation angles between 25° and 40° were more prone to corrosion. In the misorientation range of 25° to 40°, precipitates were observed to form interconnected networks along the grain boundaries, increasing corrosion susceptibility. Conversely, grain boundaries with misorientation angles below 25° contained smaller, more discretely distributed precipitates, while those with misorientation angles above 40° displayed coarser precipitates with larger interparticle spacing, contributing to improved intergranular corrosion resistance. Furthermore, future studies incorporating fractographic analysis of the ruptured F-T samples would offer deeper insights into crack propagation and failure modes in intergranular corrosion. Overall, these observations demonstrate how the cyclic nature of freeze-thaw cycles accelerates the progression of intergranular corrosion to grains dissolution, compromising the structural integrity of the material.
Based on observations using 3D X-ray computed tomography (XCT) combined with Electron Backscatter Diffraction (EBSD), a comprehensive mechanism can be delineated as depicted in Fig. 9. The microstructure of AA7075-T651, characterized by elongated grains along the rolling direction with precipitates and intermetallic distribution along grain boundaries, renders these precipitates (MgZn2) and intermetallics (Al7Cu2Fe, Al2CuMg) regions electrochemically more active in aqueous solutions, thus fostering grain boundary corrosion. Notably, the microstructure features at high angle grain boundaries (HAGB), which play a pivotal role in the ensuing corrosion process. In a freeze-thaw environment with NaCl solution, corrosion initiates around the intermetallic particles situated on the surface, as illustrated in Fig. 9b. The corrosion pits proliferate initially where anodic and cathodic reactions are particularly active. Concurrently, the protective porous layer is compromised due to the stresses induced during the freezing of ice, thereby accelerating pit formation, as evidenced in Fig. 1c. As the pits deepen, chloride solution infiltrates them during thawing conditions. The cyclic freezing and thawing create internal stress within these pits, driving intergranular cracking. The electrolyte infiltrates these cracks and initiates grain boundary attack, creating corrosion fissures. Simultaneously, continued cyclic expansion and contraction of ice drive the tip of the crack forward. If the stress induced by the volume expansion of ice during freezing is substantial enough, grain boundaries fracture completely and material spalls off, as depicted in Fig. 9c. During this process, grain orientation impacts the progress of the crack, with grain boundaries of 30–40° misorientation preferred based on EBSD mapping. Additionally, grains adjacent to HAGBs are more susceptible to anodic dissolution, thereby widening the crack width. This cyclic freeze-thaw process exacerbates corrosion defects in the material, leading to rapid degradation by multiple mechanisms, as depicted in Fig. 9d.
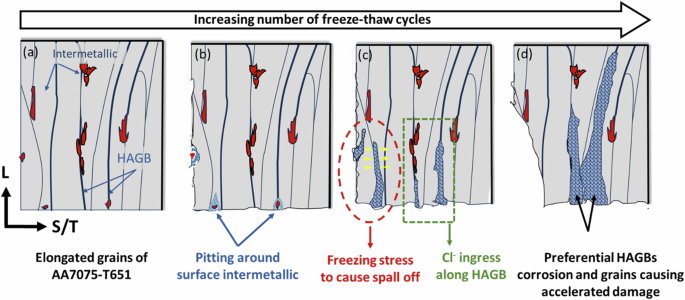
The panels show schematics of the evolution of damage with increasing freeze–thaw cycles.
Understanding the freeze-thaw degradation of AA7075-T651 in chloride-rich environments is essential for predicting the material’s performance under the variable conditions that aircraft structures face. Our study used a chloride solution for freeze-thaw cycling to replicate aggressive corrosion scenarios, focusing on the impact of continuous chloride exposure in the form of ice or liquid electrolytes. However, real in-service conditions, like salt-spray or humid air on an aircraft carrier, present distinct challenges not fully captured by immersion testing.
Salt-spray exposure introduces intermittent, localized salt deposition, resulting in a non-uniform distribution of chloride ions across the surface and leading to more heterogeneous corrosion patterns compared to uniform immersion. Thin electrolyte layers formed from salt-spray and humidity allow greater oxygen diffusion, which can accelerate localized corrosion, particularly pitting, and create electrochemical conditions that differ significantly from immersion in chloride solutions. Furthermore, in natural settings, additional factors such as temperature and humidity fluctuations intensify thermal cycling effects, potentially increasing the frequency of freeze-thaw events in small electrolyte patches. This non-uniform freezing and thawing can lead to localized stress concentrations, causing micro-cracking in ways that differ from the relatively uniform stress distribution in a fully submerged system.
Moreover, natural environments also often contain other contaminants, like sulfates or organic materials, which can interact with chloride ions and exacerbate corrosion mechanisms. While chloride immersion testing provides valuable insights into degradation mechanisms under controlled conditions, incorporating salt-spray or cyclic humidity environments in future studies would enhance understanding of freeze-thaw corrosion behavior in realistic service conditions. This approach would improve the accuracy of predictive models, ultimately leading to better long-term durability assessments for aircraft materials exposed to marine environments.
This study aimed to investigate the evolution of freeze-thaw-induced corrosion damage of AA7075-T651 alloy in 3.5 wt% chloride solution during thousands of freeze-thaw cycles. A correlative approach utilizing in situ nondestructive 3D x-ray computed tomography in a chloride environment and correlative electron microscopy ex-situ was applied to understand localized corrosion and crack propagation under a cyclic thermal condition, and the following conclusions were made:
-
Contrasting corrosion mechanisms in continuous immersion and freeze-thaw conditions reveal the formation of a protective porous layer in the former, while cyclic removal of corrosion products in the latter accelerates corrosion, highlighting the need for tailored protection strategies for each environment.
-
Unlike continuous immersion environments, the freeze-thaw environment in AA7075-T651 promotes corrosion that initiates at the surface and propagates subsurface, leading to internal cracks and material spallation due to volumetric stress, resulting in a repeated cycle of damage and corrosion acceleration.
-
Corrosion-induced weight loss in AA7075-T651 is more pronounced along the longitudinal surface (parallel to the rolling direction) compared to the transverse surface (perpendicular to the rolling direction) in both freeze-thaw and continuous immersion environments, primarily due to the anisotropic microstructure created during the rolling process, which affects grain orientation and intermetallic particle distribution, thereby influencing corrosion susceptibility.
-
The corrosion-induced weight loss measurement in the freeze-thaw environment in initially up to 800 freeze-thaw cycles is lower than the equivalent corrosion time. However, after increasing the freeze-thaw cycles, the corrosion-induced weight loss in freeze-thaw environments increases exponentially while continuous immersion attains convergence.
-
The dynamic formation and dissolution of corrosion-induced cracks along the subsurface intermetallic orientation in AA7075-T651 during freeze-thaw cycles underscore the complexity of corrosion damage under cyclic stress, highlighting the importance of understanding this process for predicting material failure and implementing preventive measures.
-
Further investigation through EBSD analysis of cracks observed in XCT reveals intergranular corrosion damage, with a preference for mid-range (30°–40°) misorientation angle grain boundaries. This susceptibility is attributed to the presence of interconnected precipitates along these boundaries, which serve as pathways for corrosion propagation. These findings underline the intricate interplay between grain boundary characteristics and corrosion susceptibility.
This study provides critical insights into the freeze-thaw degradation mechanisms of AA7075-T651 in a chloride environment, revealing a unique interplay between corrosion and freeze-thaw cycles. The research elucidates a complex degradation process in which cracks initiate at surface inclusions, eventually forming pits that induce grain boundary corrosion. Corrosive species penetrate these grain boundaries, exacerbated by volumetric stress during freezing, which accelerates intergranular corrosion. Unlike traditional stress corrosion cracking caused by external forces, this mechanism is driven by internal stresses arising from volumetric expansion during freeze-thaw cycles. These stresses lead to crack formation along preferred grain boundaries and at subsurface intermetallic-matrix interfaces, resulting in spallation and more rapid corrosion compared to continuous immersion laboratory tests. The cyclic nature of freeze-thaw conditions appears to enhance the corrosion rate by repeatedly opening new pathways for corrosive species and inducing mechanical stress. These findings are particularly significant for industries such as aerospace and automotive, where maintaining structural integrity under fluctuating environmental conditions is crucial. This study provides a novel perspective on predicting material degradation in AA7075-T651 and could inform the development of new preventive strategies for this widely used high-strength aluminum alloy.
Methods
Sample preparation and freeze-thaw experiment
The material used in the study was a commercially available AA7075 alloy (Arconic Corp., Pittsburgh, PA, USA). The material was rolled to a thickness of 7.5 cm and heat-treated to peak hardness (T651). The nominal weight percentage of each constituent was 5.63 Zn, 2.45 Mg, 1.55 Cu, 0.045 Si, 0.18 Fe, 0.008 Mn, 0.19 Cr, 0.004 Ni, 0.049 Ti, and rest Al. Two cylindrical test specimens were cut from the block using electrical discharge machining (EDM). The cylinder diameter was 1 mm, and the length was 15 mm and aligned with the rolling direction (L). Before immersion testing, samples were cleaned in acetone and rinsed in deionized (DI) water. It should be noted that the EDM layer was retained because its inherent roughness, oxides, and residual stress create localized corrosion initiation sites. Immersion experiments were conducted in a 3.5 wt% NaCl solution within a sealed Kapton tube, with the samples placed coaxially inside. One sample was held in the NaCl solution at room temperature for 68 days and is referred to as the continuous immersion (CI) sample, while the other was thermally cycled for 125 days and is referred to as the freeze-thaw (FT) sample.
Thermal cycling was conducted in a programmable thermal cycle chamber (ESPEC North America, Inc., Hudsonville, MI) capable of a temperature range of −40 ± 0.3 °C to 150 ± 0.3 °C. The immersion fixture was placed fully inside the chamber, and the sample was kept inside the immersion fixture for all intermittent testing. Each freeze-thaw cycle consisted of a 30-min freezing stage at −25 °C and a 60-min thawing stage at 25 °C. The average cooling and heating rates were 2.1 and 3 °C/min, respectively. To monitor temperature control, a thermocouple was placed within the thermal chamber. The immersion process is illustrated in Fig. 10b, c. The red and blue plots in Fig. 10c show the set point temperature and recorded temperature over six cycles, showing consistent temperatures over each period.
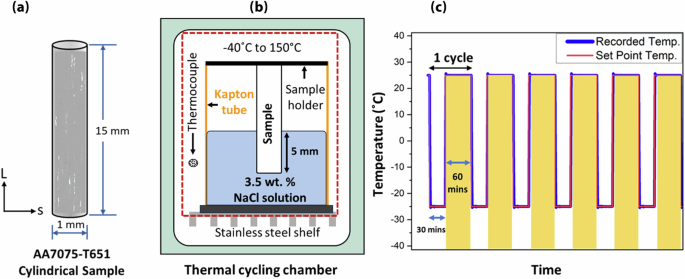
a Schematic illustration of peak-aged AA7075 cylindrical sample obtained by electrical discharge machining, with axis along the rolling direction. b Graph showing thermal cycle test parameters, i.e., freeze and thaw time, comparing programmed and recorded temperatures. c Schematic illustrating the immersion fixture, with a sample submerged in a 3.5 wt% NaCl solution with the fixture installed inside the thermal cycling chamber.
X-ray microcomputed tomography and image processing
X-ray microcomputed tomography (XCT) scans were performed using a Zeiss Versa 620 X-ray microscope (XRM). The radiographs were acquired using high beam energies of 140 kV and 143 μA, with a total of 1600 projections collected over a 360° rotation. The projections were captured using a 4x magnification objective that resulted in an approximate voxel size of 0.65 μm. An exposure time of 15 s and a camera binning of 2 were used to enhance the signal-to-noise ratio.
XCT scans were taken before sample immersion and intermittently during the immersion period. The freeze-thaw cycled sample was scanned after 150, 450, 800, 1100, 1600, and 2000 cycles. For comparison between the freeze-thaw cycled sample and room temperature sample, the duration of continuous immersion was determined based on the total time of the thaw stages, assuming negligible corrosion kinetics during freezing. Thus, the corresponding duration of continuous immersion for each freeze-thaw cycle was ~1 h. Therefore, scans of the room temperature sample were conducted after 7, 20, 35, 46, 68, and 85 days.
Image analysis and segmentation of all the XCT datasets were carried out using commercially available image analysis software (Avizo 3D, Thermo Fisher Scientific, Waltham, MA). The reconstructed images were processed using a non-local means filter to reduce noise and improve contrast between the phases. For some image datasets, multiple iterations of the edge-preserving non-local means filter were applied to achieve enhanced signal-to-noise ratio images. The volume datasets for each timestep were spatially aligned (Dragonfly software, Comet, Montreal, Canada) to allow direct comparisons of sites at increasing stages of immersion.
Image segmentation was performed to separate the corrosion layer, cracks, and second-phase particles into labeled datasets distinct from the AA7075 matrix. Representative sub-volumes were identified in each sample and extracted for each timestep. Image segmentation was conducted using an interactive thresholding algorithm for the AA7075 matrix and corrosion layer, while an ambient occlusion module in Avizo was used to segment internal cracks. Features consisting of fewer than three voxels were removed using the “remove small spots” module in Avizo to eliminate submicron voids and random noise. The corrosion volume loss at any time step was calculated as the difference in total volume between the initial sample and the matrix segmented at each time step. This measurement captures the reduction in material volume due to corrosion over time.
Microstructural characterization
After 2000 freeze-thaw cycles, the thermally cycled or freeze-thaw (FT) sample was removed from the solution and dried for post-mortem analysis. The sample was mounted in a two-part epoxy with the L-T/S plane along the rolling direction exposed. The surface was ground and polished to a 0.05-μm colloidal silica finish. Imaging was carried out using scanning electron microscopy (SEM), electron backscattered diffraction (EBSD), and energy dispersive spectroscopy (EDS). SEM-EDS images were obtained using a Quanta 3D FEG in a backscatter detector mode with an accelerating voltage of 20 kV and a working distance of 10 mm. EBSD was acquired with a Quanta 650 FEG SEM (FE1 Company, Thermo Fisher Scientific, Oregon, USA) equipped with an EDAX Velocity EBSD Camera, with a step size of 0.5 μm.
Responses