Corrosion evaluation of Al-Cu-Mn-Zr cast alloys in 3.5% NaCl solution
Introduction
The recently developed Al-Cu-Mn-Zr (ACMZ) cast alloys, which contain relatively high (5 ~ 9 wt.%) Cu, were designed to exhibit microstructural stability up to 350 °C1,2, which is up to 150 oC higher than the stability limit of conventional 319 and 356 cast Al alloys3,4. Due to thermal stabilization of the metastable, semi-coherent, theta prime (θ′–Al2Cu) strengthening phase by micro-alloying of Mn and Zr, ACMZ alloys are less susceptible to degradation of mechanical properties at elevated temperatures1,5,6, which makes these alloys attractive structural materials for service temperatures of 300–350 °C. As a demonstration of industrial viability, advanced engine cylinder heads have been previously commercially cast and successfully engine tested7,8. The thermo-mechanical properties and castability of ACMZ alloys are also considered for innovative design of lightweight, hybrid electric powertrains with improved efficiency.
Cu and Si are commonly added as major elements in cast Al alloys to improve mechanical properties and castability, as are other minor alloying elements, including Mn, Mg, Zn and Zr. After casting and aging processes, formation of micro- and nano-scale intermetallic compounds from Al and alloying elements can be observed both within the grains and at grain boundaries1,2,4,5,9,10,11,12,13,14,15,16. Precipitation of alloying elements, particularly Si which has only moderate solubility in Al, is also common in Si-containing 319 and 356 alloys4,13,17,18,19. The Cu-containing alloys also form a range of metastable and stable Cu-based intermetallic phases (for some examples, see Table 1 later), and some of the phases can be very effective as strengthening precipitates. These microstructural features can impact the corrosion resistance of cast Al alloys in aqueous environments as exemplified in the following paragraphs. For any new Al alloy considered for commercial applications, including cast ACMZ alloys, aqueous corrosion resistance is an important performance factor to understand and predict.
In binary Al-Cu and Al-Cu based alloys, Al2Cu phases form predominantly at grain boundaries2,4,9,15,20,21,22,23,24 and act as preferential cathodes which shifts corrosion potential in a noble direction (or results in a higher corrosion potential)21,22,25,26,27,28. It was reported that a minimal Al2Cu contents in Al-Cu alloys with 0.87 and 1.3 wt.% Cu accounted for a noble corrosion potential (~−0.62 V vs. Ag/AgCl) compared to Al2Cu removed Al (~−1.2 V vs. Ag/AgCl) in 0.1 M NaCl29. Al with 1.3 wt.% Cu, presumed to have a higher Al2Cu fraction than the fraction in Al with 0.87 wt.%, exhibited higher cathodic currents and greater weight loss values than Al-0.87 wt.% Cu29, showcasing the role of Al2Cu in promoting Al corrosion. However, Cu in solid solution (up to 4 at.%) in Al was reported to slightly reduce corrosion currents and to exhibit more noble (higher) pitting potentials26,30,31,32 compared to high purity Al in NaCl solutions, implying that Al-Cu alloys without Al2Cu precipitation could even result in improved corrosion resistance. In case of high purity Al with no intermetallic phase, grain and dislocation boundaries were found as the preferential path for corrosion growth33,34.
In a vacuum arc melted Al-Cu alloy with 4.5 wt.% Cu, the corrosion current in 0.5 M NaCl was averaged as 5.4 µA·cm−2 which is an order higher than the corrosion current of high purity Al in the same solution (~ 0.4 µA·cm−2)28. A high corrosion current in Al alloy with 4.5 wt.% Cu was attributed to the accelerated Al dissolution inside Al-Al2Cu eutectic region that formed between the primary Al dendrites28. The literature results highlight that the role of Al2Cu in accelerating Al corrosion is prominent in a wide range of Cu contents and in different locations, for example, ~0.87 wt.% and as individual precipitates29 and ~4.5 wt.% and as a part of Al-Al2Cu eutectic regime in28.
In Al-3.6Cu-0.8Li-0.7Mg-0.3Mn-0.3Zn, Al-4.6Cu-0.4Mn and Al-5Cu-1Mn cast alloys20,35 as well as Al 2060-T8 and 2070-T8 alloys36,37, formation of Al20Cu2Mn3 (also known as T phase) less than 3 µm in size was confirmed within the grains. According to previous data26,32, Al20Cu2Mn3 is electrochemically more noble than the Al matrix, which would cause anodic dissolution of adjacent Al. In contrast, the Al6Mn phase, confirmed in binary Al-Mn cast alloys38,39,40,41, would be electrochemically more active than the Al matrix26 so that the intermetallic phase would be under anodic polarization. Unlike Al20Cu2Mn3 and Al6Mn, the Al3Zr phase, observed in Al 1070 with 0.2 wt.% Zr addition42, was considered to have insignificant micro-galvanic impact due to relatively small difference of corrosion potentials between the phase and Al matrix26. However, Zr addition was reported to refine the grains of Al cast alloys43,44,45, and the finer grains may influence alloy corrosion behavior in conjunction with other micro- and nano-scale phases and precipitations.
Commercial cast Al alloys for higher temperature applications, which typically contain Si, Cu, Mn and other alloying element(s) often form multiple, complex intermetallic compounds. In cast 319, cast RR350 (Al-5Cu-1.5Ni-Mn-Zr) and ACMZ type alloys with 6 ~ 9 wt.% Cu, several secondary phases have been reported as summarized in Table 1. 319 exhibited Si particles, Al2Cu, Al7Cu2Fe and other Si-containing phases4,13,18,46,47, while commercial cast RR350 alloy showed Cu-containing phases, Al7Cu2Fe and Al7Cu2(NixFe1-x), and other phases without appreciable Cu, including Al9FeNi and Al3(ZrxTi1-x)1,4,6. In cast ACMZ with 6 ~ 9 wt.% Cu, Al2Cu phases are observed2,9,23,48,49. In an ACMZ with 7Cu, X-ray diffraction measurement48 also identified Al7Cu2Fe and Al20Cu2Mn3 phases, which may also be present in other ACMZ alloys. With distinct types of intermetallic compound reported for the various cast Al alloys, primary mechanisms for corrosion initiation and growth may be different in each alloy.
In this work, a cast 319 commercial alloy (with ~3.5 wt.% Cu), a cast RR350 commercial alloy (with ~5.0 wt.% Cu), and three variants of cast ACMZ alloys with 6, 7 and 8 wt.% Cu contents were studied via electrochemical and post-immersion corrosion analyses to compare their corrosion response and to understand the relationship between the secondary phase types and corrosion attack initiation/growth in a typical aqueous corrosive environment, 3.5 wt.% NaCl. Aged ACMZ, RR350 and 319 alloys were the focus of this work, since the alloys are rarely used in as-cast condition.
Results
Pre- and post-immersion characterization
The microstructures of 319, RR and three ACMZ alloys are compared in cross-sectional SEM images in Fig. 1 for both the as-cast and aged conditions. Since the 319 samples are almost identical to the 319 reported elsewhere4, Al-Si eutectic zones and elongated Al5FeSi phases can be identified per the reference without chemical analysis. The microstructures of as-cast and aged 319 were similar to each other with no grain boundary observed in the image magnification in Fig. 1a, b because of their large grain sizes (up to few mm). For ACMZ type alloys (Fig. 1c–j), lower magnification SEM images show overall distribution of brighter contrast Cu rich phase, Al2Cu, Al7Cu2(FexMn1-x) or Al7Cu2(Nix,Fe1-x), on grain boundaries, as informed by previous results in Table 1 and indicated by SEM/EDS analysis data presented in Fig. 2.
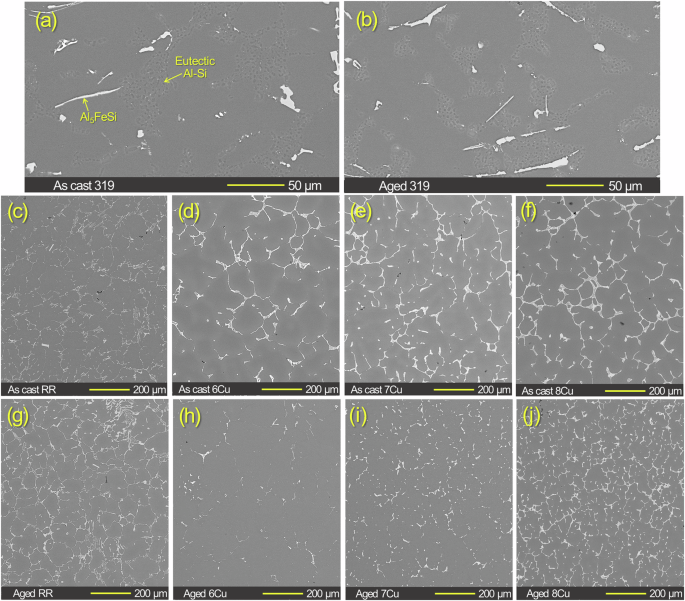
Cross-sectional images of a, c–f as-cast and b, g–j aged 319, RR, 6Cu, 7Cu and 8Cu alloys without corrosion exposure. The average grain sizes of as-cast RR was 46 µm5. The average grain sizes were 67 µm for aged 6Cu and 48 µm for both aged 7Cu and 8Cu2. The surface SEM images of 600 grit SiC finished RR, 6Cu, 7Cu and 8Cu without corrosion exposure are presented in Supplementary Fig. 1.
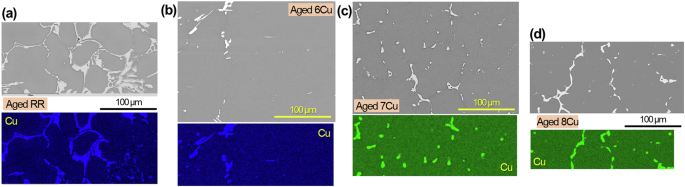
Cross-sectional SEM images and Cu maps of aged a RR, b 6Cu, c 7Cu and d 8Cu without corrosion exposure.
In 6Cu and 7Cu, the area of Al2Cu at the grain boundaries was reduced after aging due to re-dissolution of some Cu into the Al matrix during the solutionizing treatment (Fig. 1d, e, h, i). In 8Cu, the Al2Cu was observed on more grain boundaries with smaller distances between the neighboring phases after aging, which implies more homogenous distribution of Al2Cu in the grain boundaries (Fig. 1f, j). Previous studies, which investigated these ACMZ alloys, reported that the average grain sizes after aging were 67 µm for 6Cu and 48 µm for both 7Cu and 8Cu, and the mean volume fractions of Al2Cu phases at grain boundaries were 0.3, 2.3 and 3.2% for 6Cu, 7Cu and 8Cu, respectively2,5. Although the grain sizes were not significantly different between the aged ACMZ alloys, the volume fraction of Al2Cu was distinctly higher in 7Cu and 8Cu than 6Cu. Since Al2Cu phases can be preferential cathodic sites, the higher intermetallic volume fraction could potentially initiate greater corrosion attack in the 7Cu and 8Cu alloys. However, as discussed later, 7Cu and 8Cu did not exhibit lower corrosion resistance than 6Cu, indicating that the higher Al2Cu volume fractions in the ACMZ alloys did not have a significant effect on corrosion attack.
The EDS maps of aged RR in Fig. 3 show major distributions of Cu, Ni and Mn along with local presence of Sb and O on the grain boundaries. SEM/EDS characterization results of aged RR in another location in Fig. 4 identified Ni-containing intermetallic compounds with and without appreciable Cu that are supposedly Al7Cu2(NixFe1-x) and Al9FeNi with minor Mn & Zr contents, respectively, based on the previous results in Table 1. Two EDS spot measurements inside a grain and on a grain boundary (A & B in Fig. 4) revealed higher Cu content on the grain boundary, which is likely due to the presence of fine Cu rich intermetallic phases as later presented in Fig. 8.
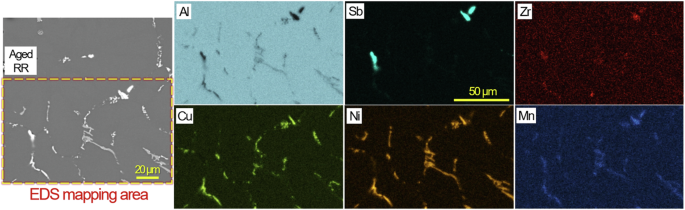
A cross-sectional SEM image and EDS maps of aged RR in an uncorroded region.
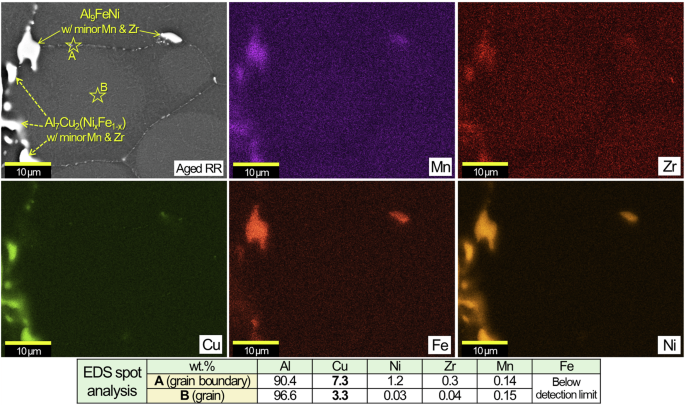
An SEM image, EDS maps and spot composition analyses at A & B of aged RR.
Cross-sectional SEM/EDS characterization results from aged 6Cu, 7Cu and 8Cu are presented in Figs. 5, 6, 7. Major Al2Cu phases are commonly observed in the three alloys while Cu, Fe and Mn rich phases, supposedly Al7Cu2(FexMn1-x), are also identified in local sites adjacent to Al2Cu. Compared to RR, these three ACMZ alloys contained more Mn without Ni and Co additions, leading to formation of intermetallic compounds without Ni. It is also observed that only few Zr rich spots existed within Fe and Mn rich intermetallic phases. Al7Cu2Fe and Al20Cu2Mn3 may also exist in other locations of 6Cu, 7Cu and 8Cu alloy based on the information summarized in Table 1.
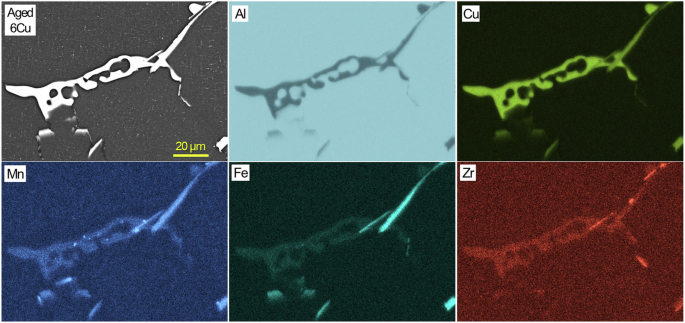
A cross-sectional SEM image and EDS maps of aged 6Cu in an uncorroded region.
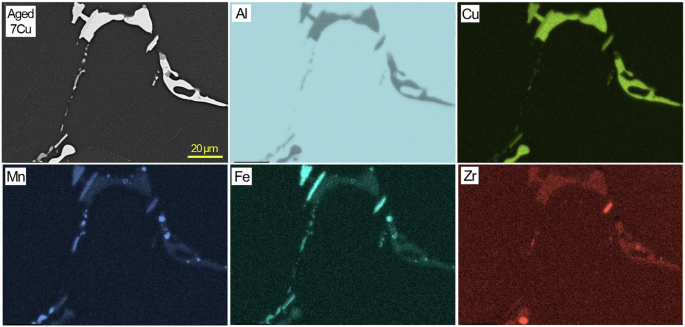
A cross-sectional SEM image and EDS maps of aged 7Cu in an uncorroded region.
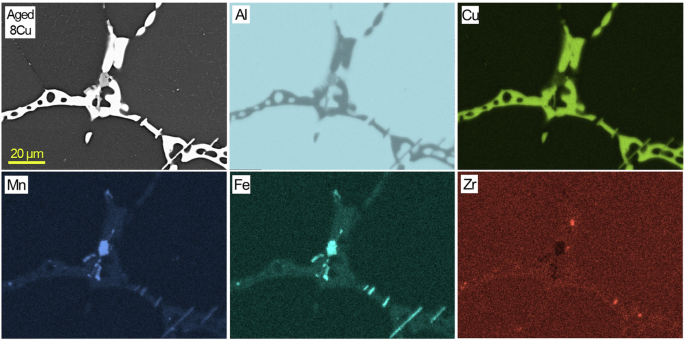
A cross-sectional SEM image and EDS maps of aged 8Cu in an uncorroded region.
High magnification cross-sectional SEM images of RR and three aged ACMZ alloys are presented in Fig. 8 to show grain boundaries without larger ( > 10 µm) Al2Cu, Al7Cu2(FexMn1-x) or Al7Cu2(Nix,Fe1-x) phases. In RR (Fig. 8a), the fine phases are estimated as Al7Cu2(Nix,Fe1-x) particles as supported by the composition results presented in Fig. 4. SEM/EDS characterization of 7Cu (Fig. 8c, e) identified fine Al2Cu particles on the grain boundaries, which suggests the fine bright contrast phases on the grain boundaries of 6Cu and 8Cu (Fig. 8b, d) were Al2Cu as well. These relatively small (< 5 μm on major axis) Al2Cu precipitates also have potential to facilitate increased corrosion attack along the grain boundaries. A fine, uniform distribution of sub-micron, metastable Al2Cu strengthening precipitates within grains1,2,5,9,14,23,50 is also visible in aged 6Cu, 7Cu and 8Cu alloys. The corrosion data in the following paragraphs and sections are used to assess whether the aqueous corrosion susceptibility of these higher-Cu cast ACMZ alloys with grain boundary Al2Cu phases would be substantially greater than that of existing commercial cast alloys, such as 319 or the RR alloy.
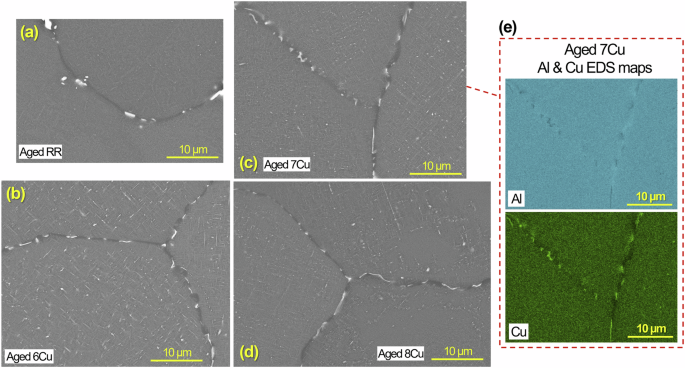
Cross-sectional view SEM images of aged a RR, b 6Cu, c 7Cu and d 8Cu without corrosion exposure to show fine secondary phases on grain boundaries as well as within the grains. Al and Cu EDS maps for c 7Cu are presented in (e).
Post-corrosion SEM and EDS characterization results are presented for commercial cast alloys, aged 319 and RR, in Fig. 9. In aged 319 where interdendritic eutectic Al-Si eutectic regions were observed4, corrosion attack, characterized by Al-lean but O-rich areas, progressed through the interdendritic eutectic zones to a depth of at least 323 µm, clearly indicating preferential attack along the Si particles in the eutectic zones (Fig. 9a, b). Similar but shallower preferential attack in a different location of aged 319 is also presented in Supplementary Fig. 2. Meanwhile, elongated phases, estimated as Al8Si6Mg3Fe per Table 1, and a blocky Al62Si11Fe9Mn4Cu4 phase (designated in Fig. 9a) in the aged 319 showed little corrosion attack around them, suggesting weak impact of the phases on the alloy’s preferential corrosion growth. As presented/discussed later in Fig. 17 and Table 3, Si particles in Al-Si eutectic zone were expected to drive primary galvanic effect in 319.
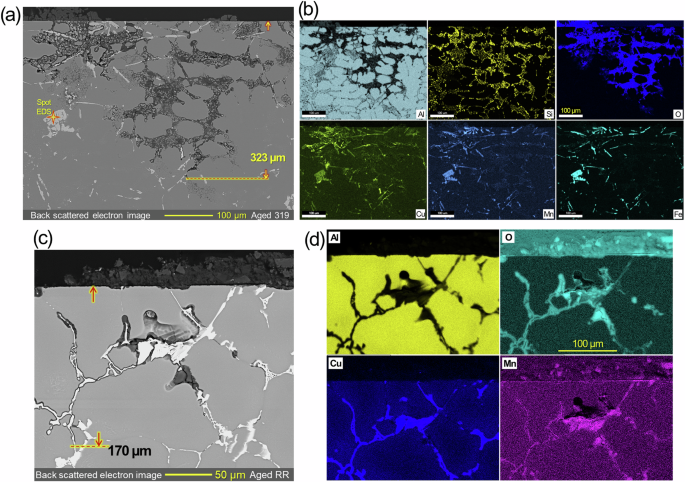
Cross-sectional view SEM images and EDS maps of aged a, b 319 and c, d RR after immersion testing in 3.5% NaCl for 168 h. The maximum corrosion depths are designated in (a, c). The chemical composition revealed by spot EDS in (a) is Al62Si11Fe9Mn4Cu4. A shallower preferential attack in aged 319 and corrosion attacks in as-cast version of 319 and RR are also presented in Supplementary Figs. 2, 3, respectively.
In aged RR, corrosion attack with higher O content occurred along the grain boundaries with larger Al7Cu2(Nix,Fe1-x) to a depth of at least 170 µm (Fig. 9c, d), indicating preferential attack associated with the galvanic influence of Al7Cu2(Nix,Fe1-x). Similarly, preferential corrosion attack surrounding Al7Cu2Fe was also reported in Al 707551. In the inspected location of RR, Mn concentration was higher in the corroded region. Meanwhile, as-cast versions of 319 and RR, presented in Supplementary Fig. 3, exhibited similar corrosion attack to their aged counterparts.
Cross-sectional SEM images and EDS maps for corroded 6Cu alloy after 168 h are shown for as-cast and aged versions in Fig. 10. Preferential corrosion attack along the grain boundaries with Al2Cu was commonly observed in both as-cast and aged alloys to depths of 200 and 288 µm, respectively, similar to the preferential attack observed in the RR alloy (see Fig. 9c, d). These results suggest the key corrosion mechanism, i.e. micro-galvanic effect of Al2Cu or Al7Cu2(NixFe1-x) along the grain boundaries, was similar between as-cast and aged versions of RR and 6Cu alloys. Like RR, Mn concentration was confirmed in the corroded regions of as-cast and aged 6Cu by EDS mapping (Fig. 10c, d). Another example of Al2Cu preferential corrosion attack in 6Cu is presented in Fig. 11a.
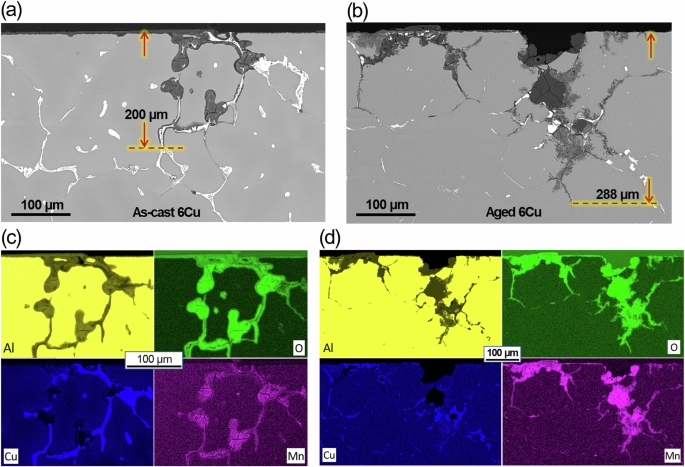
Cross-sectional view SEM images and EDS maps of a, c as-cast and b, d aged 6Cu after corrosion in 3.5% NaCl for 168 h. The maximum corrosion depths are designated in (a, b).
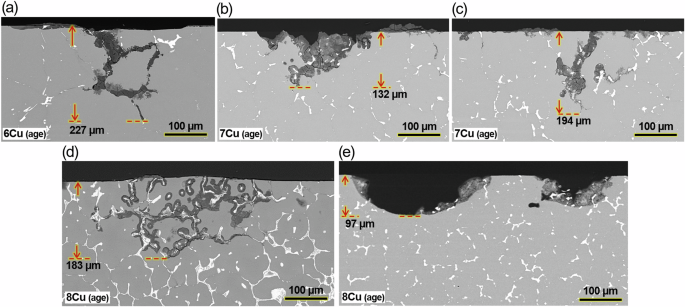
Cross-sectional view SEM images from aged a 6Cu, b, c 7Cu and d, e 8Cu. Corrosion attacks in as-cast version of 7Cu and 8Cu are presented in Supplementary Fig. 4.
For 7Cu and 8Cu alloys, preferential attack, to depths of 194 and 183 µm, along the grain boundary Al2Cu was also prominent as presented for aged versions in Fig. 11c, d and for as-cast versions in Supplementary Fig. 4. In addition, pitting type attack was found in aged 7Cu and 8Cu (Fig. 11b, e), but such dish shaped pitting attacks were shallower than and not as frequent as the preferential corrosion attacks. From a corrosion management standpoint, deep preferential attacks can be more detrimental, and the dish type pits are not discussed further. To summarize, the RR and three ACMZ type alloys showed a common mode of preferential grain boundary attack, associated with Al2Cu or Al7Cu2(NixFe1-x) phases, after immersion in 3.5% NaCl for 168 h.
The maximum corrosion depths in the inspected locations are summarized in Table 2 for aged RR, 6Cu, 7Cu and 8Cu in comparison to aged 319. Obviously, RR and three ACMZ alloys exhibited lower corrosion depths than the one in 319, but the correlation of Cu contents and corrosion depths was not recognized in the three ACMZ alloys. The mass change data from aged 319, RR and three ACMZ alloys were collected but are not discussed in this section because the acid cleaning process was suspected to have removed uncorroded Al matrix, which might have impacted the data validity. Instead, the mass change data in Supplementary Fig. 5 are presented with preliminary discussion.
Electrochemical corrosion analysis
For aged Al alloys, electrochemical corrosion measurements were performed within short-term ( < 3 h) immersion in 3.5% NaCl to evaluate the initial corrosion behavior and alloy passivity. Representative impedance spectra of aged Al alloys are compared in Fig. 12a, b where two impedance arcs were identified, and in the figure, some of the lower frequency noisy data are not presented due to their weak relevancy to the corrosion behavior52. Corrosion resistance of aged alloys, estimated by fitted impedance data, are presented in Fig. 12c with an inset figure illustrating an equivalent circuit52,53,54,55,56,57,58,59,60 for data fitting (the meaning of circuit elements is described in the caption of Fig. 12). Rf + R2 values were considered as resistances to corrosion reaction on Al alloy surface covered by permeable passive film at corrosion potential (Ecorr). With a higher resistance, an Al alloy would have slower corrosion attributed to a lower rate of balanced anodic and cathodic relations. Some previous studies have also used Rf + R2 to evaluate corrosion resistance of Al alloys52,53,58,61,62. The fitting curves for the representative spectra in Fig. 12a, b were satisfactory. The numerical fitting results for all impedance data are summarized in Supplementary Tables 1–5.
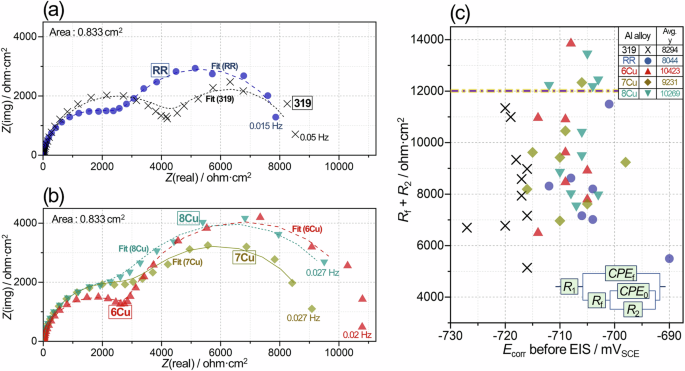
Comparison of a, b representative impedance spectra from aged 319, RR and three ACMZ alloys in 3.5% NaCl, and c characteristic corrosion resistance values, Rf + R2, as a function of corrosion potential, Ecorr, for the aged Al alloys. The inset figure in (c) presents an equivalent circuit model for impedance data fitting. R1 is solution resistance, Rf and R2 represent native passive film and corrosion charge transfer resistances, and two constant phase elements, CPE0 and CPEf, account for non-ideal capacitive behaviors associated with R2 and Rf, respectively. The fitting curves for impedance data in (a, b) are presented with solid and dashed lines.
In Fig. 12c, the individual Rf + R2 values, plotted as a function of Ecorr, show scattering for all Al alloys and are lower than 12 kohm·cm2 for 319 and RR, while some values of 6Cu, 7Cu and 8Cu were greater than 12 kohm·cm2. The average Rf + R2 values were slightly higher in 6Cu, 7Cu and 8Cu than RR and 319. Also noted in Fig. 12c is that corrosion potentials (on x axis) were more noble (higher) in the RR and three ACMZ type alloys than 319. Assuming that anodic Al dissolution kinetics were similar, enhanced cathodic reaction, possibly associated with Al2Cu phases on the grain boundaries, would shift corrosion potentials in the noble direction. This can be supported by a previous observation that Al 2024 with Al2Cu phases showed higher cathodic current and more noble zero current potential (ZCP) than Al 1100 with no Cu-rich phases25. In contrast, removal of Al2Cu by laser treatment on Al 2024 surface reduced cathodic current and shifted ZCP to more active (or lower) direction63.
Representative polarization curves of aged Al alloys to anodic direction are compared in Fig. 13a. In all Al alloys, passive regions, characterized by small currents ( < 0.01 mA·cm−2) over 150 mV range, and subsequent passivity breakdown behavior were observed, which allows determination of pitting potential (Ep) values. In the curves, different cathodic and passive currents between the alloys were also observed, but Ep of each Al alloy was primarily compared to assess the resistance to passivity breakdown / localized corrosion initiation. A plot of Ep as a function of Ecorr is presented in Fig. 13b with a dotted line to guide the positions of Ecorr = Ep and Ecorr + 20 mV = Ep. The positive y distance of each datum from the two guidelines can be considered for passivity—meaning there is a lower chance for passivity breakdown with greater positive y distance (i.e. Ep is relatively higher than Ecorr)36,64,65. It is seen that 6Cu and 8Cu have more data further away in positive y direction from the dotted lines, implying that the alloys would exhibit higher overall passivity. Compared to 319, both RR and 7Cu also exhibited Ep and Ecorr data that suggested higher passivity.
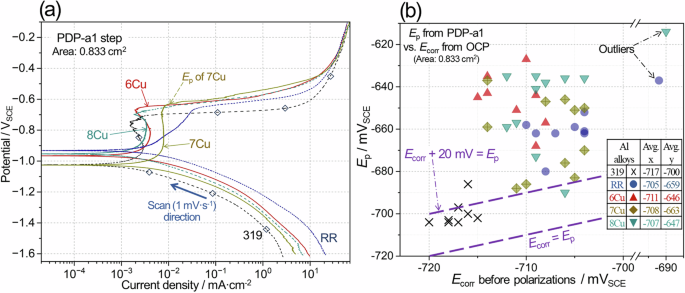
Comparison of a representative polarization curves during PDP-a1 steps from aged 319, RR and three ACMZ alloys in 3.5% NaCl, and b pitting and corrosion potential, Ep and Ecorr, data for the aged Al alloys. An inset table in (b) summarizes the average Ecorr (x) and Ep (y) for 5 Al alloy types. Note that polarization curves of 319 and 6Cu were collected during EIS + PDP, and the other curves were from PDP measurements. As presented in Supplementary Fig. 6, Ep and Ecorr data from EIS + PDP and PDP measurements did not show notable difference. See Tables 5, 6 for the details of PDP-a1, EIS + PDP and PDP.
To enhance visual and semi-quantitative comparison of electrochemical data, the average and standard deviation values of Rf + R2 and Ep – Ecorr (ΔE) are plotted on x and y axes for aged 319, RR and three ACMZ alloys in Fig. 14. In the plot, Rf + R2 accounts for alloy resistance at corrosion potential while ΔE is associated with alloy passivity so that overall corrosion resistance would be considered higher for the data point with larger x and y values. Compared to 319, both 6Cu and 8Cu exhibited distinctively higher ΔE with larger average Rf + R2, suggesting that the corrosion initiation in the two alloys would be less frequent than in 319 during a relatively short exposure to 3.5% NaCl. RR and 7Cu also exhibited greater ΔE values but relatively small differences of Rf + R2 values with respect to 319. According to the comparison of electrochemical data, the relative resistance against corrosion initiation in these alloys can be approximated as 319 < RR ≤ 7Cu < 8Cu ≅ 6Cu. In ACMZ alloys, the correlation between Cu content and overall corrosion resistance is difficult to make as other alloying elements also play a role. Nonetheless, these comparisons indicate that ACMZ alloys are more corrosion resistant than alloy 319 at least for short-term exposures to 3.5% NaCl solution.
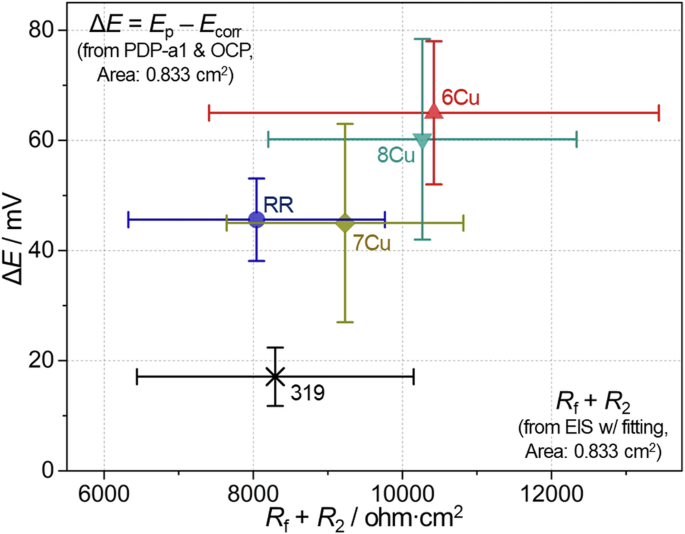
Average and standard deviation values of Rf + R2 and ΔE (Ep − Ecorr) calculated from the individual data in Figs. 12c, 13b for aged 319 and four ACMZ alloys in 3.5% NaCl.
Anodic currents at Ecorr + 20 mV during PSP were measured to verify the alloy passivity for aged 319, 6Cu, 7Cu and 8Cu. Anodic polarization of 20 mV was chosen because it would result in early passivity breakdown for 319 but not for others according to ΔE values in Fig. 14. Representative anodic current transients under Ecorr + 20 mV are compared for four alloys in Fig. 15a. In the plot, 319 and others surpassed 0.01 mA·cm−2 (an arbitrary value for a low corrosion rate) after ~50 and ~180 s, respectively, likely associated with onset of pit growth on the alloy surfaces. After pitting initiation, the anodic currents kept increasing until the end of the measurements, suggesting no practical repassivation, but it is noticed that the anodic currents were an order of magnitude lower in 6Cu, 7Cu and 8Cu than 319 after 600 s. This could be interpreted as slower Al corrosion rates and/or smaller number of active corrosion spots in the three ACMZ alloys that exhibited higher passivity relative to 319. A plot of normalized anodic currents, i.e. the total anodic charge divided by the time during PSP at Ecorr + 20 mV, and average ΔE is presented for four Al alloys in Fig. 15b, highlighting that three ACMZ alloy types with higher ΔE had lower anodic currents.
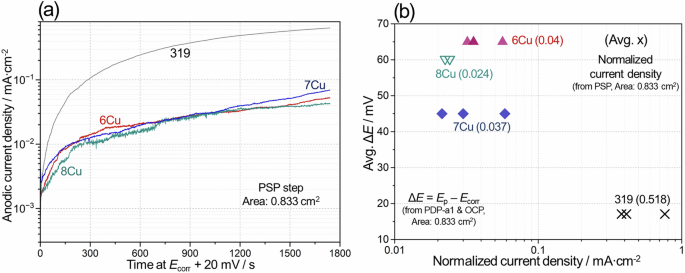
Comparison of a anodic current transients during PSP at Ecorr + 20 mV in aged 319, 6Cu, 7Cu and 8Cu alloys and b normalized anodic currents during PSP and avg. ΔE plotted for the four alloys in 3.5% NaCl. In (b), the avg. x values are indicated in (). See Tables 5 and 6 for the details of PSP measurements and Fig. 14 for ΔE values.
Representative polarization curves to anodic direction during PDP-a2 step are compared for aged Al alloys in Fig. 16a. Like the polarization curves in Fig. 13a, passive region and passivity breakdown were observed for determination of Ep values. From the curves, it was also possible to determine the maximum passive current, as exemplified in Fig. 16a for aged 319. Ecorr vs. Ep values from PDP-s measurements are plotted in Fig. 16b where Ep values were more noble in 6Cu, 7Cu and 8Cu than 319. The average values of Ecorr were within 10 mV difference in OCP steps of PDP and PDP-s (see the inset tables in Figs. 13b, 16b), while the average Ep values during PDP-a1 and PDP-a2 showed a slightly larger difference (20 mV) for 8Cu. Overall, no significant difference in the average Ep and Ecorr values is present between PDP and PDP-s measurements, indicating that the polarization measurements captured relatively consistent corrosion behaviors.
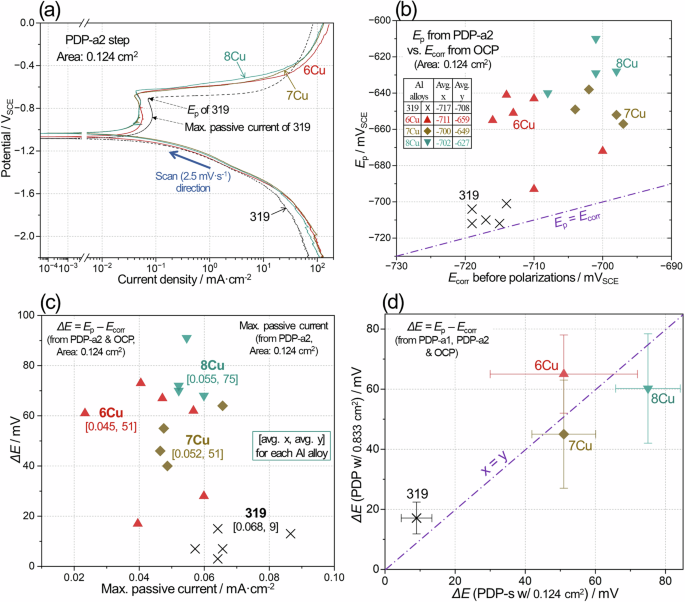
Comparison of a representative polarization curves during PDP-a2 step for aged 319 and three ACMZ alloys in 3.5% NaCl, b Ecorr vs. Ep plot data for the aged Al alloys, c max. passive current vs. ΔE plot, and d ΔE from PDP and PDP-s (from the areas of 0.833 and 0.124 cm2, respectively) plotted on x and y axes. In (a) the point, where max. passive current for 319 was determined, is designated. An inset table in (b) summarizes the average Ecorr (x) and Ep (y) for 4 Al alloy types. In (c) the average x and y values for each alloy are presented in [].
The individual max. passive currents and Ep – Ecorr (ΔE) values are plotted on x and y axes for four Al alloys in Fig. 16c. The comparison of average ΔE values gives 319 < 6Cu ≈ 7Cu < 8Cu while the max. passive currents were slightly lower in 6Cu, 7Cu and 8Cu than in 319. It is probable that a more protective passive layer (with lower solution permeation or passivity breakdown) would exhibit lower passive current, based on literature data63 where passive current was about one order lower in an anodized Al 2024, that had thicker and more protective oxide layer, than untreated Al 2024. Thus, the data presented in Fig. 16c again suggest that aged 6Cu, 7Cu and 8Cu exhibited higher resistance to localized corrosion initiation than aged 319.
The average and standard deviation values of ΔE, determined by PDP and PDP-s (with the areas of 0.833 and 0.124 cm2, respectively) are plotted on x and y axes, respectively, in Fig. 16d. The x, y coordinates of each alloy are close to x = y line in the figure, indicating that the values of ΔE from two independent measurements agreed with each other. Higher ΔE was estimated for 319 and 6Cu in PDP while 7Cu and 8Cu showed higher ΔE in PDP-s. This plot further supports that ACMZ alloys have higher initial passivity than 319 for short-term immersion in 3.5% NaCl. It is speculated that microstructural features, such as Si particles and other intermetallic compounds of 319 cause more frequent passivity breakdown for corrosion initiation. The susceptibility to corrosion initiation and growth in each alloy is further discussed in the following section in term of the micro-galvanic impact possible between the Al matrix and secondary phases including Si particles and other intermetallic compounds.
Comprehensive evaluation of alloy corrosion resistance
Characterization of preferential attack after a long-term (168 h) corrosion immersion indicates that micro-galvanic effects, between Al and Si in 319 and between Al and Al2Cu in the RR and three ACMZs, play a key role for the growth of corrosion attack. To systematically understand the micro-galvanic effect probable in 319, RR and the three ACMZ type alloys, Fig. 17, comparing Ep and Ecorr data of Al, Al-2 at.% Cu (Al-2Cu) and secondary phases from26, is provided in conjunction with Table 3, correlating chemically similar secondary phases for corrosion evaluation. From the previous Ep and Ecorr data, passivity breakdown of the Al matrix, associated with corrosion initiation, and anodic polarization of Al matrix, driving the growth of Al corrosion, are assessed. In simple terms, passivity breakdown of Al or Al-2Cu matrix can be considered more frequent when Ecorr of a secondary phase (diamond symbol) is more noble than Ep of Al or Al-2Cu (upper dotted lines in Fig. 17a, b, also see red arrows in the figures), and anodic polarization is effective when Ecorr of second phase (round symbol) is more noble than Ecorr of Al or Al-2Cu (lower dotted lines in Fig. 17a, b).
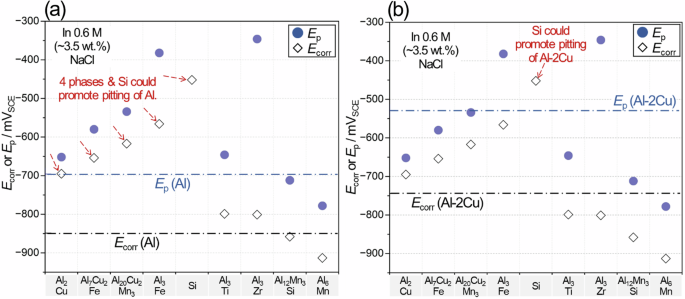
Ecorr and Ep data of secondary phases in symbols with respect to a Al and b Al-2 at.% Cu (Al-2Cu) in dotted lines. The data source is26. The numerical presentation of Ecorr and Ep data is available in Supplementary Table 6.
Using the assumption that Ep and Ecorr are similar between the paired secondary phases in Table 3, it is possible to predict the micro-galvanic effect of each phase on Al or Al-2Cu matrix for passivity breakdown and anodic polarization. As summarized in Table 3, all secondary phases in 319 and ACMZ alloys can produce anodic polarization for Al and Al-2Cu matrices, but it should be noted that Si would provide the highest polarization (the greatest distances between Ecorr of Si and the Ecorr lines of (Al) and (Al-2Cu) in Fig. 17), implying that the driving force for Al corrosion attack provided by Si particles would be greatest. This assertion agrees with the observation of a deep preferential attack in Fig. 9a. However, a separate Si cathode, not interfacing with Al, showed little cathodic activity that would result in insignificant micro-galvanic impact66, implying that cathodic performance of Si would be dependent on the physical contacts with Al.
Given that Si particles are not effectively passivated (i.e. no full coverage of Si oxide) so are cathodically active, it can be predicted that Si would cause passivity breakdown of both Al and Al-2Cu. Meanwhile, other secondary phases would only initiate passivity breakdown of Al matrix. If Si particles are not passivated in 319, they can increase the frequency of passivity breakdown and eventually the alloy corrosion susceptibility. This assertion can be supported by electrochemical corrosion evaluation (Figs. 12–16) where 319 showed lower passivity than the other Al alloys. Between RR, 6Cu, 7Cu and 8Cu that contained Cu-rich phases, i.e. Al2Cu or Al7Cu2(NixMn1-x), in common, the presence of Al9FeNi only in RR may explain the lower initial corrosion resistance of RR estimated in Fig. 14.
The Al3(ZrxTi1-x) phase, that has also been reported in RR6 and is likely in the three ACMZs, may contribute to the micro-galvanic effect which can be estimated using Al3Ti and Al3Zr data in Fig. 17. The two phases can produce anodic polarization for Al but would be prone to dissolution by the more noble Al-2Cu matrix. Compared to other secondary phases in RR causing both passivity breakdown and anodic polarization for Al (see Table 3), Al3(ZrxTi1-x) would be relatively benign and not likely to cause initial passivity breakdown.
With respect to long-term corrosion prediction, both 319 and ACMZ alloys are expected to experience continuing growth of preferential corrosion attack as long as the aforementioned micro-galvanic effects are present within the corrosion attack front. Thus, preventing constant access of abundant corrosive solution to the alloys would be necessary to minimize the risk. If long-term exposures to corrosive media can be avoided, then resistance to corrosion initiation becomes an important factor to predict potential corrosion risks in Al alloys. Short-term (< 3 h) electrochemical corrosion data, presented in Figs. 12–16, as well as micro-galvanic effect evaluation, summarized in Fig. 17 and Table 3, were useful to compare the initial corrosion resistance associated with passivity breakdown between 319, RR and three ACMZ type alloys. The initial corrosion resistance would be estimated as 319 < RR < 6Cu ≅ 7Cu ≅ 8Cu. Generally, results of this study indicate that the cast ACMZ type alloys would have equivalent or superior corrosion resistance to commercial cast 319 alloys in aqueous corrosion environments.
The corrosion behavior of RR and three Al-Cu-Mn-Zr (ACMZ) cast alloys (with 5 ~ 8 wt.% Cu) was studied and compared to cast 319 alloy (with 8 wt.% Si and 3 wt.% Cu) in 3.5% NaCl solution using electrochemical tests and microstructural characterization before and after corrosion exposure for 168 h. The results and analyses of this work are summarized below.
-
1.
RR and ACMZ type alloys, including 6Cu, 7Cu and 8Cu, exhibited Cu-rich phases (Al2Cu or Al7Cu2(Nix,Fe1-x) at the grain boundaries in as-cast and aged conditions. After 168 h immersion in NaCl solution, growth of preferential corrosion attack was observed along the Al2Cu decorated grain boundaries in aged ACMZs but occurred along the Al-Si eutectic interdendritic regions (with Si particles) in aged 319. The preferential attack was driven by micro-galvanic coupling between Al and Al7Cu2(Nix,Fe1-x) in the RR but between Al and Al2Cu in the ACMZ alloys but by Al and Si particles in 319. This implies that continuous immersion exposure of both 319, RR and ACMZ alloys in an aqueous corrosive environment would be a concern as the corrosion attack could grow without effective repassivation. Nonetheless, it should be noted that 319 has proven to be an effective alloy for cast automotive heads and blocks for decades.
-
2.
Short-term (< 3 h) electrochemical measurements, including electrochemical impedance spectroscopy (EIS) and polarization techniques, enabled the evaluation of alloy resistance to corrosion initiation. Two-dimensional plots of Rf + R2 from EIS and Ep – Ecorr (difference of pitting and corrosion potentials, ΔE) were used to visually and semi-quantitively compare the alloy resistance to corrosion initiation and showed that RR and ACMZ type alloys are less susceptible to corrosion initiation than commercial 319 alloy. Anodic currents at a constant potential, Ecorr + 20 mV, were greater in 319 than 6Cu, 7Cu and 8Cu alloys, which supports higher resistance of ACMZ type alloys to corrosion initiation.
-
3.
Higher susceptibility to corrosion initiation in 319, as compared to ACMZ type alloys, is attributed to Si particles with micro-galvanic driving force for anodic polarization (AP) and passivity breakdown (PB) of Al matrix. In ACMZ alloys, Al2Cu is the phase causing AP and PB but its micro-galvanic effect against Al is estimated to be less significant than Si.
Methods
The chemical compositions of 319, RR350 (simply referred to as RR) and three ACMZ type alloys (referred to as 6Cu, 7Cu and 8Cu) are summarized with their respective heat treatment histories in Table 41,2,4,5. The ACMZ types are characterized by their relatively high Cu contents (> 5 wt.%) and appreciable amounts of Mn and Zr. The RR350 (RR) alloy, which can be included in extended ACMZ categories, is a premium cast commercial alloy with Cu (5 wt.%), Ni, Co and Sb. 319 was selected as the reference commercial alloy for comparison of corrosion resistance with ACMZ alloys. Some 319, RR and ACMZ samples were also tested in the as-cast condition to compare the response of microstructures with and without aging. The dimensions of all samples are within the ranges as follows; 25 ~ 60 mm (length), 15 ~ 50 mm (width) and 1.5 ~ 2 mm (thickness).
Corrosion behavior of ACMZ and 319 alloys was evaluated using combinations of the different electrochemical techniques summarized in Tables 5, 6. Table 5 also contains the acronyms (OCP, EIS, PSP & PDP) used to refer to the different electrochemical techniques. To determine the electrochemical component values relevant to corrosion behavior, a computer software (Zview version 4.0 g) based on a complex non-linear least squares simulation67,68 was utilized to fit the impedance data collected from EIS measurements. In the EIS + PDP measurements, impedance data at the corrosion potential (Ecorr) after OCP was collected first, and subsequent polarization measurements were performed to monitor anodic/cathodic current transients and passivity/pitting behavior. PDP measurements, i.e. polarizations without previous EIS, were also conducted to verify that the polarization behavior of Al alloys is similar between the EIS + PDP and PDP conditions. PDP-c1 step was applied to gradually move the alloy electrode potential to cathodic direction prior to PDP-a1 step (see Tables 5, 6).
Other potentiodynamic polarization measurements, referred to as PDP-s with PDP-c2 and PDP-a2 steps, were performed to investigate the passive current and pitting potential (Ep) values using the parameters with higher previous cathodic charges and a faster forward scan rate. More specifically, a sufficient cathodic charge during PDP-c2 supposedly consumes dissolved oxygen, by O2(g) + 2H2O(l) + 4e− → 4OH−(aq), and produces local deaeration near the Al alloy surface. In addition, the purpose of PDP-c2 was to gradually transit Ecorr to a cathodic potential. In the subsequent PDP-a2, a relatively fast scan rate, 2.5 mV·s−1, enabled collection of polarization curves in a short time before the locally deaerated environment was disrupted. This PDP-s sequence provided polarization curves where passive current and pitting potential values were more consistent than the ones from PDP measurements (with 1 mV·s−1).
The selected scan rates, particularly 2.5 mV·s−1, are greater than a common scan rate, 0.167 mV·s−1 69,70,71,72. According to the authors’ empirical assessment on a large volume of polarization data from several Al alloys, such high scan rates were effective to reveal passive and breakdown behavior. However, it should be noted that anodic and cathodic slopes of Al alloys may not be similar between the different scan rates (0.167, 1 and 2.5 mV·s−1). For this reason, the estimation of corrosion current using anodic and cathodic slopes was not performed. The intent was to compare the passive region and Ep values for the selected Al alloys.
In addition to EIS and potentiodynamic polarizations, PSP measurements were also conducted as another independent method to compare the anodic current transients associated with Al alloy passivity and Al dissolution after passivity breakdown. Prior to all electrochemical measurements, Al alloy sample surfaces were finished with 600 grit SiC paper and masked to expose 0.124 cm2 for PDP-s sequence but 0.833 cm2 for other sequences using polymer tapes with an opening of Ø = 0.4 and 1.03 cm, respectively. The exposed surface of specimens was facing upward in 3.5 wt.% NaCl solution (~ 40 mL) open to air at room temperature (22 ~ 23.5 °C) during the electrochemical measurements, wherein Pt sheet or mesh with a surface area of at least 5 cm2 was used as a counter electrode along with a reference saturated calomel electrode (SCE). All electrochemical measurements described above were repeated at least three times for each Al alloy type for statistical confidence.
Corrosion immersion tests of 319, RR and ACMZ alloy coupons for 168 and 336 h were also performed using 3.5 wt.% NaCl solution open to air at room temperature for mass change and post-immersion characterization data. Prior to the tests, the surfaces of Al alloy coupons received 600 grit SiC finish, and the initial mass and coupon dimensions were recorded. The samples were then tape masked to expose 0.833 cm2 (Ø = 1.03 cm). After immersion, the alloy specimens were cleaned to remove corrosion product(s) using concentrated HNO373 and ethanol rinse followed by deionized water washing in an ultrasonic bath. This chemical removal of corrosion product(s) was repeated until the specimen mass, measured by a lab balance (Mettler Toledo XP205 with an accuracy of ±0.04 mg), was considered unchanged from further cleaning.
Unlike the samples used for the mass change data, the immersion (168 h) tested samples selected for post-corrosion characterization only received a water rinse to preserve corrosion products. Microscopic and X-ray based chemical characterization were conducted using a TESCAN Mira3 scanning electron microscope (SEM) equipped with an energy dispersive X-Ray spectroscopy (EDS) system for corroded Al alloy cross-sections that were mirror-polished using a fine alumina suspension. As-cast and aged 319, RR and ACMZ alloys without corrosion immersion were also prepared by 600 grit SiC finish for the surfaces and mirror polishing for cross-sections to compare the microstructures before and after aging treatment.

Responses