Fracture analysis under modes I and II of adhesive joints on CFRP in saline environment
Introduction
In technological evolution, composite materials have emerged as key players, revolutionizing various sectors. In this context, carbon Fiber Reinforced Composites (CFRP) have increased attention for their exceptional strength, low weight, and versatility, evolving from a niche material to an essential component in modern engineering1. They have become indispensable in aerospace elements, high-performance automobiles, prostheses, and structural components in construction. Their undeniable mechanical strength, lightness, corrosion resistance, and fatigue resistance place them at the epicenter of the constant search for more efficient and sustainable materials.
Innovation goes beyond simply using CFRPs; the method of joining their components is equally important2,3. Adhesive joints have become a key technique, offering an alternative to traditional mechanical joining methods like riveting or screwing. However, adhesive joints can suffer from delamination, which is a significant drawback. Delamination is a critical concern for the structural integrity of laminated composites, and recent advancements have focused on enhancing Mode-I and Mode-II fracture toughness through the incorporation of 3D-printed polyamide (PA) interlayers4. This approach has demonstrated significant improvements in fracture toughness and energy dissipation, though at the cost of reduced flexural properties. Additionally, techniques such as Additive Manufacturing (AM) to modify the surface morphology of metal adherends have shown potential in improving the reliability of CFRP/metal joints by enhancing the toughness of adhesive bonds without traditional surface treatments5. To address this, it is crucial to consider the physical, chemical, and mechanical properties of the materials being bonded. Proper surface treatment is essential to enhance adhesion, as it can significantly improve the initial properties of these surfaces by increasing their surface tension and wettability.
There are various types of adhesives used for these joints, including epoxy-based adhesives6, acrylic adhesives7, and hybrid adhesives8. Key factors associated with the behaviour of adhesive joints in CFRPs9, particularly in terms of delamination initiation and growth, include the study of joint properties, adhesive thickness, and the different types of adhesives used. These factors are examined using different testing methodologies: pure shear tests10,11,12, wedge tests13, mode I fracture tests14, mode II fracture tests15, and mixed mode I/II tests16.
Mode I has received greater attention over the years because it is the most critical type of fracture for crack propagation, resulting in less focus on other fracture modes. Recently, there has been growing research into the behaviour, characteristics, and outcomes of Mode II, using End-Notched Flexure (ENF) tests17, which are more characteristic of this fracture mode, as well as 4ENF18 and End-Loaded-Split (ELS) tests. These tests provide the necessary shear stress for crack propagation19,20.
Furthermore, there is extensive literature on the behaviour of adhesive joints under specific atmospheric conditions, such as different extreme temperatures21,22,23,24,25, including cryogenic temperatures (−180 °C)26, their performance in saline environments, and the study of joints and all fracture types using finite element programs with the cohesive law27,28,29,30, the phase-field-based approach31, or results obtained with digital image correlation (DIC) equipment32,33,34. Some authors also present fractographs of the tested specimens, always with a superficial analysis35,36,37,38.
The primary objective of this study is to analyze the fracture surfaces of epoxy-based adhesive joints on a unidirectional carbon fiber-reinforced epoxy composite substrate after exposure to a high-concentration saline atmosphere. This type of adhesive is chosen due to its critical relevance in high-performance applications, such as in the aerospace industry and construction.
The study focuses on the behaviour of these joints following crack propagation in both mode I and mode II fractures, under both static and dynamic loading conditions. Additionally, it examines the chemical variations in specimens without exposure compared to those exposed to the saline environment during the specified periods, noting that presumably the degradation is arising from chemical interactions with the cured matrix/composite.
The methodology involves the preparation and analysis of specimens specifically designed to simulate crack propagation in the two fracture modes examined in this study. Samples are subjected to zero, one, and twelve weeks of exposure to saline fog, designated as 0WESE, 1WESE, and 12WESE respectively, where “WESE” stands for “Weeks of Exposure in a Saline Environment”. Following these exposures, a detailed examination of the adhesive surface morphology, and chemical composition, is conducted using a Scanning Electron Microscope (SEM)39. This approach not only enables the evaluation of the adhesive response in terms of fracture and deformation but also provides a detailed view of how salt mist exposure impacts the adhesive structure and integrity over time. Furthermore, this study employs Fourier Transform Infrared Spectroscopy with Attenuated Total Reflectance (FTIR-ATR) for chemical characterization. This technique is widely used to investigate chemical changes in adhesives, especially in aging studies40,41,42, where environmental exposure, such as saline environments, can significantly alter material properties. FTIR-ATR is particularly effective in detecting oxidation processes43 chemical degradation, and other molecular changes in the adhesives.
Results and discussion
This section presents the results and discussion of each phase of the study: mechanical characterization, three-dimensional surface analysis, and the chemical analysis, including in the latter the chemical composition and degradation analysis.
Mechanical characterization
Presented below are the experimental results from the study on the behaviour of adhesive joints under Mode I and Mode II for static and fatigue loads, which were subjected to various aging periods.
For the static regime, Table 1 shows the average values of the ERR for both Mode I (GIC) and Mode II (GIIC), as well as the average maximum load (Pmax), and displacement (δ) at the maximum load point, for the various exposure periods considered.
From the obtained results, under Mode I fracture, it can be observed that the displacement decreases while the load increases for exposed specimens, with the minimum and maximum values obtained for 1 week of exposure.
Conversely, in the tests conducted in Mode II, there is a decrease in the average displacement achieved by the specimens when the exposure period in the chamber increases, indicating a slight reduction in the ductility of the adhesive when the exposure increases. However, when considering the maximum load level reached, the values remain virtually constant regardless of the exposure duration.
The improvement in GIC and GIIC for 1WESE, may be attributed to the post-curing of the adhesive that occurs over the first week, which positively affects the performance and outweighs the effects of aging, thereby enhancing the values of the studied parameters.
For the dynamic regime, tests with a frequency of 3 Hz were carried out using Pmax as the reference load to calculate Gmax. A ratio R = Gmin / Gmax = 0.1 was used to determine the minimum value of the wave.
In order to evaluate the results obtained from the experimental program, a probabilistic analysis of the entire fatigue life field was conducted. For this purpose, a Weibull regression model proposed by Castillo et al. 44,45. was used as a statistical tool, which allows for the normalization of the fatigue life field.
In Fig. 1, the fatigue curves are displayed for a 5% probability of failure for the adhesive joints studied under Modes I and II of fracture. On the x-axis, the normalized value is presented, which results from dividing the maximum energy relaxation rate by the critical energy release rate obtained during the static characterization of the material. On the y-axis, the maximum number of cycles reached during the fatigue tests is shown.
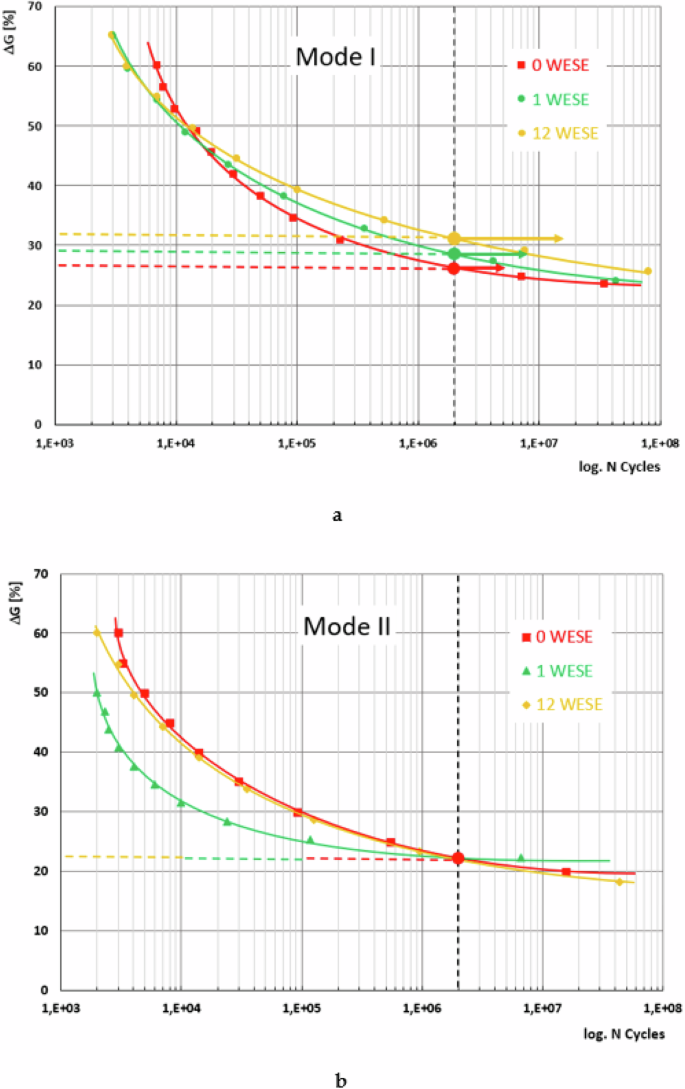
Trend of fatigue behaviour for the three exposure periods studied as a function of Gmax/GC: a Mode I; b Mode II.
In general, slight differences are observed in the behaviour of the adhesive joint studied depending on the fracture mode and the duration of exposure to the saline environment to which the tested samples were subjected. In the low cycle number zone under Mode I fracture, the fatigue life values are lower for the exposed specimens, for both one week and twelve weeks.
However, the trend shifts at medium and high cycle numbers. For low GImax/GIC values, close to the infinite life limit, the joint exhibits better behaviour after 12 weeks of exposure and shows identical behaviour between the unexposed and the one-week exposed material, if a fatigue limit of 2 × 10⁶ cycles is assumed. Points marked with a filled circle and a horizontal arrow in the figure indicate that as the exposure period increases, the fatigue performance improves.
Under Mode II, depending on the fatigue life zone considered, a different behaviour can be observed compared to Mode I fracture. Here, the unexposed material and the material subjected to saline degradation for 12 weeks exhibit the same behaviour across the entire fatigue life field. Meanwhile, the material exposed for one week clearly shows poorer performance in the high and middle zones. However, in the zone considered to have infinite life, around two million cycles, its performance tends to align with the other two cases studied, and all three cases can be said to have the same fatigue limit. From this perspective, the selected aging process does not alter the fatigue behaviour under Mode II fracture of the adhesive joint studied.
Study of the surface of the specimens
After conducting the tests, the analysis of the resulting fracture surfaces was carried out, focusing particularly on the initiation zone of the fatigue. A JEOL-JSM5600 scanning electron microscope (SEM) was used, with its lens tilted at a 45-degree angle to better observe the differences between the two fracture modes, without any aging. This analysis was performed at various magnifications: 50×, 300×, 1000×, and 3000×.
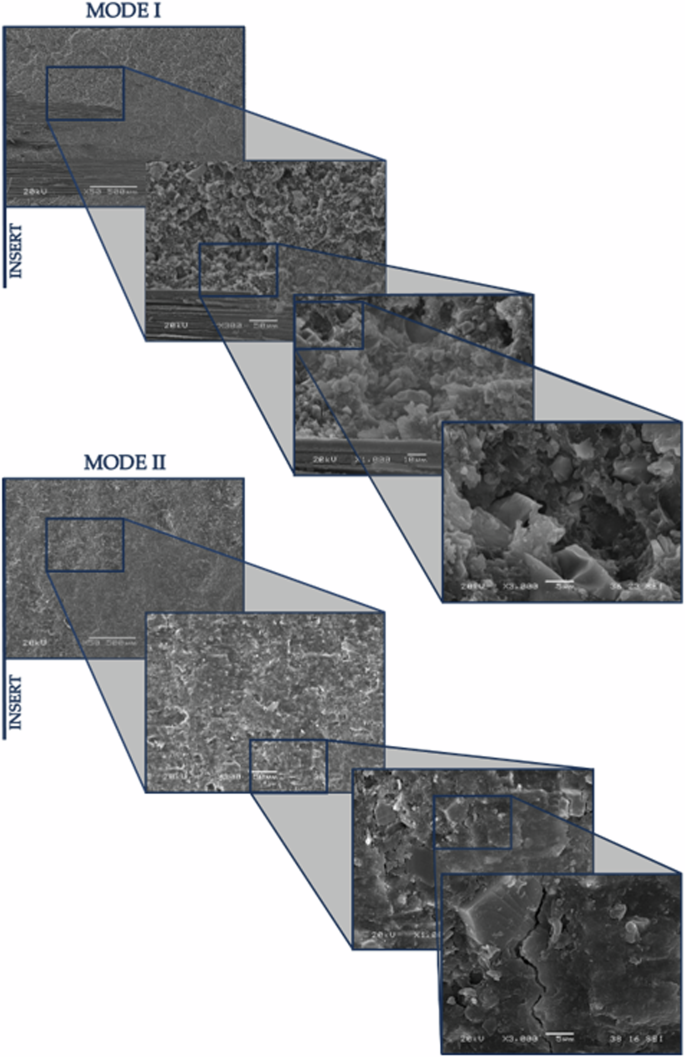
In Fig. 2, images of the fracture surfaces are presented, captured at a 45° tilt to analyze the differences in height, thickness, and grain size in the adhesive depending on the type of stress applied (mode I and mode II). It is evident from the lower magnification images that the surfaces have both similarities and differences. Common features include, in both modes, the area near the insert that initiates the fracture process, where the failure is predominantly cohesive and the direction of crack propagation can be observed.
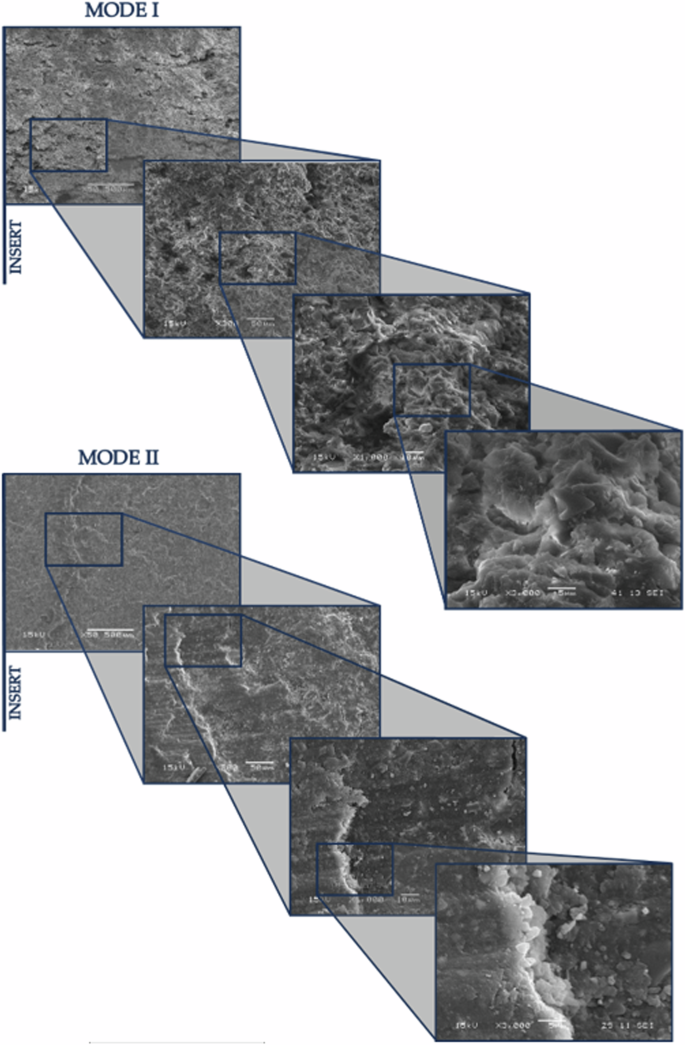
Mode I and Mode II, 0WESE fracture surfaces at 50×, 300×, 1000×, and 3000× magnification with 45° lens tilt.
However, the principal differences between the two modes manifest in several ways. In Mode I, the fracture surface is more ductile, characterized by greater relief and significant deformation before the final breakage. This results in an irregular and jagged surface with adhesive remnants pointing outward from the specimen, evident from the 1000× magnification images. In contrast, Mode II presents a different scenario due to the test setup where the upper layer slides over the lower layer. This interaction causes the marks along the fracture to be gradually erased due to the friction between the arms. Consequently, the surface in Mode II is nearly flat, although a small step is also visible, coinciding with a change in the delamination plane. These distinctions in fracture morphology between the two modes are most observable in the high-magnification images.
In Fig. 3, images of the fracture surfaces from specimens not exposed to saline fog in both Mode I and Mode II are displayed. From these images, the 3D surfaces are obtained. The images were captured using the Backscattered Electron (BSE) method, which employs four strategically positioned detectors around the specimen. Additionally, images from specimens exposed to saline fog for 1 and 12 weeks were processed using the same method. The 3D surfaces were then generated using MountainsSEM®, a commercial software for Scanning Electron Microscopy. This process allows for a detailed examination of the differences between the modes and exposure periods, effectively highlighting variations in the surfaces.
a topographic view with north detector; b topographic view with east detector; c topographic view with south detector; d topographic view with west detector; e SEM view.
In Fig. 4, several differences are observed in Mode I across different exposure periods, particularly in the separation between the beach marks generated by the fatigue process and their topography. There is a noticeable trend where, as the aging time increases, the distance between these lines also increases, although the crack progression is visible in all three images. The average distance between fatigue lines for the unexposed specimen is 300 µm (as indicated by the lines marked at longitudinal positions of 400 µm and 700 µm in Fig. 4a). Upon examining the adhesive surface after one week of exposition (Fig. 4b), a rougher texture is evident, which makes it difficult to clearly discern the lines. However, the lines can still be approximated at distances of 300 µm and 800 µm, with a separation of about 500 µm between them, indicating an increase compared to the unexposed sample. After 12 weeks of exposure (Fig. 4c), no lines are visible, as the surface becomes significantly flatter. This phenomenon illustrates how the exposure to saline environment affects the degradation of the adhesive. Fatigue lines, indicative of the fatigue process, tend to be closer together when the crack encounters more resistance to progress, which is linked to the energy at the crack tip. This observation suggests a gradual change in material properties over time, leading to degradation and breakdown of the adhesive. Such changes result in rougher surfaces and a shift in both the topography of the adhesive and its behaviour, reflecting a variation in fatigue resistance as the aging process progresses.
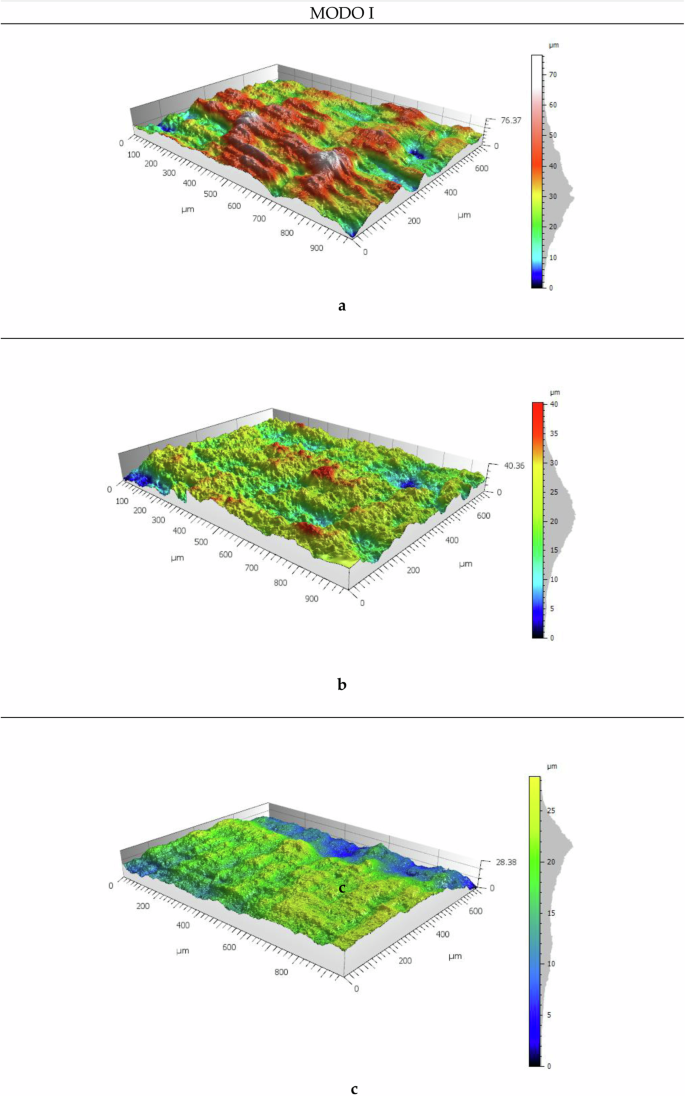
Mode I. (a) 0WESE; (b) 1WESE; (c) 12WESE.
In Fig. 5, different fracture surfaces can be observed with varying periods of exposure in Mode II. The three-dimensional analysis of the specimens based on their aging reveals significant characteristics. There is a noticeable trend for the surfaces to show pronounced longitudinal lines aligned with the crack progression and an increased thickness in the analysed specimens. This phenomenon is attributed to the intrinsic shearing movement characteristic of Mode II. As exposure increases, these longitudinal lines tend to become less defined, suggesting a relationship between material degradation and the visual manifestation of fatigue patterns associated with Mode II fractures. This overshadows the beach marks generated by fatigue, similar to what was observed in Mode I when the weeks of material degradation advanced. These observations in 3D models provide a more detailed and visually illustrative understanding of the sample surface evolution throughout the aging process. Analysing the average distance between fatigue lines observed for the unexposed specimen (Fig. 5a) is 325 µm (see the lines at longitudinal marks of 200 µm and 500 µm, and also between 500 µm and 850 µm). For one week of exposure (Fig. 5b) the distance between lines increases to 420 µm (see the lines at longitudinal marks of 400 µm and 820 µm). Finally, for 12 weeks (Fig. 5c), no beach marks are shown in the analysed specimen, as was also the case in Mode I for the same period of exposure to a saline environment. This behaviour, where the separation between lines is smaller on the unexposed surface and increases as exposure increases, directly relates, as in Mode I, to the resistance to the crack progression, confirming the degradation of the adhesive also in this mode of fracture. However, in this mode, the difference is not as noticeable, as the lines in the longitudinal direction.
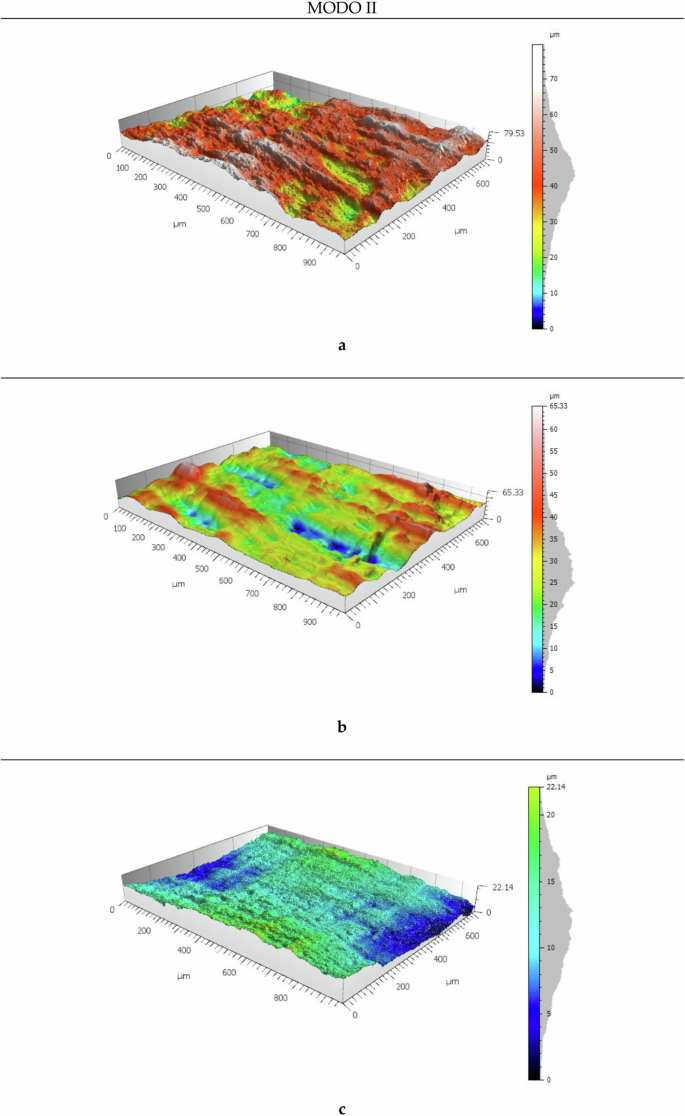
Mode II. (a) 0WESE; (b) 1WESE; (c) 12WESE.
In Figs. 6 and Fig. 7, shown below, the surface of the specimen is displayed for one and twelve weeks of exposure, in both Mode I and Mode II, at different magnifications.
Mode I and Mode II fracture surfaces, 1WESE at various magnifications (50×, 300×, 1000×, and 3000×).
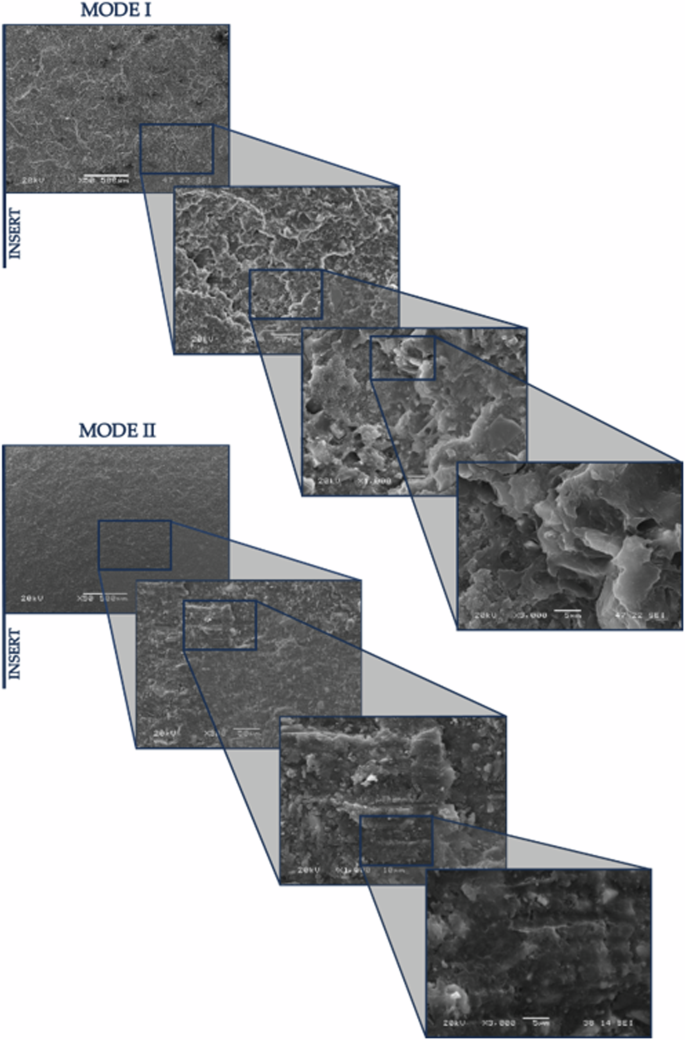
Mode I and Mode II fracture surfaces, 12WESE at various magnifications (50×, 300×, 1000×, and 3000×).
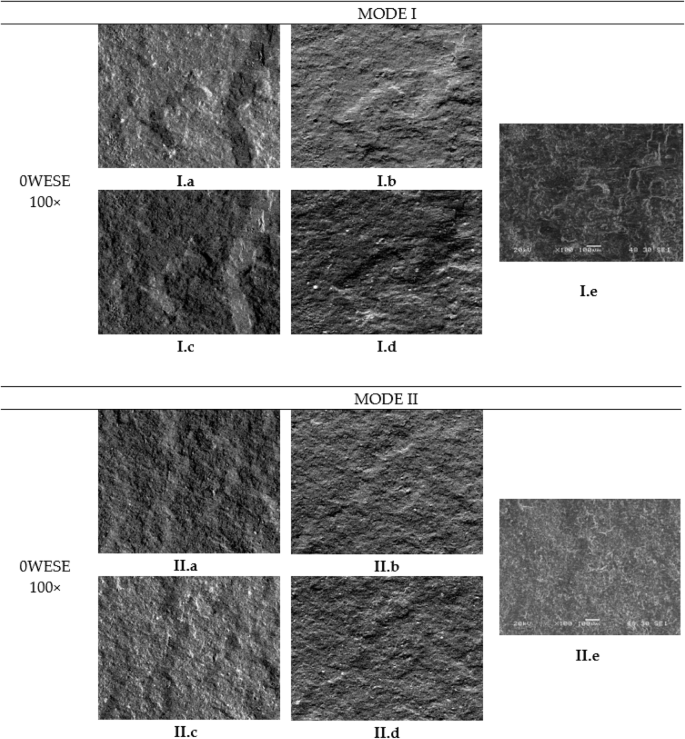
In addition to the previously mentioned observations, it can be noted that in Mode I, across all exposure periods, there are small areas of adhesive failure. However, in Mode II, this type of failure has not occurred in any of the analysed specimens.
In terms of differences between the fracture surfaces of the various specimens analyzed for the same mode of fracture but different exposure periods, it can be observed that in Mode I (Fig. 8a, c and e), as the weeks progress, the adhesive generally breaks down into smaller pieces, creating certain impurities that appear as smaller grains in the images due to degradation. With one week of exposure, the edges of the adhesive become more plasticized, becoming more pronounced after 12 weeks of exposure. There is also a greater similarity between the surfaces exposed for one week and twelve weeks compared to those unexposed.
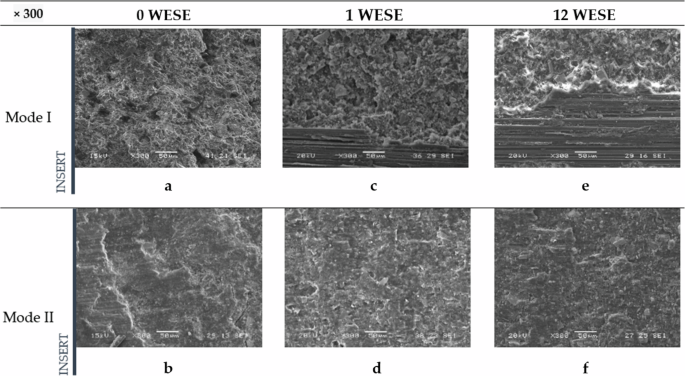
Including unexposed (a, b), exposed for 1 week (c, d) and exposed for 12 weeks (e, f).
Analysing the differences between the various periods of exposure in Mode II, the images reveal a flatter adhesive surface in the image of unexposed specimen (Fig. 8b), presenting a plasticization effect of the adhesive accompanied by lines in the direction of the shear movement characteristic of Mode II, and sometimes with perpendicular cracks. The specimens exposed for one week (Fig. 8d) follow the same trend, though the flatness is less pronounced. The most significant change is observed in the 12-week-exposed surfaces (Fig. 8f), which show an “adhesive” appearance, with a lower degree of plasticity and a higher number of impurities. Furthermore, the lines caused by fatigue are closer together in the unexposed specimen and are more clearly visible, as the adhesive is not affected by any type of degradation and provides more resistance to crack progression, whereas in the other two cases, the degradation of the adhesive obscures the crack front.
Furthermore, due to the brittleness and degradation of the adhesive, the flatness of the analysed specimens increases, thus decreasing the overall thickness dimensions as the period of saline exposure increases. In Mode I, this flattening is gradual; the greater the exposure time, the thinner the specimen becomes. In Mode II, this reduction in thickness seems to occur at the moment of exposure to such an environment.
Chemical analysis
The chemical analyses carried out, as well as the degradation analysis, show significant differences across the width of the specimen and for the different exposure periods.
For the chemical analysis, conducted with SEM, significant differences are observed, mainly in the concentration of Chlorine (Cl) and Sodium (Na), depending on two factors: the area of the sample and the exposure period to the saline environment. Table 2 shows the chemical elements, in percentage terms, found in the different positions studied in specimens 0WESE, 1WESE, and 12WESE.
The table shows the chemical composition of the specimens 0WESE, 1WESE, and 12WESE at different positions (Crack Tip, Lateral, and Interior) regarding various chemical elements. As can be observed, the most significant differences are evident in the columns corresponding to Na and Cl. These two elements are not present at the initial stage, but their presence increases with longer exposure time. The presence of Na is greater due to the smaller atomic size, which facilitates its diffusion through the adhesive matrix. This indicates that exposure time to the saline environment contributes to the accumulation of Na. Although chlorine is not present in 0WESE, a notable concentration is recorded in 1WESE (3.47% in the interior position) and 12WESE (4.10% in the lateral position). This suggests that Cl originates from the saline environment and accumulates over time. Overall, there is an increase in the concentration of Na and Cl as the exposure time to saline environments increases (from 0WESE to 12WESE). The positions closest to the saline environment (Crack Tip and Lateral) show higher concentrations of Na and Cl compared to the interior position. This highlights the importance of location in the degradation and the diffusion of elements in the adhesive.
The analysis of Silicon (Si) content across different exposure periods (0WESE, 1WESE, and 12WESE) reveals significant differences among the positions: Crack Tip, Lateral, and Interior. In the initial period (0WESE), the Interior position has the highest silicon concentration at 3.43%, followed by the Lateral position at 1.41%, and the Crack Tip at 0.99%. This indicates that the Interior is less affected by the saline environment due to its lack of exposure. In the first exposure period (1WESE), silicon levels decrease in the exposed positions, with the Crack Tip showing a low concentration of 0.42% and the Lateral at 0.29%. In contrast, the Interior remains relatively stable with a silicon content of 3.47%. By the final exposure period (12WESE), the silicon content in the Crack Tip increases to 1.78%, while the Lateral position rises to 2.47%. The Interior also experiences an increase, reaching 4.10%. This suggests that while the exposed positions show variability, there is a potential reaction or accumulation of silicon in all positions over time.
For the degradation analysis of the adhesive the FTIR-ATR technique was used. Measurements were taken in the same positions where the chemical analysis of the elements was conducted. In all cases, a characteristic peak around a wavenumber of 1720 cm−¹ is observed, indicating the presence of carbonyls groups (C = O bonds), which are indicative of oxidation in the adhesive.
Figure 9 displays the results for 0WESE, where a slight change in the band structure corresponding to the Lateral position can be observed, suggesting minor degradation in that area.
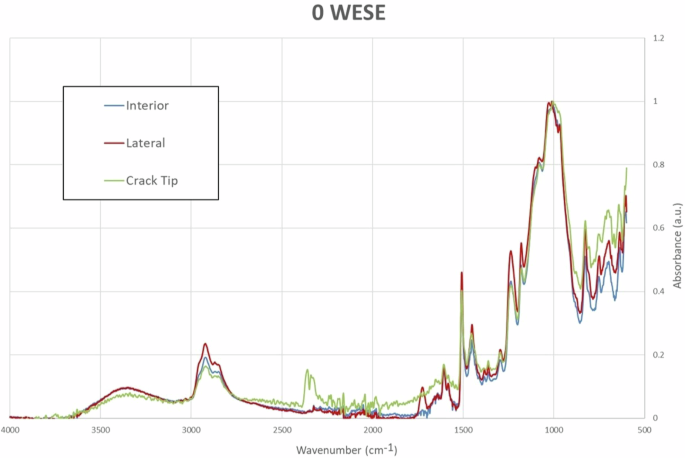
ATR-FTIR curves at different positions without exposure to salt mist.
In Fig. 10, the results for one week in a saline environment (1WESE) are presented. Under these conditions, a greater presence of carbonyls is observed at the Crack Tip and the Lateral position, with values in these two areas being almost identical. In the Interior zone, which is farther from the environmental conditions, it is noted that the adhesive has not been affected by oxidation.
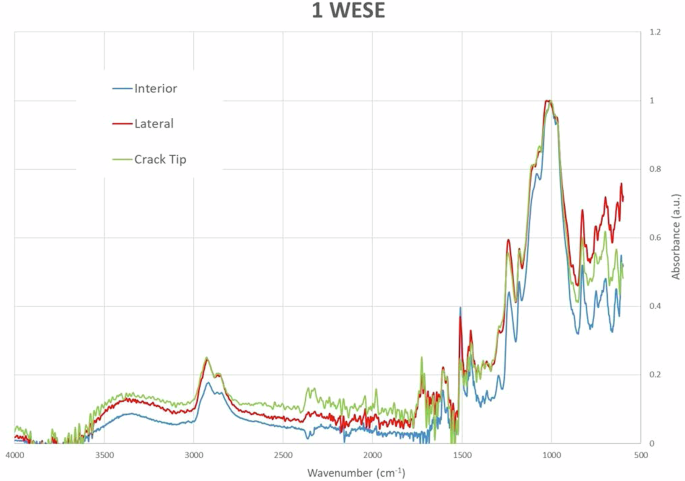
ATR-FTIR curves at different positions with one week of exposure to salt mist.
In Fig. 11, the results for 12WESE show a presence of carbonyls is observed at the Lateral position and the Crack Tip, while there is an absence of carbonyls in the Interior position, similar to the findings in 1WESE.
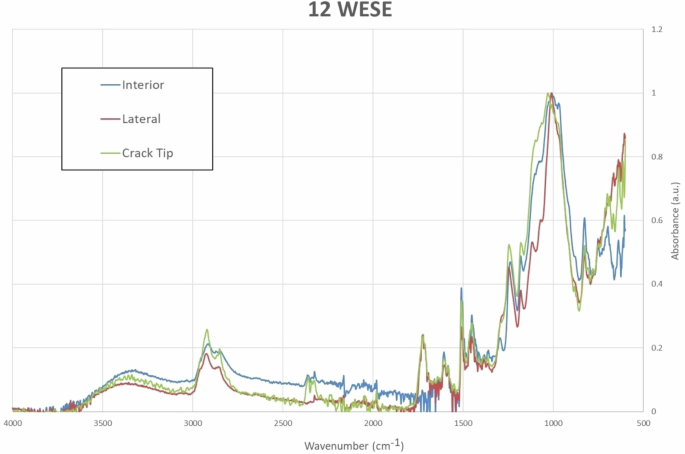
ATR-FTIR curves at different positions with twelve weeks of exposure to salt mist.
All these results show significant insights into the degradation behaviour of the epoxy-based adhesive under saline exposure. Throughout the different exposure periods (0WESE, 1WESE, and 12WESE) there is a clear correlation between the duration of exposure to salt mist and the extent of oxidative degradation, as evidenced by the presence of carbonyl groups in the spectra.
In the initial exposure period (0WESE), the adhesive shows minimal signs of oxidation, with the characteristic carbonyl peak being less pronounced. This suggests that, at this stage, the adhesive is relatively stable and less affected by environmental factors. However, as exposure time increases to one week (1WESE), the presence of carbonyls becomes more important, particularly in the Crack Tip and Lateral positions. This indicates that these areas are more susceptible to environmental degradation. By the final exposure period (12WESE), the ATR-FTIR analysis reveals a further increase in carbonyl presence at both the Crack Tip and Lateral positions. The band structure shows significant changes, indicating substantial oxidation of the adhesive. In contrast, the Interior position still shows minimal signs of carbonyl formation.
Experimental methodology
This section outlines the key procedures conducted to observe the fracture surface of adhesive joints in selected composite materials under static and dynamic loading conditions in fracture modes I and II, after varying exposure periods in a saline environment. The methodology covers several essential steps, starting with the selection of materials and surface preparation. It then addresses mechanical characterization, three-dimensional surface reconstruction, and an analysis of the adhesive to understand its behavior under 0, 1, and 12 weeks of exposure to a saline environment.
Materials
The following description covers the materials used in this study, including the composite material used as the substrate and the type of adhesive employed.
The specimens are manufactured by bonding two elements with adhesive, each measuring 225 × 20 × 2.1 mm. These adherents are extracted from sheets of epoxy material with unidirectional carbon fibers oriented longitudinally, commercially known as MTC510-UD300-HS-33% RW. The sheets are produced through vacuum molding using a process similar to some industrial methods, following a thermal curing cycle recommended by the manufacturer as follows: during the initial hour, the temperature was gradually increased from ambient levels to between 100 °C and 120 °C. This temperature was held for three and a half hours before being raised from 100 °C at a rate of 40 °C per hour. After maintaining this elevated temperature for an additional hour, the material was left in the oven until it cooled back down to ambient temperature.
Once the two elements to be bonded are machined, a 12 µm thick polytetrafluoro-ethylene (PTFE) insert is placed on the surface of one of them along the first 60 mm, preventing the bonding of the two elements over these initial millimetres of the specimen. The two elements to be bonded are sanded, carefully cleaned, and then Loctite® EA 9461 epoxy adhesive is applied so that the two elements are bonded over the final 165 mm, as shown in Fig. 12.
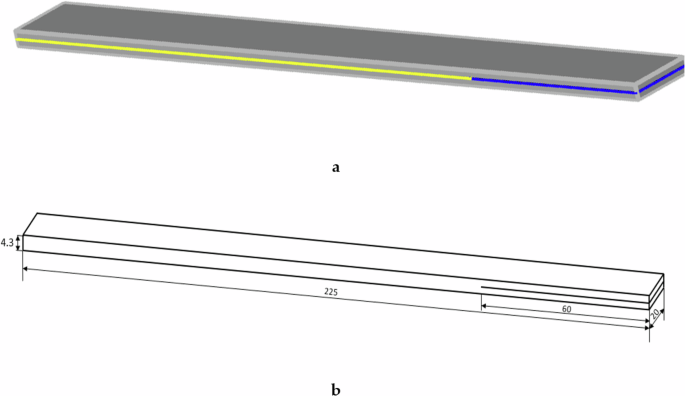
a two adherents elements (grey), adhesive (yellow), PTFE-film insert (blue); b specimen measurements in mm.
The properties of the adhesive can be seen in Table 3. Once the work on the specimen is completed, the final dimensions are 225 mm length, 20 mm width, and 4.3 mm thickness, with a tolerance of ±0.1 mm.
After the adhesive is applied, the recommended curing cycle by the manufacturer is followed. Once curing is complete, the PTFE insert is removed. Then, the lateral edges of the specimen, where adhesive bridges can form, are then meticulously machined using a milling machine to ensure any excess adhesive is removed from these critical areas.
Surface preparation
The composite material used as a substrate was manually sanded with Al2O3 sandpaper at a P220 grit. Then, the surface of the composite, was cleaned and degreased, to prepare for the subsequent bonding process.
Environmental degradation processes
The objective in studying environmental degradation was to assess the quality of the adhesive bond after exposure to various external agents such as moisture, temperature, and salt concentration.
To simulate an accelerated aging environment in saline conditions, a Köheler salt spray chamber, model DCTC 1200 P, was used according with ASTM B117-1144. The chamber maintained an average temperature of 35 °C ± 2 °C. The saline mixture was concocted by combining five parts NaCl, with impurities under 0.3%, with 95 parts demineralized distilled water. The resulting solution had a density range from 1.0255 to 1.0400 g/cm^3 and a pH ranging from 6.5 to 7.2. Additional conditions, such as a relative humidity of 89% and an air pressure of 1.2 bars, were chosen to closely replicate the natural atmospheric conditions.
Upon concluding the exposure process in saline environment, the specimens were removed from the chamber and their surfaces were cleaned to remove any remaining saline residues. The exposure durations within the salt spray chamber were established at 1 and 12 weeks, adhering to the conditions previously mentioned.
Previous tests45 determined the diffusivity of the adhesive at 6.54 × 10⁻⁷ mm2/s and a saturation time of 1.59 × 10⁷ s/mm, or 184 days/mm. In comparison, the values for the epoxy-fiber composite are 6.36 × 10⁷ s/mm or 736 days/mm. This indicates that moisture will penetrate through the adhesive faster than through the composite material. However, given the dimensions and exposure times used, it can be assured that saturation has only been reached in a small area of the adhesive.
The factors evaluated in these tests include the exposure period, temperature, humidity, and the presence of a saline environment. The influence of these factors is related to phenomena such as diffusion, although their effect varies depending on the nature of the adhesive and the composite material of the substrate.
Mechanical characterization
The characterization of the material was designed to analyze its behaviour in response to delamination for the studied Mode I and Mode II fractures. To understand the behaviour of adhesive joints depending on the mode of fracture applied, different standards and formulations are used. For Mode I, tests were conducted using the methodology outlined in ASTM-2146 .This involved using piano hinges to apply the load perpendicular to the crack propagation in the specimen, conducting static and fatigue tests with Double Cantilever Beam (DCB) specimens. From the various formulations suggested by this standard to determine the Energy Release Rate (ERR) in Mode I fracture (GIC), the Modified Beam Theory (MBT) was employed, as expressed in Eq. (1):
Where b is the width of the specimen, P is the applied load, δ is the displacement at the load application point, a is the length of the crack delamination, and Δ is a correction factor determined by the flexibility and length of the crack.
For Mode II, the ERR was determined using End Notch Flexure (ENF) specimens in a three-point bending test to measure shear stress, following the procedure outlined in ASTM D7905/D7905M-19e147 determine the ERR for Mode II (GIIC), experimental calibration of flexibility was used as defined by the formula in Eq. (2):
where B represents the width of the specimen, and Pmax denotes the maximum applied load. The term a0 refers to the initial crack length, and m is a function of the flexibility of the specimen. This flexibility is experimentally determined by loading and unloading within the elastic zone. During this process, load and displacement values are recorded at various positions along the crack front relative to the nearest support. The value of m, indicating the flexibility of the specimen, is determined based on the slopes obtained.
3D reconstruction of the surface
A Scanning Electron Microscope (SEM) used was a JEOL-JSM5600 model. To achieve a more detailed understanding, a three-dimensional reconstruction of the specimen surfaces is conducted after fatigue testing. The obtained topography allows for the quantification of surface characteristics such as step height, volume, angles, and flatness48.
There are two approaches to the three-dimensional reconstruction of surface features called stereophotogrammetry. One involves capturing two SEM images of the same object from different angles, as shown in Fig. 13a. The 3D representation is achieved by calculating a topographic map from the reconstruction, creating a distorted 3D mesh from this topographic model, and overlaying the SEM image. The only drawbacks of this method are that the SEM must allow for the tilting of the sample and the capture of two successive images of it.
a Placed directly over the sample; b Four-quadrant detectors.
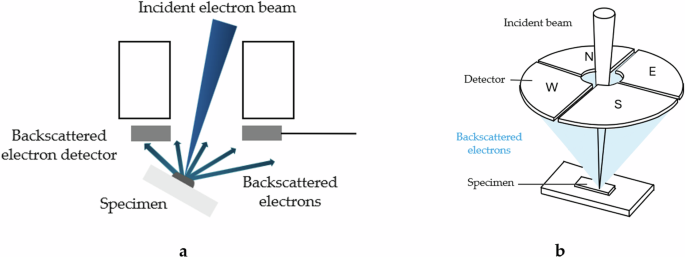
However, there is an additional method for performing the reconstruction and revealing the dimension representing height, which requires a segmented airborne backscattered electron (BSE) detector (see Fig. 13). In the presented work, this method is employed to perform reconstructions and reveal the height dimension.
This methodology utilizes symmetrically arranged detector pairs above the sample, capturing differential signals from the North-South and East-West pairs, as illustrated in Fig. 13b. These signals neutralize reflectance, thus enabling the accurate calculation of local slopes. Each detector pair determines the slope in its respective direction, distinguishing darker areas from slopes and facilitating the precise computation of the slope.
The intensity of the backscattered electrons captured by each detector translates into contrast levels that reveal topographic and structural features of the specimen, such as changes in height, surface texture, and composition variations. By gathering data from multiple viewpoints, three-dimensional topographic images are generated.
Once the height map is obtained, the height value of each pixel is known. A visual representation is then created by applying 3D rendering algorithms. This combination of information from all four detectors, each capturing signals from different angles, facilitates the reconstruction of a topographic image that displays three-dimensional details of the specimen’s surface. This enables the observation of phenomena such as the progression of fatigue cracks, the relief of the adhesive at the break, and the differences between two modes.
Analysis of the adhesive
Chemical analysis of the fracture surface were conducted with two objectives: to verify the presence of Chlorine and Sodium in the aged specimens and to check for oxidation and Si-O bonds. To carry out these analyses, different areas along the width of the fracture surface were studied. In the first case, to assess the presence of Cl and Na, among others, the SEM equipment previously used for the three-dimensional reconstruction of the fracture surface was utilized, while FTIR-ATR was employed to examine oxidation and Si-O bonds.
Samples of the adhesive were taken across the width on the fracture Surface: in Lateral, Interior and Crack Tip zones, as can be shown in Fig. 14.
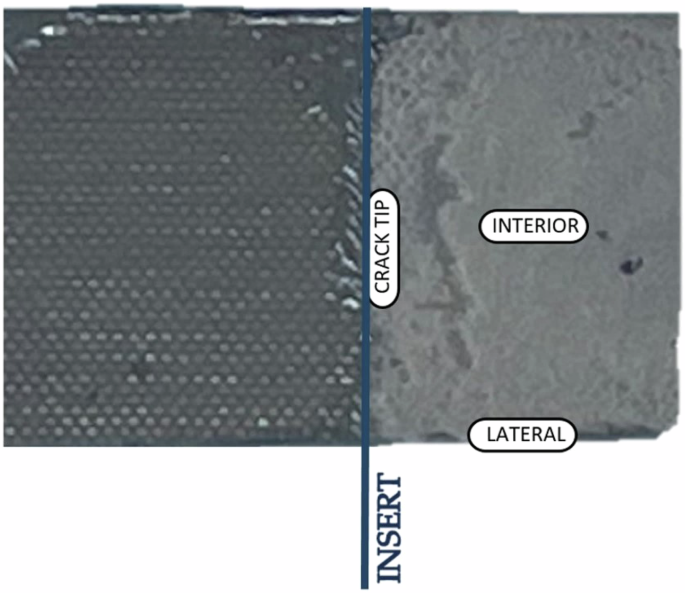
Location of the samples for chemical analysis.
The chemical analysis of the epoxy-based adhesive tested was performed using the same Scanning Electron Microscope (SEM) employed for 3D surface reconstruction. For this purpose, the microscope was equipped with an EDX (Energy Dispersive X-ray Spectroscopy) detector module; model INCA ENERGY 200, from Oxford Instruments. This module allowed for detailed elemental analysis of the adhesive, providing information on the chemical composition of the samples.
Measurements were carried out with an acceleration voltage of 20 kV and a working distance of 20 mm, which allowed for high-resolution imaging and spectral data useful in identifying the distribution of chemical elements of the surface of the adhesive. The aim of this study is to identify changes in the chemical composition of the adhesive after different periods of exposure to the salt mist and in the different areas from which samples were taken (see Fig. 14). These possible changes in composition would demonstrate the aging in saline environments on the chemical structure of the epoxy-based adhesive.
Fourier-Transform Infrared Spectroscopy with Attenuated Total Reflectance (FTIR-ATR) was used to identify chemical and structural changes in the adhesives present on the fracture surface. Measurements were conducted using a Varian 670-IR FTIR spectrometer. A spectral resolution of 2 cm–¹ was employed in the range of 2000 cm–¹ and lower frequencies, allowing for high precision in detecting changes in vibrational bands. Each spectrum was obtained from 32 scans per sample, ensuring a good signal-to-noise ratio. This could serve for the identification of key functional groups, to assess the aging effects in different areas of the analyzed specimens and across the different periods of exposure.
Responses