Design and evaluations of nano-ceramic electrolytes used for solid-state lithium battery
Introduction
Sustainable energy served as a pivotal bridge between the energy requirements of the past and the promise of a cleaner, healthier environment by reducing carbon dioxide emissions. All-solid-state lithium metal batteries are particularly promising because they leverage the high theoretical capacity of the Li-metal anode, which has been cited for providing capacities as high as 3860 mAh g−1 in the context of energy storage systems. This capacity remains consistent across multiple cathode chemistries, underscoring the critical importance of the anode capacity in achieving high-density energy storage1,2. The objective was to transition towards a low-carbon economy, mitigating greenhouse gases and other pollutants3. In its various forms, energy could be stored in materials, which released this stored energy upon undergoing specific reactions4. The magnitude of energy released was contingent on responses, such as Bioenergy, chemical & electrochemical, solar & wind, and nuclear energy (Fig. 1a). Bioenergy from anaerobic and anaerobic organisms is stored chemical energy from macromolecules that are released5. At the same time, photovoltaics convert sunlight into electricity6, and wind energy highlights the conversion of kinetic and potential motion into electricity via turbines7. The energy density by mass or volume is a metric that can be used to compare the efficiency of these power generation systems8,9, noting that nuclear energy provides the highest energy density by mass due to the inherent efficiency of fissionable processes at the cost of radioactive precursors10,11. The maximum net energy (exergy) can be used at the device level to evaluate the efficiency and sustainability of energy systems12. The “levelized cost of energy” is a benchmark for comparing the financial aspects of energy generation across diverse systems13, considering geographical locations14, materials expenditures15, and system lifespan16. On a device level, energy density holds paramount importance due to its centrality in guiding the experimental design of materials and conversion efficiency of storage systems17, aiming to transition this parameter into the “upper fourth quadrant” of the Ragone plot. Enhancing energy density is a key strategy for expanding system storage capacity18. Systems with high energy density, such as Battery Energy Storage Systems (BESS), can meet large-scale and intensive energy demands19. BESS is integral in coupling green energy sources with electricity needs and plays a significant role in transitioning from fossil fuels to renewable sources20,21. The high energy density Lithium-ion batteries (LIBs) are one of the major storage solutions for large-scale applications22,23, providing consistent renewable energy supply to electricity grids (Fig. 1b). The LIBs store chemical energy and transform it into electrical energy spontaneously24,25. The chemical reactions in a battery involve the movement of electrons from one electrode to another through an external circuit and ion transport through an electrolyte26,27. Traditional LIBs employing liquid electrolytes have the disadvantage of explosion or fire hazards due to converting lithium carbonate to CO2 or in moist air to H228,29. Solid-state electrolytes (SSEs) can effectively mitigate these challenges, further enhancing safety and providing energy densities equal to or superior to the existing solutions30,31.
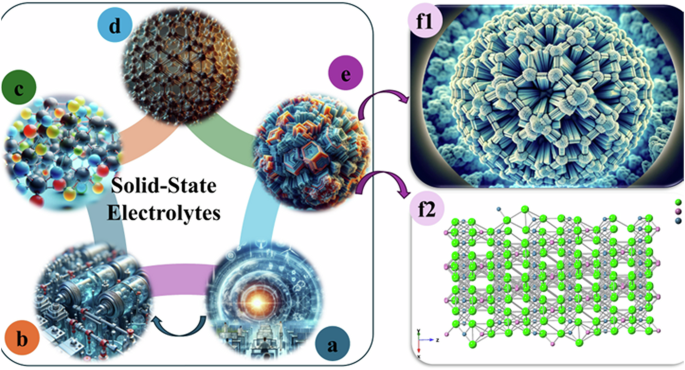
a A summary of sustainable energy resources; b a diagram of a high-energy-density battery; c polymer-based solid electrolytes; d metal-organic frameworks electrolyte; e ceramic electrolytes; and f a conceptual schematic diagram (f1) of halide-based electrolytes and Li3InCl6 crystalline phase (f2).
Due to their dual roles as ionic conductors and electron insulators, solid-state electrolytes (SSEs) are key to replacing the liquid electrolytes commonly used in LIBs32,33. They offer several advantages: enhanced safety, absence of harmful organic solvents, low flammability, mechanical stability, and the potential for high energy density34,35. Extensive research has been conducted on various types of solid electrolytes, including polymers36 (Fig. 1c), metal-organic frameworks37 (Fig. 1d), ceramics38 (Fig. 1e), and others39,40,41. The chemical reactions on the electrodes’ surface and ion transport through the electrolytes influence the battery’s performance, energy storage, and voltage. Lithium halide electrolytes42,43, with a general formula of Li3MX6 (where M = In and Y, M3+, and X = Cl, Br, I), have attracted significant interest from researchers, resulting in numerous publications44,45,46. Their wide electrochemical window and compatibility with common oxide cathode materials make them suitable for practical applications47. This research team is focused on increasing the energy density of the system, with an emphasis on developing halide electrolytes with superionic conductivity (Fig. 1f). Within crystalline matrices, doped halide SSEs were evidenced to facilitate lithium-ion (Li+) transport as superconductors. The team has developed four different formulations of doped Li3InCl6-based electrolytes that enable fast Li+ conduction and exhibit high inherent electrochemical oxidation stability48,49. This work’s significance lies in producing ceramic electrolytes demonstrating superionic conductivity and maintaining high stability during half-cell evaluation.
Materials and methods
To generate systems with high energy density, our team has been focused on materials design and lab automation to produce a series of interactive solid-state materials that hold the potential to enhance the performance of the LIB system. These interactive crystalline electrolytes were doped through A and B sites to amplify ion transport pathways with required porosity and interfaces. By manipulating the synthesis variables through orthogonal design, the team aims to promote chemical amphiphilic interactions between various reactants at atomic and molecular scales to generate tunable pore structures and optimal transport mechanisms. The synthesis variables are optimized based on the empirical data to create the designed halide SSEs and assembled half-cells. This perspective presents a nanoemulsion to engineer a series of superionic conductors comprising lithium (Li), indium (In), and chlorine (Cl), doped by fluoride (F), molybdenum (Mo), and cerium (Ce) to optimize ionic transport and minimize interfacial resistances.
Synthesis of solid-state electrolytes
The modified nanoemulsion technique, termed “in situ nanoengineering,” has been devised to generate a series of Li3InCl6-based ceramic electrolytes whose fine structures and electrochemical properties were systematically optimized. The starting materials include LiCl, LiF, InCl3, Ce(NO3)x (x = 3, 4), MoCly (y = 3,5), and these chemicals were used as purchased. This in situ nanoengineering is thermodynamically pseudo-stable and isotropic, involving an aqueous solution (water phase) with aloe vera extract (e.g., Aloin, C21H22O9 as oil phase) to manage interfaces of the micelles and prevent the agglomeration of nano electrolytes (Fig. 2a). The mature aloe vera plant was selected for its notable environmental benign and eco-friendly properties. The plant’s chemical complexity includes over 75 active compounds, such as aloe-emodin, Aloin, aloesin, emodin, and acemannan50. Among these, Aloin is a standout compound51, playing a vital role in the green synthesis of halide SSEs. This wet-chemistry synthesis adheres to the twelve Principles of Green Chemistry52,53 with high energy usage and safe chemicals. The in situ nanoengineering method, employing water as a solvent and Aloin as a dispersing agent, represents a sustainable, cost-effective, and eco-friendly approach. Aloin is a reducing, stabilizing, or capping agent during nanoparticle synthesis54.
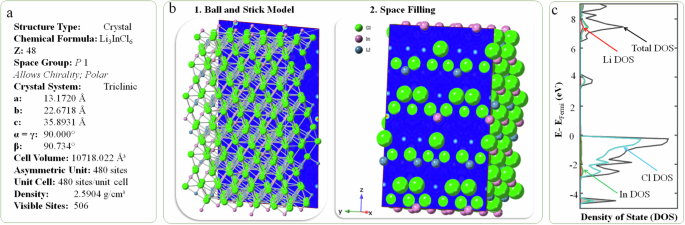
a Crystal information of the non-doped Li3InCl6 with 506 visible sites; b the electron density calculation uses CrystalMaker; and c the calculated density of state.
Additionally, considerations for the end-of-life of batteries are integral to using these materials, ensuring a comprehensive lifecycle assessment, and promoting responsible resource management. We explored an experimental design involving four variables, each in five distinct settings, to examine all potential combinations of synthesis variables for their optimization. A factorial experiment would require 54 = 625 individual experiments to cover all possibilities. We employed a Taguchi orthogonal array to optimize resource utilization and efficiency55. Typically, an L25(54) orthogonal array has been utilized, significantly reducing the number of experimental runs. This approach allows for a systematic and balanced exploration of the experimental design space summarized in Table 1. The orthogonal array ensures that each factor’s effect is estimated independently from the other factors, facilitating a systematic and balanced design space exploration while minimizing the number of required runs. The commonly used four factors and five levels of orthogonal arrays were chosen, allowing for systematic exploration of factor effects while reducing the number of required experimental trials. Nevertheless, forty-eight experiments were carried out to extend the Taguchi orthogonal array to optimize the variables and achieve the highest ionic conductivity of Li3InCl6 SSEs. The team followed the “Twelve Principles of Green Chemistry Bookmark,” proposed by the U.S. Environmental Protection Agency (EPA) to promote the design of Li3InCl6 SSEs, further minimizing the utilization and generation of hazardous substances.
Assembly of half cells
The disk-shaped symmetrical LIB half-cells were assembled for their performance evaluation in mitigating the degradation of the electrolyte and circumventing electrochemical incompatibility between the Li3InCl6 electrolyte and the electrodes. Three blocking electrodes (comprising lithium strip, indium strip, and copper tape) were used to understand the electrode impact. The team devised a novel technique, the “Trilayered Approach (TLA),” which was instrumental in constructing the half-cell battery. Applying pressures in the 50–600 MPa range, with gradients of 50 and 100 MPa and a dwell time of 1 min, was pivotal to enhancing the cohesive interfacial attraction between the electrode (Li | Li, In | In, and Cu | Cu) and electrolytes. The mass of the Li3InCl6 electrolyte was meticulously controlled between 0.50–0.85 grams, adjusting its thickness, averaging 500–750 micrometers. In this study, the electrolyte disk’s diameter was precisely maintained at 5.44 mm. The annealing conditions for preparing Li3InCl6 ceramic electrolytes involved heating the synthesized electrolytes at 260 °C for 5 h under a vacuum. This step ensures high crystallinity and enhances the materials’ ionic conductivity56.
Structural characterization of solid-state electrolytes
The CrystalMaker X (CrystalMaker Software Limited, Oxford University Begbroke Science Park) was used to build rotatable, scalable animations for an in-depth understanding of structural behavior, lattice dynamics, spatial coordinates, chemical bonds, distance, and the trajectory of a simulation. The CrystalDiffract® and SingleCrystal™ suites were also employed individually to provide live structure, diffraction rotation, and recalculation through editing a structure in real-time at the atomistic level. This study evaluated the crystalline phase, tetragonality, and crystallite size of Li3InCl6 electrolytes based on the CIF data (mp-676109) derived from the Materials Project Open Access Database. The Laue diffractogram was collected using the following technical variables: wavelength between 0.5 to 5.0 Å as polarized radiation, spot size of 0.02 mm, saturation at 100%, and a gamma factor 2.0. The camera length was controlled at 0.03 m, the sample thickness was 100 Å, and the volume fraction was assumed to be significant.
Electrochemical evaluation of half cell
The electrochemical impedance (0.01–105 Hz) was collected using an electrochemical workstation Solartron 1287 (AMETEK Scientific Instruments) with an applied amplitude of 10 mV, measuring 10 points per decade, under different operational temperatures, ranging from 15–55 °C with an increase of 10 °C gradient. The stable and accurate potential control range is ±10 V, and the current range is ±250 mA. The systems were verified to reproduce representative data within less than 1%. The ionic conductivity was calculated using the same facility with integrated fitting software functions for the impedance analyses, allowing for electrochemical mechanistic studies. The assembled lithium-ion battery (LIB) half cells were connected to the above workstation using platinum as an electricity conductor under direct electrical current provided by Amperometric i–t Curve mode. The different applied voltages were controlled at 0.2 and 1.8 V, respectively. Under the temperatures, an increase in circuit resistance was observed, which was attributed to the deterioration of the cell half. The electrochemical impedance spectroscopy (EIS) experiment, corroborated by cyclic voltammetry (CV), was implemented to evaluate the doping effects of the elements of fluoride (F) and molybdenum (Mo).
Results
Electron density calculations
The Li3InCl6 crystallizes into a monoclinic structure (space group C2), with lattice variables depicted in Fig. 2a. The crystal lattice comprises interconnected LiCl6 and InCl6 octahedra. Each LiCl6 octahedron shares corners with two InCl6 octahedra and edges with an additional two InCl6 octahedra. They share edges with six other LiCl6 octahedra. This configuration forms a three-dimensional network of interconnected octahedra. Empirical data confirm that this halide family exhibits high stability in ambient air and demonstrates enhanced ionic conductivity (an improvement of two orders of magnitude compared to previously published data) after being heated at 200–300 °C for 2 h. The calculated bulk crystalline density of primitive Li3InCl6 is approximately 2.59 g cm−3, with a band gap of 3.375 eV.
The electron density distribution of Li3InCl6 electrolytes represents the probabilistic spatial distribution of electrons surrounding the constituent atoms, namely Li, In, and Cl. This distribution provides insights into ion transport, electron insertion, bonding configurations, and electrochemical attributes. The Li3InCl6 triclinic unit, characterized by its coordination space, houses eight non-equivalent Li+ sites within its crystalline matrices. These sites, distinguished by their lower ionization potential and energy gap, facilitate electron excitation or translocation of electron density, thereby influencing ion transport pathways. The presence of eighteen non-equivalent chlorine and four non-equivalent indium sites further orchestrated the trajectory for ion transport, resulting in electron density contours above and below the triclinic plane, as visualized in our ball-and-stick (Fig. 2b1) and space-filling models (Fig. 2b2). This configuration can be fine-tuned by selectively doping nonmetal or metal elements at the interface of the triclinic planes or near the Li-ion. At the molecular orbital level, this doping results in electron excitation from the Li to Cl or In element, yielding distinct localized electron densities from a high-occupied molecular orbital (HOMO) to a low-unoccupied molecular orbital (LUMO) state. Within the triclinic space, the four non-equivalent In3+ sites form InCl₆ octahedra that share vertices and edges with LiCl₆ octahedra. The vertex-sharing octahedral tilt angles, where α/γ ≠ β, range from 2–9°, with a dispersion of In–Cl bond distances extending from 2.52–2.58 Å, further modifying the electron contour maps. From the space model (Fig. 2b2), a topological electron density is apparent between the planes from the eighteen non-equivalent Cl⁻ sites, each bond in a see-saw (C2v) geometry to three Li+ and one In3+ cations. Within the Li3InCl6 electrolyte are eighteen non-equivalent chloride ion (Cl⁻) sites that exhibit a see-saw-like geometry, forming a bond with three lithium ions (Li⁺) and one indium ion (In³⁺). This bonding configuration is consistent across all Cl⁻ sites and crystalline electrolytes. The electron density contour map reveals the regions of high electron density, typically found between the bonded atoms, indicating the probable locations of shared electron pairs. These electron pairs and shared electrons constitute the degree of covalency, which can be used for visualizing the likely pathways for ion transport, which is critical in atom engineering superionic conductors. The space-filling model also represents the atomic sizes of constituent atoms and their relative positions.
Introducing F, Mo, and Ce dopants into Li3InCl6 is expected to induce modifications in the electron density distribution, attributable to the unique atomic properties of these dopants relative to Cl, In, and Li. Fluorine, with its smaller atomic radius and higher electronegativity, would define the electron density contours around the F atoms. Molybdenum would introduce new energy levels within the band gap of Li3InCl6 due to its multiple accessible oxidation states, thereby influencing the electron density and increasing the electrolyte’s ionic conductivity. Cerium would also introduce new energy levels within the band gap. However, the density of states would be different due to their oxidation states (+4, +3) and available d- and f-orbitals and outermost electrons. These alterations would consequently affect the tilt angle, bond lengths, and degree of covalency within the lattice, thereby creating a lower energy path for ion transport and enhancing the electrolytes’ ionic conductivity. The transition metal dopants, with their available d and f orbitals, could accommodate more delocalized electrons, altering the density of states compared to pristine Li3InCl6 (Fig. 2c), thereby facilitating cation transport channels. These modifications collectively optimize the electrolyte’s performance by tailoring its electronic structure and enhancing its ionic conductivity.
Crystalline phases and morphology analyses
The powdered X-ray diffraction (PXRD) patterns of the Li3InCl6 electrolytes (Fig. 3a) were computed using the CrystalMaker X software suite based on the CIF data (mp-676109) derived from the Materials Project Open Access Database. The crystallographic structure of Li3InCl6 is triclinic (P1 space group) with lattice parameters calculated to be a = b = 13.1102 Å, c = 35.8931 Å, α = β = 89.631°, γ = 119.688°, and a cell volume of 5359.011 ų. In this modeling, the sub-building group comprised 240 asymmetric sites per unit cell, while the total visible sites were calculated as 244. In the Li3InCl6 structure, each Li+ ion is coordinated to six inequivalent Cl− ions to form LiCl6 octahedra (to be demonstrated in Fig. 6c). These octahedra share corners and edges with other inequivalent InCl6 octahedra (also see Fig. 6d). The corner-sharing octahedral tilt angles are 0°. All Li-Cl bond lengths within the structure are 2.50 Å. Each chlorine is bonded with three lithium and one indium to form a see-saw geometry (also see Fig. 6e). This complex arrangement gives rise to peak splitting at different diffraction angles, resulting in lattice strain, point and stacking defeats, which can be exploited through doping to enhance ion transport within the lattice superstructure. These can be inferred from the d-spacing separation corresponding to the Miller indices. The Miller indices (hkl) for Li3InCl6 reflect the crystal plane orientation (Fig. 3b) at a specific diffraction angle, which can be represented using cylindrical, front, and back Laue pattern scattering analyses. The PXRD pattern arises due to the different environments occupied by Li, Cl, and In atoms within the unit cell. Each sub-building unit contributes to distinct electron density contours arising from the arrangement of octahedra to see-saw topography, leading to varied intensities in diffraction peaks. The most intense peak is observed at a 2θ value of approximately 33.5° and 33.9°, corresponding to the (118) and (1(bar{2})8) planes, respectively (Fig. 3c). The intensity for these facets indicates a significant electron density associated with these atomic planes. Peaks at lower angles, such as those corresponding to planes (006) and (1(bar{1})0), indicating larger interplanar spacings (dhkl), suggesting that these planes are associated with more prominent motifs or clusters within the crystal structure (Fig. 3d, e).
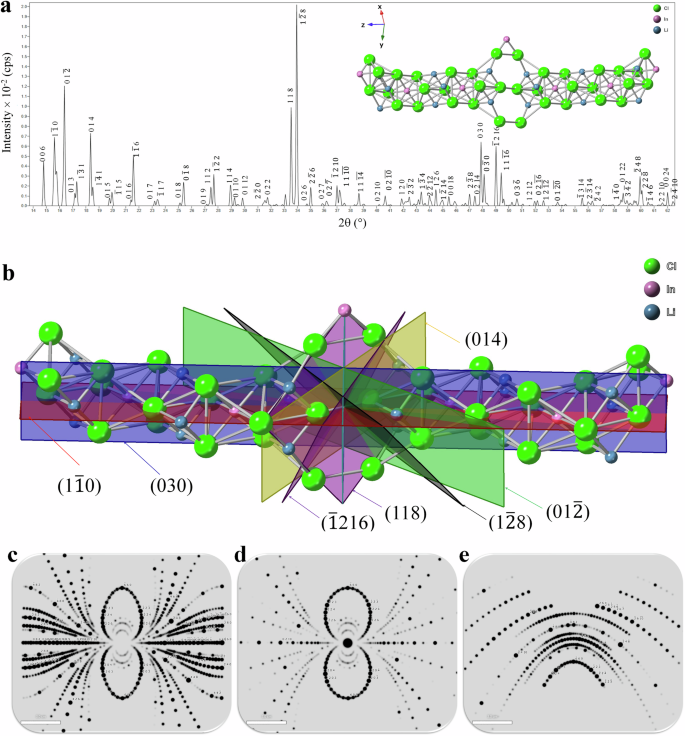
a The PXRD pattern of halide ceramic electrolytes (main) and ball-and-stick depiction of 1 × 1 × 2 dual cell units (insert), b the corresponding most intense diffraction assigned to hkl planes from (a) shown in a 3D plane rendering using CrystalMaker, and c the cylindrical Laue diffractogram scattering from [311] beam, d the front Laue diffractogram, and e the top Laue diffractogram is based on the Li3InCl6 2 × 2 × 2 supercell.
The Laue diffractogram (Fig. 3c–e) was collected complementary to the PXRD analyses. These Laue cylindrical (Fig. 3d), front (Fig. 3e), and top (Fig. 3f) scattering diffractograms (direction: 101) correspond to a specific set of Miller indices (hkl), which denote the orientation of various atomic planes within the crystal lattice. Each spot’s intensity indicates the electron density within the corresponding atomic plane. Analyzing the diffractogram involves identifying how each diffraction spot correlates with specific atomic planes within the triclinic lattice of Li3InCl6. Detailed information about the crystallographic parameters of Li3InCl6, including atomic positions, thermal factors, and occupancies, is obtained by interpreting these spots’ positions and intensities. Analysis of the cylindrical Laue (Fig. 3c) reveals the diffraction pattern, which shows a series of concentric circles and radial lines, suggesting a high degree of symmetry in the crystal structure. The planes within the circular patterns (118), (1(bar{2})8), and (006) represent distances in reciprocal space, which are inversely related to the spacings between atomic planes in the crystal. The analysis of Laue diffractograms from the front (Fig. 3d) and top scattering (Fig. 3e) confirmed that the angles of interaction between the crystal and the X-ray beam, marked at specific points such as 66° and 60°, correspond to the angles between certain atomic planes. This Laue modeling provides insights into the coordination space and the density of states, which are intimately related to the electronic properties crucial for directly probing the core and valence electrons through X-ray diffractive techniques.
Spectroscopic analyses
The X-ray Absorption Near Edge Structure (XANES) offers insights into the electronic structure of elements in halide electrolytes derived by nanoemulsion synthesis. XANES is sensitive to the oxidation state and coordination environment of the studied elements, namely Li, In, and Cl, thereby revealing the influence of their chemical environment on their electronic structure. Theoretical calculations, performed using the CASTEP pseudopotential density functional theory (DFT) code with the generalized gradient approximation approach of Perdew–Burke–Ernzerhof (GGA-PBE), were employed to obtain the XANES results of Li3InCl6. For lithium, the two edges at 58 eV and 62 eV likely correspond to multiple lithium inequivalent environments within the crystalline (Fig. 4a). The Li K-edge corresponding to 1s electrons, illustrates the changes in the electronic structure due to lithium’s interaction with Cl elements in the electrolyte. The indium environment within Li3InCl6 is more complex, featuring four non-equivalent In³⁺ sites. Despite this complexity, a single broad peak was observed at approximately 27,940 eV in the In XANES data due to the existence of four non-equivalent In³⁺ sites, each forming InCl₆ octahedra via bonding with one In³⁺ cation and six Cl¹⁻ anions (Fig. 4b). The L edges of Cl correspond to the 2p sub-shells, further divided into 2p₃/₂ and 2p₁/₂ manifolds due to spin-orbit coupling. This results in two edges in the XANES spectra (Fig. 4c), suggesting diverse lithium environments within the Li3InCl6 electrolyte, specifically eight inequivalent Li⁺ sites.
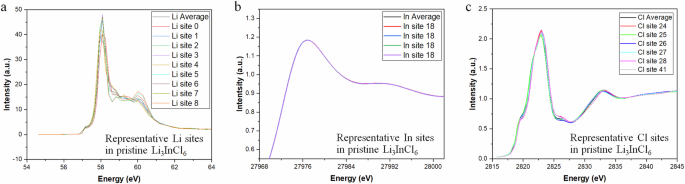
a The K-edge of Li, b the K-edge of In, and c the K-edge of Cl. The 3rd-order spline interpolations ranged over the intersection of the X-axis range of site spectra.
Structural analyses of the sub-building units reveal octahedra In sites that share corners with six LiCl₆ octahedra and edges with another six LiCl₆ octahedra, resulting in octahedral tilt angle variations from 2–9° and 2–10° and a spread of In–Cl bond distances ranging from 2.52–2.58 Å. The broadening of XANES absorption for In and the absence of distinct peaks can be attributed to several factors. These include multiple scattering events, the diverse chemical environment of indium within the electrolyte, and core-hole lifetime broadening due to multiple scattering of the core electron (e.g., 1s2) emission. The presence of four non-equivalent In³⁺ sites in Li3InCl6, each forming InCl₆ octahedra by bonding with six Cl⁻ atoms, creates a complex and diverse chemical environment for indium. This diversity can alter the multiple scattering pathways, leading to signal broadening. The absence of distinct absorption peaks could be due to the lack of spatial and temporal confinement of the electron from the core shells or holes.
The L edges of Cl, corresponding to the 2p sub-shells, are further divided into 2p₃/₂ and 2p₁/₂ manifolds due to spin-orbit coupling. This division results in two distinct edges in the XANES spectra, indicative of diverse lithium environments within the Li3InCl6 electrolyte, precisely eight non-equivalent Li⁺ sites. The Cl K-edge XANES (Fig. 4c) offers insights into the oxidation states and coordination environments of Li-Cl and In-Cl within the crystal structure of Li3InCl6. The degree of covalency can be assessed by probing the Cl 3p orbital local structure around In and Li. The XANES data of Cl displays three peaks at 2824, 2835, and 2845 eV, suggesting three different electronic transitions occurring within the chlorine atoms in the Li3InCl6 compound. The splitting of peaks can also result from spin-orbit coupling between the spatial distribution of an electron (orbit) and its intrinsic angular momentum (spin) interaction. The broadening of the peak at 2845 eV could be due to lifetime broadening, scattering events, and instrumental broadening. The electrolyte has eighteen non-equivalent Cl⁻ sites, each bonded to three Li⁺ and one In³⁺ cations, giving rise to a see-saw geometric configuration. These two factors related to bonding and geometry contributed to the ionic conductivity of the electrolyte, forming the basis of atom engineering, such as selective doping.
X-ray Photoelectron Spectroscopy (XPS) was employed to investigate the chemical states and environments within the Li3InCl6 structure, offering insights into the surface chemistry of ceramic electrolytes. A survey and elemental scan of the electrolyte revealed chemical bonding environment information (Fig. 5). These survey peaks (Fig. 5a) are influenced by electronic configurations and chemical bonding of three doped halide electrolytes. The spectra show the Li K line (1s) averaged at 54.7 eV (Fig. 5b, e), indicative of the lithium cation (Li+) oxidation state, to attain a stable configuration. Similarly, the In principle emissions were attributed to the M4 (3d3/2) and M5 (3d5/2) regions with average binding energies of 451.4 eV and 443.9 eV, respectively (Fig. 5c, f), corresponding to its oxidation state +3 with potential variations due to different chemical environments adjacent to the surrounding atoms. The Cl binding energies were measured at 197.0 eV for L2 (2p1/2) and 200 eV for L3 (2p3/2) (Fig. 5d, g), corresponding to its oxidation state of −1. Doping with F, Mo, and Ce was found to have minimal impact on the binding energy shift of Li, In, and Cl, aligning with X-ray powder diffraction results that show an intact crystalline structure. XPS analyses confirm the presence of Li+, In3+, and Cl− ions and their stoichiometry in the Li3InCl6 electrolytes. Impedance spectroscopy and cyclic voltammetry studies confirmed enhanced ion transport and stability due to doping while underscoring the importance of understanding the oxidation states and chemical environments for optimizing electrolyte properties in energy storage devices.
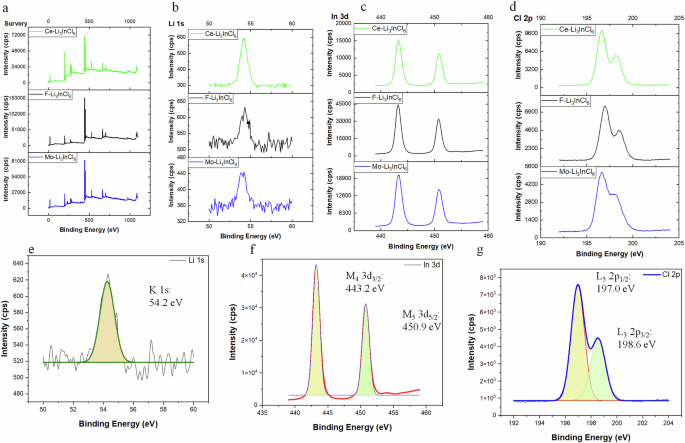
a The survey of the Mo, F. & Ce-doped Li3InCl6 electrolyte, b the Li element in three electrolytes, 1s (K line) analyses, c the In element in three electrolytes, 3d (M4 and M5 lines) analyses, 3d analysis, d the Cl element in three electrolytes, 2p (L2 and L3 lines) analyses, e The refinement of Li element in Li3InCl6 pristine electrolyte, f the refinement of In element in Li3InCl6 pristine electrolyte, and g the refinement of Cl element in Li3InCl6 pristine electrolyte.
Phase diagram and crystalline structure
The GGA/GGA + U (Mixed) method effectively combines the Generalized Gradient Approximation (GGA), which accounts for electronic density gradients, with the Hubbard U correction (GGA + U), addressing Coulomb interaction potential (U) in localized electron systems. This approach refines the prediction of formation enthalpies, which is crucial for materials with varying electronic states. The resulting phase diagram for the Li3InCl6 crystalline electrolyte is depicted as a triangular plot with vertices labeled A (Li atom, 0.3), B (In an atom, 0.1), and C (Cl atom, 0.6), stoichiometric occupancies are illustrated in Fig. 6a. The trinary plot incorporates various phases such as LiCl and InCl3, as the starting materials, in a stoichiometric molar ratio (3:1 = LiCl: InCl3). The limiting reagent was InCl3 with 1–5 mol% of LiCl in excess to facilitate the synthesis of the stabilized Li3InCl6 electrolyte. The color gradient in the convex hull in the phase diagram (Fig. 6a), spanning 0 to 0.15 eV atom−1, signifies the energy above the hull, suggesting the most thermodynamically stable phases from the lithium-indium-chloride trinary compositions relative to the metastable or unstable phases. The phase diagram shows lithium-indium-chloride compounds’ stability and compositional diversity under assorted conditions. This approach has guided our team in pinpointing stable phases and viable synthetic routes for diverse Li3InCl6 formulations. Notably, superionic conductivity in Li3InCl6 was attainable through precise stoichiometric molar ratios of 3:1 between LiCl and InCl3 reactants. While the phase diagram charts the compound’s potential phases across different environmental parameters, the stabilized Li3InCl6 phase emerges at an energy above hull ranging from 0.00 to 0.0325 eV atom−1. Figure 6a illustrates the equilibrium conditions among the phases, underscoring the stabilized Li3InCl6 phase. This trinary approach provides a more accurate prediction of formation enthalpies, particularly for compounds exhibiting localized and delocalized electronic states. By integrating these two computational models, the method enhances the reliability of phase diagrams for complex materials, such as the Li3InCl6 crystalline electrolyte, by offering an in-depth understanding of their thermodynamic stability and guiding the synthesis of new materials with desired properties.
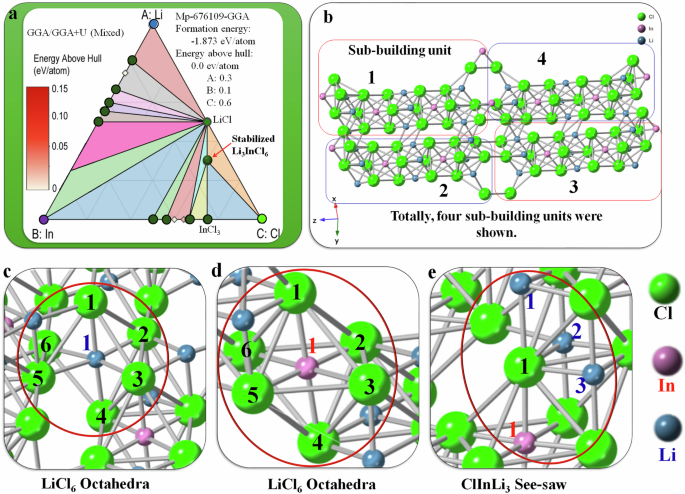
a The phase diagram showcases the formation of the stabilized Li3InCl6, and b the crystalline phase demonstrates the atomic linkage {Units 1–4} between different elements, showing the coordination around the c Li, d in that form a octahredra (1blue → 1-6black and/or 1red → 1-6black) geometry, and e sea-saw geometry around the chloride (1black→1red, 1black→1-3blue). The image was created using CrystalMaker X.
The final product, Li3InCl6, has a structure derived from corundum and belongs to the triclinic P1 space group (Fig. 6b, while the monoclinic C2 space group is also stable). There are eight different Li⁺ sites, where each Li⁺ site is bonded to six Cl⁻ atoms in a LiCl₆ octahedron (Fig. 6c) that shares corners and edges with other LiCl₆ and InCl₆ octahedra. The tilt angles between the corner-sharing octahedra vary from 2° to 10°, varying the Li–Cl bond lengths from 2.50 Å to 2.89 Å depending on thermodynamic phase and stoichiometry. Four different In³⁺ sites exist, where each In³⁺ site bonds with six chlorides to form an InCl₆ octahedron (Fig. 6d) that shares corners and edges with six LiCl₆ octahedra. The corner-sharing octahedral tilt angles vary from 2–10°. The first and second sites have In–Cl bond distances from 2.53–2.58 Å, while the third and fourth sites have two In–Cl bond lengths of 2.52 Å and four of 2.57 Å, depending on the geometrical axis. In the context of Cl, there are eighteen distinct Cl⁻ sites, each adopting a rectangular see-saw-like coordination geometry (Fig. 6e). This configuration involves central Cl element bonding to three Li⁺ and one In³⁺, creating a pair of opposite angles more significant than the other, providing a unique spatial distribution. The consistent coordination across all Cl⁻ sites is integral to the electrolytes’ electrochemical properties, influencing the ionic transport and stability within the solid-state battery. Furthermore, the arrangement of these polyhedra in the crystal lattice facilitates the interconnection between octahedra, which is pivotal for the structural integrity and function of the electrolyte.
Ionic conductivity evaluation
Electrochemical impedance spectroscopy (EIS) measurements on half-cells containing doped Li3InCl6 electrolytes, with indium as the blocking electrode, were conducted at 25 °C and 1 atm across a frequency range of 0.01 to 106 Hz. The impedance, a measure of the material’s resistance to electric current, was evaluated for pristine and doped electrolytes. The EIS data revealed that F-Li3InCl6 exhibited the lowest real impedance (Z’), indicating superior ion transport capabilities among the doped electrolytes, as demonstrated in Fig. 7a1, a2. Density Functional Theory (DFT) calculations suggested that modifications in the coordinate space, covalency around Li⁺, and density of states could enhance ionic conductivity. Empirical studies confirmed that selective doping improves ion transport and electrolyte conductivity. The data showed an increase in ionic conductivity, with F-doping leading to an absolute increase of 0.54 S cm⁻¹, corresponding to a 233% increase; Mo-doping resulted in an absolute increase of 0.20 S cm−1, equivalent to an 81.4% increase; and Ce-doping led to an absolute increase of 0.10 S cm−1, correlating to a 42.8% increase. Although the increase with Ce-doping was smaller than that with F or Mo, the stability was more stable than the pristine electrolyte. These results suggest that doping can significantly enhance the ionic conductivity of Li3InCl6, with absolute increase value ranging from 0.10 to 0.54 S cm−1 (Fig. 7b1) corresponding to a relative increase of 40 to 230% (Fig. 7b2) under identical experimental conditions. Specifically, fluorine doping resulted in a 2.3-fold increase in ionic conductivity, likely due to its small ionic radius (133 pm compared to 167 pm for Cl⁻), facilitating a lower energy pathway for ion transport within the octahedral to see-saw topological channel. Doping with molybdenum and cerium also increased ionic conductivity by 81.45% and 42.83%, respectively, attributed to changes in the local electronic structure, density of states, and localized f-orbitals. These findings confirm that selective doping can significantly alter the ionic conductivity of Li3InCl6 through various mechanisms, including changes in lattice parameters, atom occupancy, vacancies, bond lengths, tilt angles, and electronic structure. The ionic conductivity of the synthesized F-doped Li3InCl6 electrolytes achieved 0.54 S/cm, a value higher than previously reported conductivities for Li3InCl657. This difference in ionic conductivity highlights the efficacy of our synthesis methodology in enhancing ionic transport properties.
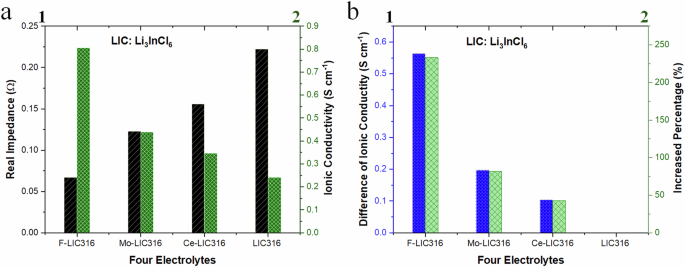
a Comparison of real impedance and ionic conductivity of four formulations of electrolytes; and b the absolute and relative difference in ionic conductivity based on pristine electrolytes performed on half the cells.
Reproducibility and conduction mechanism
To assess the reproducibility and conduction mechanism of non-doped Li3InCl6 electrolytes, two electrochemical techniques, electrochemical impedance spectroscopy (EIS) and cyclic voltammetry (CV), were utilized in a half-cell configuration. These methods evaluated the kinetics and stability of half-cell performance at 25 °C and 50 °C (Fig. 8a). The low real impedance, ranging from 0.15 to 0.25 Ω, demonstrates excellent ion transport within the solid electrolyte and good contact with the current collector plates. This was attributed to the porosity evaluation (Fig. 8b) that identified lattice vacancies for Li+ migration, resulting in low resistance. A reproducibility study conducted over ten EIS cycles at these temperatures indicated a variation of ±1.5% in real impedance, showing negligible hysteresis and suggesting no lattice deformation or inhomogeneity occurred during cycling, thus demonstrating consistent performance within the experimental parameters.
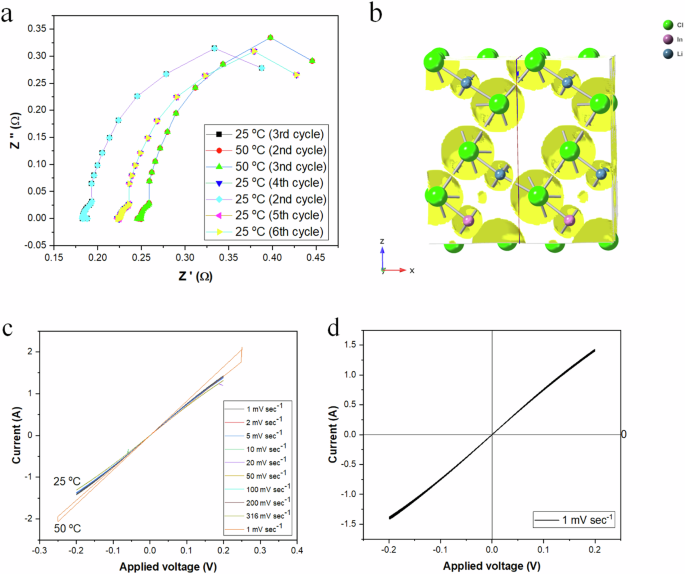
a EIS evaluation under difference cycles, note some curves are superimposed and not visible due to the low root mean square deviation of curves between the plots, and b the calculated porosity is beneficial to Li+ transport through the vacancy, c the CV analyses of the half-cells under different sweep rates, and d the CV analyses of the half-cells under a slow sweep rate of 1 mV s−1.
A detailed analysis of the Nyquist plot for Li3InCl6 reveals the electrolyte’s electrochemical behavior. At 25 °C, the impedance values exhibit minimal variation across all cycles, with a change of approximately ±1.5% in real impedance, indicating a stable electrochemical environment conducive to consistent ion transport. The increase in temperature to 50 °C results in a noticeable decrease in impedance, suggesting enhanced ionic mobility and reduced kinetic barriers for charge transfer processes. The semi-circular shape of the Nyquist plots, particularly pronounced at the lower temperature, points to a charge-transfer resistance (Rct) that dominates the electrochemical response of the system. The high-frequency intercepts with the real axis (Z’) provide an ohmic resistance (Rs) value of approximately 0.15 Ω, reflecting the intrinsic resistance of the electrolyte and electrode interfaces. These findings underscore the potential of Li3InCl6 as a solid-state electrolyte with favorable ionic conductivity and thermal stability, traits that are essential for the development of high-performance all-solid-state batteries. The cyclic voltammetric data (Fig. 8c) for Li3InCl6 at 25 °C (blue curve) and 50 °C (orange curve) at nine sweep rates (1 to 316 mV s−1) provides data on the electrolyte’s half-cell stability and electrochemical kinetics. The linear I-V curves across all sweep rates suggest ohmic behavior, indicating that the current response is directly proportional to the applied voltage. This is characteristic of the Li3InCl6 electrolyte with less than 0.15% hysteresis, a stable and low interfacial and bulk resistance pathway for ion transport. The lowest sweep rate was applied to gain further insight into the electrolyte’s electrical properties. The cyclic voltammetry curve conducted at a sweep rate of 1 mV s−1 (Fig. 8d) with an applied voltage range of −0.2 to +0.2 V presented a linear I-V relationship indicative of ohmic behavior within the electrolyte. The absence of hysteresis in the curve suggests that the electrochemical processes are reversible and that the material exhibits stable ion transport properties under the applied conditions. The integrated area under the curve, which is proportional to the charge passed during the voltammetry sweep, enables the evaluation of the electrolyte’s electrochemical stability and ion transport properties. The linear behavior and minimal area suggest low bulk resistance, facilitating efficient Li+ ion migration through the crystal lattice without inducing changes in the lattice defects over the nine cycles.
The lack of hysteresis indicates minimal polarization within the electrolyte, which can be attributed to the absence of significant side reactions or interfacial instabilities. The CV data implies the electrolyte can support stable cycling without degradation over long-term (n = 9) battery operation. It is agreed that the transport mechanism can be inferred by examining the pore structure within the ceramic electrolytes. Mobile point defects in the crystal lattice mediate ion transport. These defects include point, line, planar, volume, and electron defects, with point defects having the most substantial impact on Li+ ion migration. Specifically, Frenkel defects, which consist of lattice vacancies paired with interstitial ions, and Schottky defects, characterized by simultaneous anion and cation vacancies, are critical to this process. Introducing thermodynamically driven point defects allows ionic diffusion through random walks across a static energy landscape composed of discrete point defects. In disordered materials, ion transport is influenced not only by individual defects but also by the collective behavior of charge carriers as they interact with one another and the transport matrix. Several mechanisms govern li-ion transport in solid-state ceramic electrolytes, including vacancy, interstitial, and interstitial-substitutional exchange. The vacancy mechanism, dependent on Schottky defects, facilitates ion hopping by creating vacancies. When a Li+ ion hops, it leaves behind a vacancy, thus perpetuating the transport process. Conversely, the interstitial mechanism involves Li+ ions diffusing through Frenkel defects, moving within the interstices of the molecular framework, and displacing neighboring Li ions. The efficiency of Li-ion transport in ceramic solid electrolytes is determined by three primary factors: the type of charge carriers, the diffusion pathways, and the nature of diffusion. Point defects within the ceramic crystal structure directly influence the types and concentrations of carriers, which in turn significantly affect ionic conductivity. Li+ ions interact with their environment and other ions during transport, further impacting the overall ionic conductivity.
Discussion
The study of the Li3InCl6 ceramic electrolyte has yielded insights into its structural and electrochemical properties, appropriate for application in energy storage technologies. The electrolyte’s crystallization into a triclinic structure derived from corundum is characterized by eight distinct Li⁺ sites and four In³⁺ sites, each forming LiCl₆ octahedra that share corners and edges with other octahedra. This interconnected network is not only crucial for the structural integrity of the electrolyte but also facilitates ion transport and electron insertion, which are essential for its function. The electron density distribution (lower by 0.5–1.0 eV compared with literature) within the electrolyte has been analyzed, providing a better understanding of the bonding configurations and electrochemical attributes. Multiple Li⁺, In³⁺, and Cl− sites within the crystalline matrices influence the trajectory for ion transport, resulting in distinct electron density contours. The introduction of dopants such as F, Mo, and Ce has been shown to induce modifications in the electron density distribution, thereby influencing ion transport pathways and enhancing the electrolyte’s ionic conductivity. Our findings have been substantiated by density functional theory modeling and empirical data from electrochemical impedance spectroscopy (EIS) and cyclic voltammetry (CV). The EIS results have confirmed that doping with F− increases the ionic conductivity two-fold, attributed to the smaller ionic radius and higher charge density relative to Cl−, which facilitates a lower energy pathway for ion transport. Similarly, doping with molybdenum and cerium has also increased the ionic conductivity, attributed to changes in the local electronic structure, density of states, and localized d- and f-orbitals. The Nyquist plot analysis and CV data have provided compelling evidence of the electrolyte’s stable electrochemical environment and its conducive nature for consistent ion transport. The lack of hysteresis and the linear I–V curves across all sweep rates suggest ohmic behavior, indicative of a stable and low interfacial and bulk resistance pathway for ion transport. These results imply that the electrochemical processes within the electrolyte are reversible and that the material exhibits stable ion transport properties under the applied conditions. Furthermore, the transport mechanism has been elucidated by examining the pore structure within the ceramic electrolytes. Ion transport is mediated by mobile point defects in the crystal lattice, such as Frenkel and Schottky defects, which allow ionic diffusion through random walks across a static energy landscape composed of discrete point defects. The efficiency of Li-ion transport in ceramic solid electrolytes is determined by the type of charge carriers, the diffusion pathways, and the nature of diffusion, all significantly affected by point defects within the ceramic crystal structure. In light of these findings, it is clear that selective doping can dramatically alter the ionic conductivity of Li3InCl6 through various mechanisms. The calculated activation energy for pristine Li3InCl6 has been reduced considerably, leading to a general decrease in the activation energy for Li⁺ conduction upon fluorine doping. These doping-induced enhancements in solid-state Ionics are multifaceted, as observed in the non-linear Nernst plot, and underscore the potential of directed exploration of structural properties and electron density distribution modeling to enhance ceramic halide ion conductivity.
Conclusion
This study has provided a detailed exploration of the Li3InCl6 ceramic electrolyte, revealing its promising potential for application in energy storage technologies. Our investigation into the electrolyte’s structural and electrochemical properties has demonstrated a triclinic structure derived from corundum, with a network of interconnected octahedra essential for its structural integrity and function. The electron density distribution within the electrolyte has offered valuable insights into ion transport, electron insertion, bonding configurations, and electrochemical attributes. Our findings have shown that selective doping with elements such as fluorine, molybdenum, and cerium can significantly enhance the ionic conductivity of Li3InCl6. This is achieved through various mechanisms, including alterations in lattice parameters, atom occupancy, vacancies, bond lengths, tilt angles, and electronic structure. The electrochemical impedance spectroscopy and cyclic voltammetry (CV) data have confirmed the stability and reproducibility of the electrolyte’s performance, with minimal hysteresis and consistent ion transport properties. The Nyquist plot analysis and CV data have further underscored the potential of Li3InCl6 as a solid-state electrolyte with favorable ionic conductivity and thermal stability profile crucial for developing high-performance all-solid-state batteries. In conclusion, our research has significantly advanced the understanding of the Li3InCl6 electrolyte. The results highlight the importance of optimizing electrolyte composition and structure to achieve lower activation energies and enhanced battery performance. Future work should continue to explore the effects of doping and employ machine learning to make informed choices on optimized modifications and atom engineering of ceramic electrolytes. Our goal is to advance efficient and sustainable energy storage solutions.
Responses