Nano-micro pore structure characteristics of carbon black and recycled carbon fiber reinforced alkali-activated materials
Introduction
Construction materials production, driven primarily by cement and steel manufacturing processes, is the main driver of growth in construction-related embodied carbon emissions. Currently, the challenge of climate change and the need for a new circular economy (CE) model requires material manufacturing and construction processes to be more efficient in terms of resource utilization. Fortunately, researchers have found that alkali-activated cementitious materials can be used as partial or complete replacements for cement, and AAM provides an effective strategy to reuse waste industrial by-products1,2,3. This is not only beneficial to reducing carbon emissions generated in cement production but also reuses solid waste and is a new way to improve the sustainability of the construction industry. AAM composites are hydraulic cementitious materials obtained through chemical reactions with alkali activators, utilizing amorphous aluminosilicate materials with pozzolanic or potential hydraulic properties as their primary raw materials4. Raw materials for AAM composites include slag, fly ash, red mud, and other industrial by-products or solid wastes5. The integration of functional materials into AAM composites to produce conductive, refractory, and ultra-high strength building materials has also been developed6,7.
Notably, AAM composites exhibit superior electrical conductivity to ordinary Portland cement composites, attributed to alkali activators facilitating ion presence and improved pore connectivity8,9,10. This inherent property positions AAM composites as promising smart structural materials. Therefore, many researchers use AAM composites as the matrix and add conductive fillers and carbon-based materials to develop piezoresistive materials11. Various carbon particle materials (e.g., nano carbon black, graphene, activated carbon) and fibrous materials (e.g., carbon nanotubes (CNT), carbon fibers), commonly used additives in cement-based materials, find application in AAM composites12,13,14. The carbon fiber used in the past was mainly virgin. Still, as the recycling of carbon fiber reinforced composites (CFRP) materials has recently become a hot topic15,16, rCF has become an essential conductive additive. Previous studies have demonstrated that rCF exhibited an exceptionally low percolation threshold in alkali-activated slag mortar, with just 0.15 vol% rCF reducing conductivity to 200 Ω·cm while exhibiting favorable piezoresistive properties17. Research by Wang et al.18 involved the addition of activated carbon powder, carbon fiber, and nano-ZnO as conductive fillers to cement-based composites with a focus on sensitivity analysis through fitting experimental data of resistivity change fraction and compressive stress curve. Similarly, Kusak et al.19 investigated the impact of adding CNT to AAS, noting a decrease in impedance absolute value with increasing CNT content, alongside a general increase in relative dielectric constant. Researchers also used computational simulation methods to explore the mechanism by which particle or fiber additives affect the performance of composite materials20,21,22,23,24. However, observing existing research, it is not difficult to find that most of the research on AAM composites as low-resistance materials focuses on changes in mechanical properties, the impact of composition on resistivity, and suitable working conditions of self-sensing components.
However, If AAM components are to be integrated into engineering smart structures, a comprehensive understanding of their microstructure and macroscopic properties is imperative25,26. It’s widely acknowledged that akin to cement-based materials, AAM composites undergo hydration reactions with alkali activators, resulting in the formation of hydration products and pore structures27. The pore structure serves as a pathway for water or corrosive media to permeate the cementitious matrix, crucially influencing mechanical strength, impermeability, airtightness, frost resistance, corrosion resistance, and other properties28,29,30. However, limited research exists on the interplay between pore structure and performance of AAM composites, particularly those incorporating common conductive fillers. Zhang et al.31 noted that 2% CB optimized the OPC cement matrix’s pore structure and interface transition zone. Mobili et al.32 demonstrated that gasification char and rCF could reduce the resistivity of OPC mortar by 90%, decreasing total porosity and average pore diameter. Keulen et al.33 observed that polycarboxylate plasticizing admixture effectively reduced total and effective capillary porosity in alkali-activated fly ash-slag concrete, refining pore size. Li et al.34 investigated the effect of rCF as a reinforcing material for fly ash-GGBS AAM composites, finding that the electrochemical oxidation treatment of rCF slightly increased porosity. Current research mainly examines the impact of fillers on the pore structure (porosity and pore diameter changes) of AAM, often discussed as a factor contributing to macroscopic performance changes. Yet, many detailed characteristics regarding pore structure itself remain elusive.
Understanding and predicting the mechanical properties and durability of AAM composites can be enhanced through pore structure analysis. This study utilized CB and rCF as additives for alkali-activated slag (AAS) cementitious materials. One-part AAS mortar was prepared using solid alkali activators, superplasticizer powder, etc. The impact of CB and rCF addition on the mechanical properties, water absorption, contact angle, and other properties of AAS mortar were examined. Through vision-based image analysis and mercury intrusion porosimetry, the effects of CB and rCF additives on the pore structure of AAS mortar were scrutinized, including porosity, critical pore diameter, threshold pore diameter, fractal dimension, etc. Furthermore, the relationship between fractal dimension and macroscopic performance was explored. SEM images were employed to observe the morphological characteristics of AAS mortar and the effects of CB and rCF additives on it.
Results
Mechanical strength
Both CB and rCF positively impact the flexural properties of AAS mortar, as shown in Fig. 1. At the early stage (7 days), incorporating 0.2–0.8 wt% CB slightly improves AAS’s flexural strength, with a maximum 10% increase observed in the M-CB2 (Fig. 1a). Calculating each group’s 7-day and 28-day strength ratios, the 7-day strength development rate of control group M is 88.64%. The M-CB series ranges from 56 to 73%, indicating CB’s influence on early AAS flexural strength. It’s possible that CB particles filled between GGBS particles and delayed the alkali activators’ reaction process. However, with aging, the M-CB group’s flexural strength significantly increased at 28 days. Notably, M-CB8 reaches 11.82 MPa, 47.60% higher than M. Even M-CB10, with lower flexural strength at 7 days, reaches 10.82 MPa at 28 days, a 35.09% increase over M. Flexural strength initially increased and then decreased with increasing CB content, with 0.8 wt% CB identified as optimal.
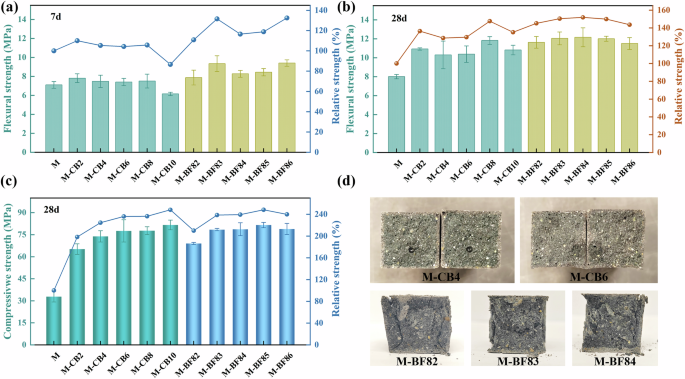
a 7d and b 28d flexural strength of AAS mortars; c compressive strength of AAS mortars at 28 days; d samples that failed in bending (top) and failed in compression (bottom).
Adding rCF based on M-CB8 significantly enhanced flexural strength, even with small amounts of rCF (0.2–0.6 wt%). At 7 days, the M-BF series showed over a 30% increase in flexural strength compared to M. By 28 days, M-BF84 achieved a flexural strength of 12.16 MPa, 51.82% higher than M. This improvement stems from rCF’s high mechanical strength, which enhances cementitious composites’ mechanical properties significantly. However, rCF addition may introduce defects like bubbles into GGBS paste, potentially weakening its mechanical properties35. As depicted in Fig. 1b, the M-BF sample’s flexural strength increased when rCF content rose from 0.2 to 0.4 wt%. Beyond 0.4 wt%, rCF’s enhancement effect on AAS flexural strength gradually diminishes. These two effects in rCF-reinforced AAS counteract each other, resembling a trade-off effect, dominating at different dosages.
Figure 1c illustrates the impact of CB and rCF on the compressive strength of one-part AAS mortar, alongside failure photos of typical samples. Incorporating CB significantly enhanced AAS’s compressive strength. At 28 days, the compressive strength of M was merely 32.89 MPa, yet adding just 0.2 wt% CB boosted it to 65.33 MPa, marking a 98.31% increase. As CB content rises, the strengths of the M-CB mortars steadily increased. M-CB8 and M-CB10 exhibited compressive strengths as high as 77.76 and 81.65 MPa, respectively, marking 136.44% and 148.29% increases over the control group. This notable enhancement primarily stems from grape-like CB particles optimizing the pore size distribution of AAS and refining pore size, a detailed analysis of which will be provided later. Conversely, when CB content was 0.8 wt%, the variation in rCF addition had minimal impact on enhancing M-BF’s compressive strength. M-BF84 achieved a compressive strength of 78.73 MPa, while M-BF85 reached 81.57 MPa, equivalent to M-CB10. This underscores CB’s role in enhancing AAS’s compressive strength, while rCF primarily enhances flexural strength.
The sample that broke during the flexural strength test is shown in the upper pictures of Fig. 1d. As shown in the figure, the sample may encounter large holes formed by entrapped air when cracking, which is very detrimental to the flexural strength. The bottom pictures of Fig. 1d depict the failure mode of a representative sample under compressive load, revealing uniform compression failure across the entire specimen with longitudinal cracks expanding along the loading direction, indicative of a typical longitudinal failure mode. However, owing to rCF’s crack-bridging capability, no lateral explosion occurred in the compressed cube36. Upon further load increase, peeling occurred around the cube, exposing the hourglass-shaped core. Both M-CB and M-BF series samples exhibited a longitudinal failure mode during compression testing, with no shear compression or transverse failure observed. It was proved from the side that these samples possessed a uniform internal structure without rCF or CB particle agglomeration, attributed to the lower dosage and efficient mixing method of CB and rCF. It’s noteworthy that unlike cement-based materials (CB content ranges 2–15 wt%)31,37,38, this study’s one-part AAS mortar requires only a small amount of CB (0.8 wt%) or rCF (0.4 wt%) to achieve significantly improved mechanical properties, underscoring their effectiveness and cost-efficiency.
Water absorption and vision-based macropore distribution
Harden AAM composites possess a hydrophilic nature and porous structure, making them susceptible to water infiltration of corrosive substances through pores, leading to durability issues39,40. Thus, minimizing water absorption is pivotal to enhancing the service life of AAM composites. Figure 2a illustrates the water absorption of AAS mortars. The control group, M, exhibited the highest water absorption rate at 12.53%. However, after adding CB and rCF, the water absorption rate decreased. For instance, M-CB6 demonstrated a water absorption rate of 10.71%, marking a 14.51% reduction compared to M. Furthermore, in the M-BF series, the water absorption rate gradually decreased with increasing rCF content. Specifically, M-BF84 and M-BF86 exhibited water absorption rates of 10.24% and 9.96%, respectively, representing 18.28% and 20.56% reductions compared to M. This reduction correlates with decreased porosity and threshold pore size in the M-BF series samples. In addition, contact angle testing reveals that samples with added CB and rCF exhibited significantly higher contact angles than M (Fig. 2b). This is primarily attributed to CB’s hydrophobic nature, which effectively reduced mortar capillary water absorption, and larger hydrophobic pores are less conducive to water penetration37. Therefore, hydrophobic grape-like CB particles diminish AAS mortar porosity and enhance overall waterproofing, contributing to lower water absorption.
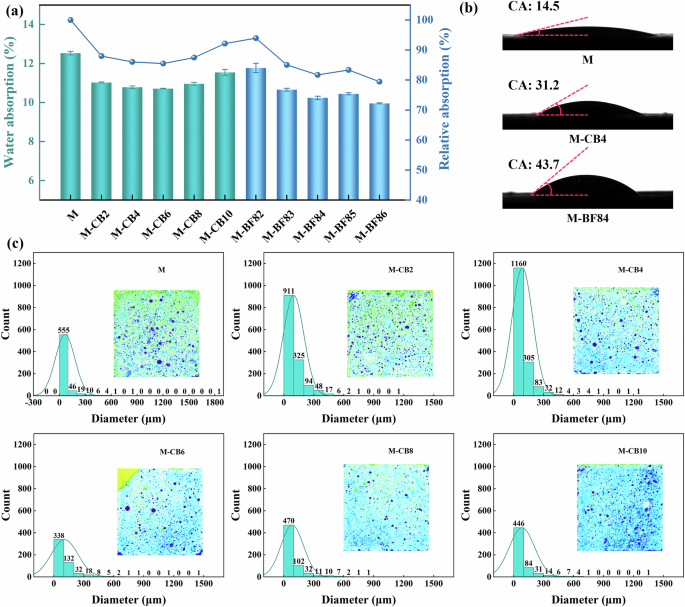
a Water absorption; b contact angle of AAS samples; c vision-based macropore distribution of M-CB series.
The entrapped air voids in hardened AAM composites significantly influence the material’s mechanical properties. Vision-based image analysis is a rapid method to analyze the macropore distribution of samples. Figure 2c illustrates the pore size distribution on the surface of the M-CB series. The internal representation depicts a binarized and color-coded image of the slice photo based on gray values, facilitating a more intuitive observation of the changing trend of the number and distribution of large pores. As depicted in Fig. 2c, the entrapped air voids within M are obvious and can reach the millimeter level, exceeding 1.8 mm, which may adversely affect mechanical properties and permeability. Upon incorporation of a small amount of CB (M-CB2 and M-CB4), the macropores in the sample decreased, albeit with an increase in total pore count, indicating that CB can refine pore size. When the CB content exceeds 0.6 wt%, the number of voids and oversized pores in the slices notably diminished, leading to a denser AAS mortar structure corresponding to the optimal mechanical property enhancement effect of M-CB8. It’s important to note that vision-based analysis of micropores provides a quick method to display the situation of large pores visually. However, it lacks the capability to analyze AAS’s full pore size distribution and has limitations in dealing with nanoscale/capillary pores. Therefore, representative samples underwent MIP testing to obtain detailed information on the effects of CB and rCF on AAS pore size distribution.
Pore structure analysis
Compared to typical porous materials, hardened slag slurry possesses a complex porous structure with a broad pore size distribution, ranging from nanoscale gel pores to millimeter-scale macropores41. Porosity, indicating the proportion of internal pore volume to total volume, crucially impacts the material physical, mechanical, and durability properties. Figure 3a displays mercury intrusion curves for representative samples M, M-CB4, M-CB8, and M-BF84. Various researchers categorize pores differently, but generally, pores under 10–25 nm are deemed harmless, while those between 20–200 nm are somewhat detrimental, and pores larger than 200 nm are considered harmful31. The one-part AAS mortars exhibited a distinct three-kind pore distribution, classified as <15 nm (gel pores), 15–1000 nm (capillary pores), and >1000 nm (micropores). Gel pores have minimal adverse impact on sample properties, while capillary pores influence permeability and mechanical properties, and pores over 1000 nm mainly affect mechanical properties42.
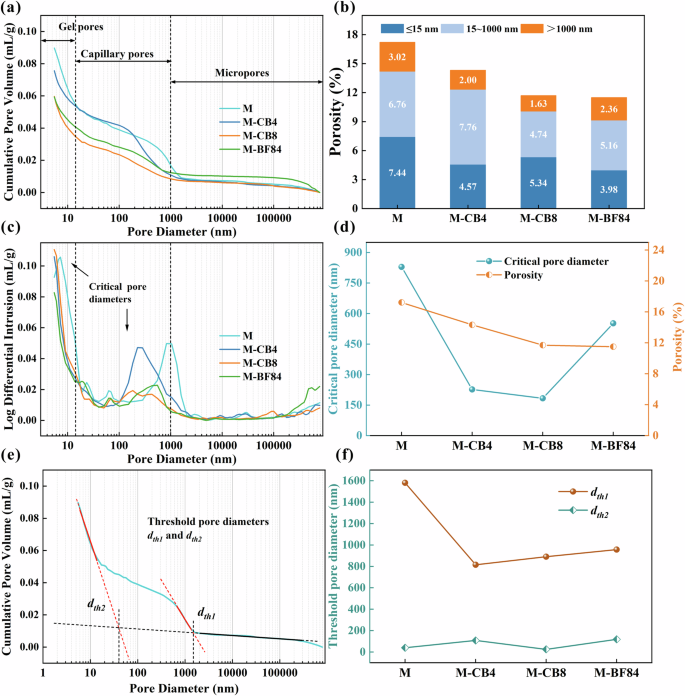
a Pore size distribution cumulative volume curves at 28 days of AAS mortars tested; b total porosity and segmented porosities corresponding to different pore size ranges; c mercury intrusion differential curve and critical pore size of the samples; d the critical pore diameter and porosity change curve of the samples with the addition of CB and rCF; e determine the threshold diameter using the tangent method based on the mercury intrusion curve; f the threshold pore size corresponding to different pore size ranges for different samples.
According to the mercury intrusion curve, the total porosity of the sample and the porosity in different pore size ranges were obtained, as shown in Fig. 3b. Control group M had the highest porosity at 17.22%. These pores formed due to water evaporation during the clamping and hardening process. With the addition of CB and rCF, the porosity of AAS samples gradually decreased, and the porosity of M-CB4, M-CB8, and M-BF84 was 14.33%, 11.70%, and 11.50%, respectively. With their grape-like particles, the CB particles provided a certain size flexibility, filling the pores between the components in the mortar matrix, thus reducing total porosity. In addition, the small size and high specific surface area of CB particles may absorb part of the water, reducing the space occupied by water and densifying the mortar. The porosity of M-CB8 and M-BF84 was the lowest but equivalent, indicating that CB played a leading role in reducing porosity, and 0.8 wt% was the optimal dosage. Observing the segmented porosity, it can be found that the addition of CB mainly reduced the proportion of micropores (larger than 1000 nm), indicating that CB had the effect of refining the pore size. At the same time, since large pores are very detrimental to the mechanical properties of mortar, the refinement of pore diameter by CB is one of the reasons for the substantial increase in the flexural strength and compressive strength of the M-CB and M-BF series samples.
The critical pore diameter (dc) corresponds to the peak in the differential mercury intrusion pore curve (i.e., the steepest point of the invasion curve)43. It refers to the smallest pore diameter that can connect larger pores44. Figure 3c illustrates the corresponding critical pore sizes in different pore size ranges (<15 nm and 15–1000 nm). The following mainly discusses dc in the capillary pore range. Table 1 details each sample’s critical pore diameter, threshold pore diameter, and porosity. The dc of control group M was the highest, reaching 829 nm. With the addition of CB, the dc significantly decreased, with the dc of M-CB4 and M-CB8 at 226 nm and 183 nm, respectively. This indicates that the grape-like CB particles have a notable effect in refining the pore size. Correspondingly, the porosity of these samples also decreased with the increase of CB (Fig. 3d), and the critical pore diameter of M-CB8 was the smallest. In M-BF84, the critical pore diameter significantly increased (dc = 551 nm). This is because numerous tiny bubbles formed in the rCF suspension. Previous studies have found that rCF suspension can lead to increased air and decreased fluidity in AAS slurries17. However, the porosity of M-CB8 and M-BF84 remained comparable, indicating that the bubbles introduced by rCF only increased the proportion of capillary pores. Most pores were around 550 nm and did not significantly increase micropores or porosity, consistent with the segmented porosity distribution in Fig. 3b.
Threshold pore diameter (dth) is a crucial parameter characterizing the morphology of pore structure, reflecting the connectivity of pores. When the pore diameter exceeds dth, the amount of mercury intrusion is minimal; however, when the pressure reaches the value corresponding to the dth, mercury begins to penetrate the matrix, resulting in a significant increase in mercury intrusion. In this study, the tangent method was employed to determine the dth of each sample, as illustrated in Fig. 3e. Specifically, two tangent lines were drawn before and after the inflection point where the cumulative pore volume curve showed a significant rise, and the intersection point of these lines represented dth42. Based on the mercury intrusion curves (Fig. 3a), two percolation processes were observed in the nanopores (around 100 nm) and micropores (around 1000 nm). Their corresponding threshold pore diameters were recorded as dth1 and dth2, respectively (Table 1). Notably, the addition of CB powder and rCF significantly influenced dth2 in the micron pore range, reducing it from 1580 nm (M) to approximately 900 nm (Fig. 3f). The dth2 values of M-CB4 and M-CB8 were 815 nm and 890 nm, respectively, indicating that CB particles reduced the connectivity of the pore structure in AAS mortar. As known, pore connectivity is crucial in assessing the ability of porous materials to resist erosion by transmission media45. Thus, the decrease in pore connectivity demonstrates that M-CB and M-BF samples possess enhanced resistance to erosion and are expected to exhibit improved durability. This is also the underlying reason for the reduction in water absorption of M-CB and M-BF series samples.
The fractal characteristics of pores in cement-based paste have been proved, indicating that pores in such materials exhibit self-similarity46. Similarly, as a porous material, hardened slag mortar possesses a complex pore structure. Within the hardened slurry, macropore walls consist of smaller pores and solid surfaces, while the smaller pores comprise micropores and solid surfaces. Furthermore, micropores are constituted by gel pores and C-(A)-S-H gel47. Fractal theory provides an effective framework for characterizing the irregularity and complexity of pore structures48. In addition, pore fractal analysis is a crucial indicator for evaluating the durability of cementitious composites.
According to the principle of conservation of energy, the Neimark model believes that the work done by external force on the amount of mercury entering is equal to the work done by the surface tension of mercury on the inner pore surface, that is,
which is,
where S is the specific surface area of pores (m2/g), γ is mercury surface tension (0.485 N/m), θ is the contact angle between mercury and the solid surface (130°), P is external pressure (psia), V is the intrusion volume of mercury (mL/g). Since the mercury injection process is carried out step by step, the discrete form of Eq. (2) can be expressed as:
Assuming that the pore structure is cylindrical, according to the Washburn equation49, the mercury intrusion pressure (P) and pore diameter (d) satisfy the relationship:
where WASHCON is Washcon constant = 0.145. At the ith mercury injection pressure point (Pi), the corresponding cylindrical pore diameter (di) satisfies:
And the average diameter (dmi) at ith point is,
Incremental specific intrusion volume (ΔVi) for the ith point is:
As known, the relationship among wall area (Sc), diameter (Dc), and volume (Vc) for a cylinder is;
Therefore, the incremental specific pore area for the ith point is:
And the cumulative specific pore area (Si) for the ith point is:
Then, according to the mercury intrusion volume-pressure curve in the MIP test, the surface area of the invaded pore corresponding to each mercury intrusion point can be calculated. When the porous material has fractal characteristics (fractal dimension is D), the pore surface area and diameter satisfy50:
Take the logarithm of both sides in Eq. (11), that is,
Putting Eq. (3) into Eq. (12), then,
Use Log[S] and Log[P] to plot and linearly fit the curve. The value of the fractal dimension can be obtained based on the fitting slope. In fractal theory, the range of surface fractal dimension is 2 ≤ D < 3. A surface fractal dimension of 2 means that the pore surface is entirely flat, and if the value is close to 3, it means that the pore surface becomes irregular and rough51.
Figure 4 illustrates the fractal dimensions of samples M, M-CB, M-CB8, and M-BF84. These AAS mortars exhibit distinct multi-fractal characteristics within the micron and capillary pore ranges, denoted as D1 and D2, respectively. Previous research suggested that the fractal area of micropores (d = 5–750 μm) characterizes the stacking morphology of hydrated gel particles. In contrast, the fractal area of micropores (d = 5 nm–5 μm) mainly characterizes the microstructure of C-S-H hydrate52. The local fractal range of each sample is different, but they all belong to the above two fractal areas. In the case of the micropore fractal area, M-CB8 displays the smallest fractal range (Fig. 4c), spanning from 10 to 60 μm, while the others range from a few microns to 200 μm. According to the analysis of hydration heat, composition, and proportion of hydration products in previous studies31,53, since CB particles are very small, some nano-sized particles provide nucleation sites for hydration products, and CB particles also become part of the network connecting the gel structure. This connection makes the accumulation of hydrated gel particles denser, so M-CB8 with moderate CB content has a narrow microporous fractal region. The D1 of M-CB2 increased (Fig. 4b), suggesting that a small amount of CB particles render the micropores rougher. Concerning capillary pores, when the CB content reaches 0.8 wt%, there is a notable increase in the fractal dimension within the capillary pore range (2.933). This indicates that the CB content is sufficient to be uniformly distributed in the C-(A)-S-H hydrate, enhancing the roughness of capillary pores. In addition, due to the uniform distribution of a substantial amount of CB in the gel, the regularity of pores on a larger scale is improved. Figure 4 confirms that the one-part AAS mortars exhibit multi-fractal characteristics. While the addition of CB and rCF altered the range of the fractal area, it did not change the size dependence of the fractal characteristics.
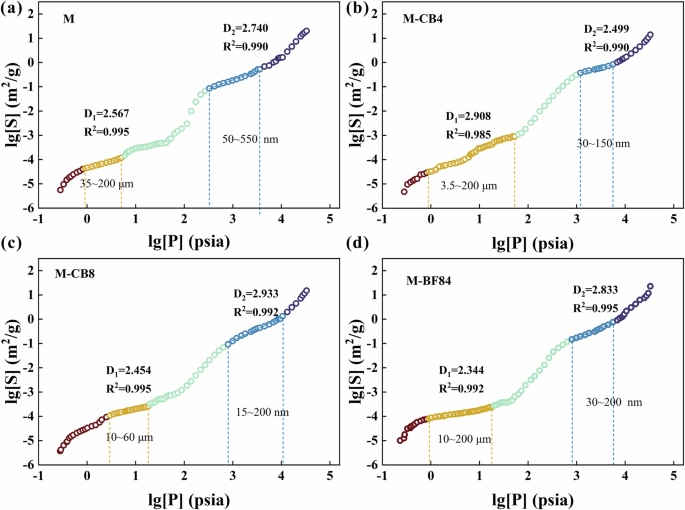
a M; b M-CB4; c M-CB8; d M-BF84.
In addition to calculating the fractal dimension of the local area using the Neimark model, the fractal dimension in the backbone formation region can also be derived from the MIP test. According to percolation theory (Katz and Thompson method54), the intruding fluid initially traverses the entire sample at a certain threshold pressure, creating a geometric configuration of fluid known as the percolation backbone. The region corresponding to the pressure from the first percolation to the completion of the backbone is termed the backbone formation region. As the pressure rises, the pore cavity behind the smaller pore throat gradually fills. However, the sudden influx of fluid observed at the threshold pressure does not occur until a second percolation process transpires in the matrix. The fractal shape of the backbone formation area may be closely linked to the sample’s mechanical strength, permeability, and other properties. The definition equation of Backbone fractal dimension (Db) is as follows,
where, V is specific intrusion volume (mL/g), P is pressure (psia), Pt is threshold pressure which is given in the MIP test report, α is proportionality constant. Take the logarithm of both sides of Eq. (13),
According to the relationship of Eq. (15), the Backbone fractal dimension (Db) of the sample can be obtained by linear fitting the test data. In the MIP experiment, the threshold pore diameter is associated with the percolation of mercury. It is established that the threshold pore diameter (dth1, corresponding to the pore size of the first percolation process) of the AAS mortar sample ranges between 800 and 1600 nm (Fig. 4f). On this basis, the backbone fractal dimension corresponding to the pressure range of 10–280 psia was calculated for the M, M-CB4, M-CB8, and M-BF84 samples (Table 2).
Figure 5 illustrates the relationship between Db and various performances. Firstly, a notable linear correlation exists between Db and porosity (Fig. 5a). As Db increases, porosity decreases. Given the close relationship between water absorption and porosity, water absorption also diminishes with increasing Db (Fig. 5b). This suggests that a more complex pore structure in the backbone formation area is conducive to reducing water absorption. The fitting degree between Db and water absorption is slightly inferior to that of porosity. This discrepancy may stem from variations in the threshold pore diameter dth1 among samples, even within the same backbone formation area, leading to differences in water absorption. Of note is the strong linear fitting relationship between Db and flexural strength and compressive strength (Fig. 5c, d). Notably, the linear fit with flexural strength outperforms that of compressive strength, indicating that the flexural strength of AAS mortar primarily hinges on the pore structure of the backbone formation region. The more complex the pore structure in this region, the higher the flexural strength of AAS. At the same time, compressive strength exhibits a certain linear correlation with Db, and polynomial fitting yields a superior degree of fitting. In other words, compressive strength increases with Db, but once Db reaches a higher value, its impact on compressive strength decreases.
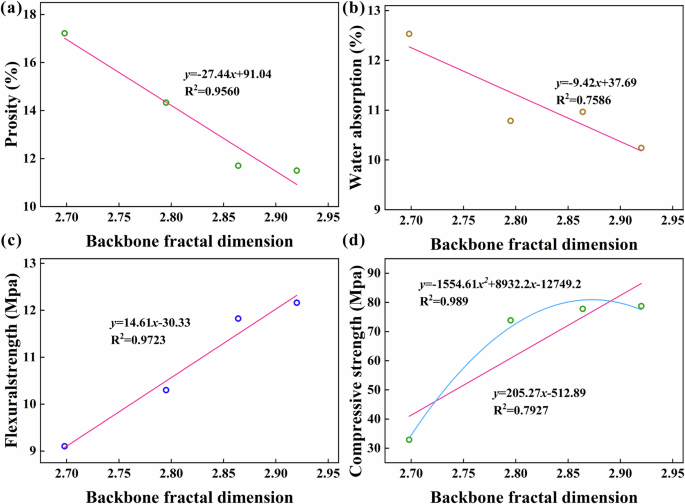
a Porosity, b water absorption, c flexural strength, d compressive strength.
Micromorphology analysis
In Fig. 6a, the hydration product C-(A)-SH gel in sample M appears granular55, relatively loosely packed, and exhibits evident pores. This aligns with the highest porosity and water absorption of M. Conversely, for M-BF86, at a similar observation magnification, the C-(A)-SH gel appeared denser (Fig. 6b) and closely bonded with aggregates (Fig. 6c). This elucidates why M-CB and M-BF series samples demonstrate lower porosity and higher mechanical strength. Micropores within the sample exhibit numerous capillary pores distributed along the pore walls (Fig. 6d), representing the pore surface fractal previously discussed. Notably, Fig. 6d shows many hydration products still adhering to the surface of the pulled fiber, indicating good interfacial bonding between rCF and the hydrated gel matrix. This favorable interfacial bonding can be attributed to adding micron-sized grape-like CB particles and silica powder. This fiber is adjacent to the micropore, with a gap between the unattached fiber end and the gel matrix. Thus, the crack in the micropores likely resulted from fiber pulling, as evidenced by the widest cracks at the fiber end, tapering off as they extend away. Observations reveal the phenomenon of propagating cracks in the AAS matrix terminating at rCF in different samples (Fig. 6c, e). These rCFs passing through microcracks or existing at the tips of microcracks can bear part of the load and delay the development and merger of microcracks. In addition, tracks of fibers and broken fiber ends resulting from fiber breakage during AAS broken by load were also observed (Fig. 6f). This is because when the AAS mortar was continuously loaded, microcracks developed into macro-cracks, and the matrix cracked. However, rCF has high tensile strength and is bridged at both ends of the crack. The fiber pullout and fracture process will continue to absorb energy, thus improving the toughness of AAS mortar56. These three factors revealed by SEM image observations (good interfacial bonding, control of microcrack development, and the bridging effect of rCF) elucidate why CB and rCF enhance the compressive strength and flexural strength of AAS mortar.
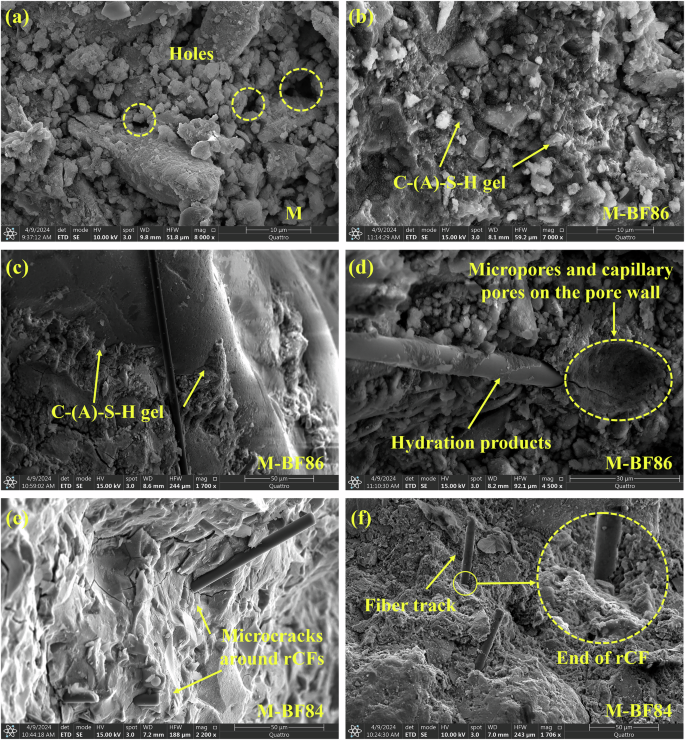
a M, b–d M-BF86, and e, f M-BF84.
Discussion
Pore structure science is an important topic in the mesoscopic level research of sustainable AAM composites. In the emerging research on AAM composites with additives, pore parameters are usually used as one of the reasons to explain performance changes, and there is a lack of specialized research on pore size, pore distribution, connectivity, and fractal characteristics. This study thoroughly investigated the impact of CB and rCF on the pore structure of one-part AAS mortar and proposed the correlation of pore structure characteristics (porosity, characteristic pore diameters, fractal dimension) and macroscopic properties (mechanical properties, water absorption).
As experimental results, both grape-like CB particles and rCF contribute to enhanced flexural strength. M-CB8 exhibited a 47.6% increase in 28-day flexural strength, while M-BF84 reached 12.16 MPa, a 51.82% improvement compared to control group M. CB is the main reason for improving the compressive strength of AAS, while rCF has less enhancement effect. Compressive strengths of M-CB8 and M-CB10 were 77.76 and 81.65 MPa, respectively, marking a 136.44% and 148.29% increase over the control group. Reduction in water absorption of M-CB and M-BF series is attributed to decreased porosity and enhanced waterproofing by hydrophobic CB and rCF. M-BF84 exhibited a water absorption rate of 10.24%, lower than typical cement-based composites. This is an aspect worth exploring; that is, suitable hydrophobic carbon material additives can simultaneously improve the mechanical strength and waterproofness of the matrix, and there is hope for the development of overall waterproof high-strength AAM composites.
In terms of microstructure, micron-scale CB particles and rCF refined AAS mortars’ pore size and reduced pore connectivity. CB decreased micropore proportion and critical pore size within the capillary pore range. The introduction of rCF increased capillary pores but not micropores or porosity. Pore size refinement and connectivity reduction are key factors in improving mechanical properties and reducing water absorption in AAS mortars. Furthermore, M-CB and M-BF mortars exhibited multi-fractal characteristics, primarily in micropores below 200 μm and capillary pores below 550 nm. The addition of CB and rCF altered the range and fractal dimension of the fractal region without changing the fractal characteristics’ size dependence. This demonstrates the multifractal characteristics of slag-based cementitious materials, with or without additives. On the other hand, with the addition of CB and rCF, the backbone fractal dimensions (Db) increase, which means that the gel in the backbone formation region is extremely disordered and complex. The backbone fractal dimension of AAM composites is negatively correlated with porosity and water absorption but positively correlated with flexural strength and compressive strength, serving as comprehensive parameters for pore shape and spatial distribution. Voids with fractal characteristics and the densification effect of CB on the gel matrix of AAS composites were observed in the SEM images. The three functions of rCF, including good interfacial bonding, microcrack control, and bridging effects, are the reasons why it further improves the mechanical strength of AAM composites.
Methods
Materials and proportions
This study prepared a one-part AAS mortar using slag, river sand, solid alkali activator, and superplasticizer powder, with carbon black (CB) and recycled carbon fiber (rCF) as additives. Ground Granulated Blast Furnace Slag (GGBS) was sourced from Green Island Cement Company Limited, a local cement manufacturer in Hong Kong, with a 2870 kg/m3 density density. The XRD pattern of GGBS, shown in Fig. 7a, indicates a high amorphous content, which can facilitate the alkali-activated reaction. Laser particle size analysis (Fig. 7b) revealed that the particle size of GGBS ranges from 0.3 to 75 μm, with D90, D50, and D10 values of 37.061 μm, 13.284 μm, and 1.202 μm, respectively. SEM photo (Fig. 7a) depicts its irregular shape. Table 3 presents the chemical composition of GGBS, with the total content of CaO, SiO2, and Al2O3 nearing 92%.
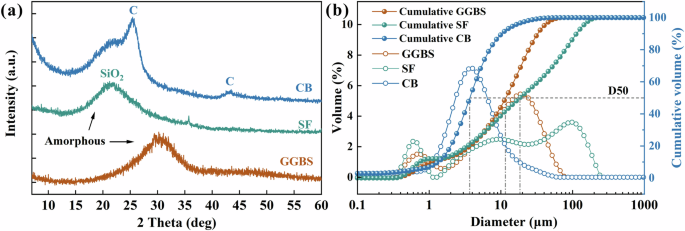
a X-ray diffraction (XRD) spectrum and b particle size distribution of GGBS, SF, and CB powder.
Silica flour (SF), provided by a local company in Hong Kong, served as an additive to enhance the additives’ uniform dispersion and interfacial bonding57. The XRD curve shows a broad SiO2 peak (Fig. 7a), indicating that SF is also amorphous. The particle size of SF is comparable to that of GGBS (Fig. 7b), but there is a higher proportion of particles smaller than 1 μm, D90, D50, and D10 of SF are 128.626 μm, 20.863 μm, and 0.836 μm, respectively. The SiO2 content in SF exceeds 95% as shown in Table 3. Natural river sand was used as the fine aggregate with a particle size ranging from 75 μm to 2.36 mm. The sand was washed and dried at 105 °C for subsequent use. The preparation of the one-part alkali-activated slag mortar involved using formulated sodium silicate (Na2O·nSiO2) powder (SSP) with a modulus of 1.5 (based on the mole ratio) as the alkali activator. Detailed instructions are available in a previous study17. Compared with the two-part method using an alkali activator solution, the one-part method is safer, more efficient, and environmentally friendly58. Commercially available PCE powder was employed as the superplasticizer. Recycled carbon fiber (rCF) was sourced from the British company ELG Carbon Fiber Ltd. The fiber underwent recycling via the pyrolysis technique. Thermal treatment of the carbon fiber surface likely caused oxidation and residual carbon after resin decomposition (Fig. 8b, e). This process increased the roughness of the rCF surface, which may enhance mechanical interlocking between the fiber and matrix thereby improving interface bonding57. The rCF utilized in this study had a length of 6 mm, a fiber diameter of 7 μm, a density of 1800 kg/m3, a tensile strength of 4150 MPa, and a tensile modulus of 230–255 GPa. Carbon black (CB) was procured from a commercial company and is of very high purity, containing over 99.5% carbon. In the XRD curve of CB, two broad peaks nearing (002) and (101) of carbon materials appeared (Fig. 7a), which are characteristic diffraction peaks of amorphous carbon. In addition, no other diffraction peaks were observed in XRD, proving the high purity of CB. Figure 7b shows the particle size distribution of CB. Compared with GGBS and SF powders, the particle size of CB particles is very small, with D90, D50, and D10 being 11.701 μm, 4.196 μm, and 1.511 μm, respectively. The tiny size helps the CB particles fill the voids in the AAS matrix, thereby refining the pore size. SEM imaging revealed that CB existed as grape-like particles with high surface roughness at the micron and nanoscales. This multi-scale roughness conferred hydrophobic properties to CB37. In addition, these grape-like clustered particles can easily fill the space in slag hydration products.
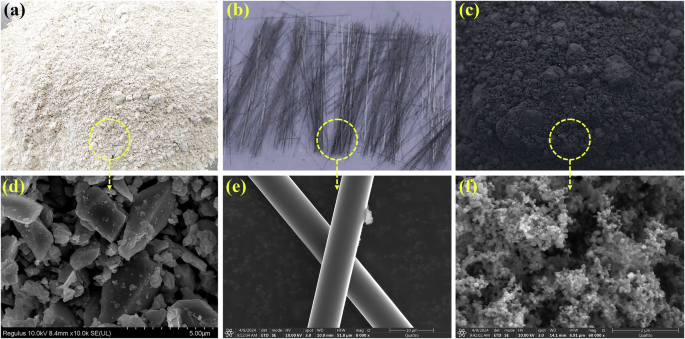
Digital photos of raw materials a GGBS, b rCF, and c CB; SEM images of d GGBS, e rCF, and f CB.
Experimental design and preparation
In this study, a total of 11 experimental groups were set up, comprising one control group (M), 5 experimental groups adding varying amounts of CB (M-CB series), and 5 groups adding both CB and rCF (M-BF series) (Table 4). The M-CB series aimed to investigate the influence of CB contents on the performance and structure of AAS mortars, while the M-BF series explored the impact of adding rCF in addition to CB. The alkali activator SSP content is expressed in alkali equivalent (Na2O wt%), accounting for 4.5 wt% of the weight of GGBS. The mixture of 90 wt% GGBS and 10 wt% SF is considered as cementitious material. The binder includes cementitious material and SSP. The water-to-cementitious material ratio is 0.420, the water-to-binder ratio is 0.378, and the mass of river sand is 1.5 times the mass of binder. PCE was added at 0.4 wt% of the binder mass. The amount of additive added is based on the weight of the cementitious material. Samples with different amounts of CB (0.2, 0.4, 0.6, 0.8, and 1.0 wt%) are labeled as M-CB2, M-CB4, M-CB6, M-CB8, and M-CB10, respectively. Samples with 0.8 wt% CB and varying amounts of rCF (0.2, 0.3, 0.4, 0.5, and 0.6 wt%) are denoted as M-BF82, M-BF83, M-BF84, M-BF85, and M-BF86. Table 4 presents the consumption of raw materials per cubic meter (kg/m3) for all samples.
Fabrication of mortar prisms
The raw material mixing process and sample preparation method employed in this study are illustrated in Fig. 9. Initially, GGBS, SF, PCE, and SSP solid powders were mixed using a JJ-5 cement mortar mixer at a slow speed for 3 min. Subsequently, water or an rCF suspension was added. For samples requiring rCF, rCF was pre-added to the needed water, followed by ultrasonic dispersion for 10 min. Then, hydroxyethyl cellulose (HEC) dispersant was added, and ultrasonic dispersion continued for 15 min to obtain an rCF suspension. Then, add defoamer (Tributyl Phosphate, TBP) to the rCF suspension and stir manually to reduce bubbles in the rCF suspension. After adding the rCF suspension to the dry mixture, the mixture underwent a first mixing step for 3 min, during which rCF was evenly dispersed in the GGBS paste, owing to the high viscosity of the GGBS paste17. Subsequently, CB was added, and a second mixing step was performed for 5 min to achieve a black slurry with a uniform color. River sand was added, and a third mixing step was conducted for 3 min to obtain fresh alkali-activated slag mortar. Finally, the paste was cast in oiled molds measuring 20 × 20 × 80 mm. The samples were covered with PE films until demolding after 24 h. Following demolding, the samples were placed in a curing chamber at a temperature of 25 °C and humidity of 100% for curing. Performance testing was conducted on the samples at 7 and 28 days.

As indicated by the arrows in the figure, the preparation process includes the steps of dispersing rCF (if any), dry mixing, there times of continuous mixing, and casting.
Testing methodology
As for powder materials characterization, the chemical composition of GGBS was analyzed using energy-dispersive X-ray fluorescence (XRF) testing conducted with a Bruker S2 PUMA system. The particle size of the raw materials was determined using a Malvern Mastersizer 3000 laser diffraction particle size analyzer, with the average value obtained from three wet tests. Deionized water was used as the solvent. XRD curves were obtained using a Powder X-ray Diffractometer (Bruker D2 PHASER with LYNXEYE XE-T detector), with a scanning range of 7–60°.
When the samples reached 7 or 28 days, a flexural strength test was performed on the prismatic samples (20 mm × 20 mm × 80 mm) using an MTS three-point bending experimental device. The loading unit was a 100 KN servo machine, and the loading rate was set at 0.1 mm/min. The average of three test values was calculated. At 28 days, a compressive strength test was conducted on the cubic samples (20 mm × 20 mm × 20 mm) using the MTS system, with a 0.1 mm/sec loading rate. The average of six readings for each group was recorded as a result.
For vision-based analysis of pores, we used a digital camera and ImageJ software to analyze the larger pores in sample sections quickly. First, the samples were cut into 2 cm × 2 cm × 1 mm slices and soaked in isopropyl alcohol solution for 7 days to remove moisture. After 14 days of vacuum desiccation, the samples were positioned horizontally on a shooting stage with overhead and side light sources. This setup caused pores to appear as black voids while solid surfaces retained their original colors (Fig. 10). High-definition images were taken of the sample slices with a digital camera. Subsequently, ImageJ software was employed to process the images, including grayscale adjustment, threshold segmentation, particle selection, and color assignment, enabling pore distribution and size analysis. The white circles in the lower image of Fig. 10 represent pores within slices of the M-CB series.
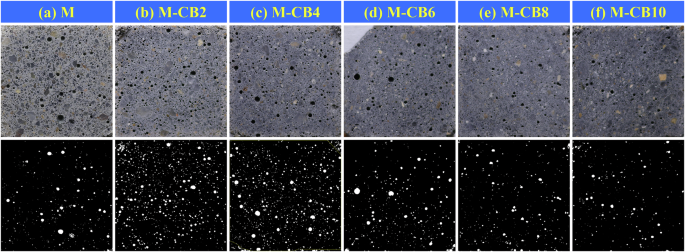
a M, b M-CB2, c M-CB4, d M-CB6, e M-CB8, and f M-CB 10.
The sample’s porosity, characteristic pore diameter, and other parameters were determined using mercury intrusion porosimetry (MIP). Previous studies indicate that testing samples under load can coarsen the pore structure, particularly in the macropore range, due to microcrack generation during crushing59. This study employed the sawing method to preserve the original pore structure. Prisms aged 28 days were sawed into 1 cm3 cubes for MIP testing. A mercury intrusion tester (Mike AutoPore IV 9500) was utilized, with pressure ranging from 0.23 to 33,000 psi, corresponding to measured pore diameters ranging from 800 μm to 5 nm. Testing was conducted at a temperature of 25 °C. The contact angle between mercury and pores was 130°, with a surface tension of 0.485 N/m.
The water absorption test of the samples largely adhered to the procedures outlined in ASTM C642. Initially, the sample, which was 28 days old, was placed in an oven at 105 °C for 24 h to dry. Subsequently, after cooling naturally, the mass of the sample (m1) was recorded. Next, the sample was immersed in water at 21 °C for a minimum of 48 h. Following immersion, the surface was dried using a wet towel, and the post-immersion weight (m2) was recorded. The immersion water absorption rate of the sample could then be calculated as follows:
Each set of samples was tested using three replicate samples, and the average value was calculated.
The 28-day-old samples were sliced into 2 cm × 2 cm × 1 mm pieces. Subsequently, these slices were immersed in an isopropyl alcohol solution for 7 days and then transferred to a vacuum desiccator for 14 days to dry. Following drying, the wettability of the sample surface to water was analyzed using a contact angle measurement device (Lauda Scientific LSA100, Germany).
The samples at 28-day underwent a similar process, where they were cut into 1-mm-thick slices and immersed in an isopropyl alcohol solution for 7 days. Then, they dried in a vacuum desiccator for 14 days. Subsequently, cutters were used to trim them to a suitable size for observing both the surface and cross-section. The morphology and structure of the samples were then observed using an Environmental Scanning Electron Microscope (FEI/Philips XL30 ESEM-FEG).
Responses