Prediction of individual patient outcomes to psychotherapy vs medication for major depression

Introduction
Major depressive disorder (MDD) is a leading global cause of disability-adjusted life-years lost and currently afflicts over 300 million people1. There are multiple empirically validated and commonly administered treatments available for MDD, yet first-line treatments typically lead to a remission rate of around 30–45% regardless of treatment type2,3. Although there are patients who respond better to psychotherapy than medication, and vice versa, overall outpatient treatment response rates to these interventions are similar. Furthermore, there remains no established method for selecting the treatment most likely to be helpful at the individual level4, leading to the current burdensome and inefficient trial-and-error approach to MDD treatment5. It is widely believed there are individual differences between patients that drive differential responses to treatment which, if appropriately measured, could allow prospective prediction of treatment outcomes and, consequently, personalized treatment recommendations6. Such differences include symptom profile and severity, neurocognition, daily functioning, personality, comorbid physical and psychiatric conditions, family history, early and recent environmental exposures, dysfunctional cognitive schemas, and protective factors7.
Efforts to identify prospective variables that may predict response have mostly focused on non-specific prognostic factors that apply across all treatments or variables that predict better or worse outcomes to one type of treatment (e.g., a specific antidepressant medication (ADM) or one form of psychotherapy)6,8,9. Candidate measures have included a wide range of clinical, demographic, biological, genetic, and neuroimaging variables, analyzed through univariate, multivariate, and interaction analyses6,8,9. Such efforts, though informative, do not address the fundamental clinical need, which is to develop treatment moderators that can inform recommendations between efficacious treatments. Identifying variables that predict outcomes to only one treatment does not provide information about whether any alternative treatment is more or less likely to prove beneficial compared to the treatment analyzed. Compared to single-treatment predictor research, only limited work to identify treatment selection moderators has been conducted and no such tools have been adopted into clinical use8,10.
Due to the development of machine learning (ML) algorithms that are designed and optimized for prediction rather than inference and that can detect complex and nonlinear interactions between large numbers of variables, more recent prediction efforts have employed various ML methods to identify algorithms to predict depression treatment outcomes10,11,12,13,14,15. There have been promising results from a number of studies using ML, though rigorous validation methods are required to ensure that the predictors are not driven by idiosyncrasies in the data from which they were derived. The gold standard for validation is to test a model’s performance in independent samples (external validation), even above internal cross-validation10, but this step faces the significant challenge of identifying datasets that have all the variables that were used in the training sample and are large enough to maximize the robustness and generalizability of predictions. Limited power and variability across clinical samples can lead to a lack of external validation, even after finding promising results using internal cross-validation16.
The most common ML prediction of depression treatment response studies to date has attempted to predict response to ADM. A seminal analysis in the sequenced treatment alternatives to relieve depression (STAR*D) trial identified a set of 25 pre-treatment variables that could predict remission to citalopram with an accuracy of 65%14. This model was validated in independent samples with two similar medication treatments, and an updated version of the model targeting treatment-resistant depression has demonstrated external validation in two other independent samples17,18, though it has not become available for clinical use14. An analysis of the genome-based therapeutic drugs for depression (GENDEP) trial, which compared escitalopram vs nortriptyline, used a set of variables to successfully predict within the escitalopram treatment arm, the model was not externally validated19. Other studies have used ML algorithms to predict neural signals, such as electroencephalogram patterns20, that predict treatment response to ADM. Thus, there are several promising directions in ML-derived prediction of ADM response, though no one particular algorithm has resounding empirical support nor developed moderators between treatment options.
Psychotherapy researchers also have used a variety of ML methods to develop treatment response prediction. A recent review identified 44 such studies, though only seven established the algorithm’s feasibility and only three that used external validation15. One group built two models that performed better than a null model using depression severity measured partway through treatment to predict remission to psychotherapy21. Another group found that the prediction of reduction of anxiety and depression symptoms after psychotherapy (vs no reduction or rise) could be predicted with an accuracy of 75%22. Thus, similar to ML approaches to predicting ADM response, there is some evidence for the utility of ML approaches for predicting psychotherapy outcomes, yet no approach has been convincingly established.
A notable effort to develop moderators to psychotherapy or ADM medication outcomes, called the Personalized Advantage Index (PAI), used a generalized linear model approach. The original PAI tool used predictive variables to define “optimal” vs “non-optimal” treatment for individuals, finding a significant difference in end-of-treatment depression severity scores (d = 0.58)23. A more recent study applied an ML approach to variable selection for the PAI to predict response to sertraline vs placebo. This PAI used a different set of predictor variables with no external validation24. Another study applied an ML approach to the PAI, reporting differential outcomes to optimal and non-optimal application of CBT or interpersonal therapy (IPT) in two independent trials but ultimately found there was no significant difference between those receiving optimal and nonoptimal treatment25. Another study used an ML approach in a retrospective analysis of archival data (i.e., non-randomized treatment) to differentiate responses to CBT or person-centered counseling for depression by deriving a PAI comprised of yet another set of variables, reporting higher remission rates in optimal treatment vs nonoptimal treatment groups with internal cross-validation26. The PAI approach provides a useful framework for developing a single continuous measure to differentiate responses between two treatments, yet PAI studies have never been externally validated, have large inconsistencies in variables included in the PAI prediction, typically combine those variables using linear regression, and use a uniform highest 60% of PAI scores as the optimal treatment cutoff rather than empirically evaluate the most appropriate cut-point.
Despite the research that has advanced ML approaches to predicting MDD treatment outcomes, no studies appear to have used a ML approach to address treatment selection between psychotherapy and ADM. Yet, the decision between whether to pursue psychotherapy or ADM as a first line treatment remains the most common decision made by treatment-seeking depressed individuals and their clinicians. A tool to inform patients and their providers whether they are more likely to respond to psychotherapy vs medication would have great clinical value, reducing ongoing suffering, role impairment, adverse events, and potential suicide risk stemming from the application of treatments that would prove ineffective25.
The current study uses clinical and demographic data from two existing RCTs with nearly identical measures that randomized MDD patients to receive either CBT or ADM medication: the Prediction of Remission to Individual and Combined Treatments (PReDICT) study27 and a study we reference as the positron emission tomography (PET)-predictor study28.
The purpose of the current study is to apply an ML approach to: (1) develop algorithms that predict CBT and ADM outcomes in the PReDICT sample; (2) develop a treatment recommendation tool that compares patients’ predicted responses to each treatment to make a recommendation; and (3) externally validate both the treatment response prediction and treatment recommendation tool in the PET-Predictor study. This study makes four advances over extant literature. First, we aimed to develop and validate ML algorithms using the same pool of variables to predict response to both CBT and medication for MDD, which appears to have never been done. Second, we aimed to develop and validate a treatment recommendation tool comparing CBT and medication, which, despite its value, has never been developed to the point of external validation. Third, participants in the PReDICT study who did not remit to treatment were offered the chance to receive combined treatment; therefore, we were able to determine whether individuals who did not remit to initial treatments differed in response to combined treatment as a function of whether they initially received their algorithm-recommended treatment. Finally, we used a novel application of an established ML method, partial least square regression (PLSR), which previously had not been used to predict MDD treatment outcomes. Although PLSR differs from more recently developed black-box and nonlinear ML techniques that incorporate deep learning or ensemble techniques, its capacity for data-driven predictive modeling and handling of high-dimensional, multicollinear data aligns with key principles of machine learning, making it a suitable choice for this novel application.
Results
The demographic and clinical characteristics of the two study samples are presented in Table 1.
Partial least squares regression in the PReDICT sample
PLSR was run separately for the CBT (N = 72), escitalopram (N = 92), and duloxetine (N = 84) treatment groups. In the CBT group, the best fitting model had 1 component and explained 39.7% of the variance of HAMD-Outcome (p = 3.062E-9), with a balanced accuracy for predicting remission of 73% (95% CI: 61.8–81.9%) (Sensitivity: 70%, Specificity: 76%). In the escitalopram group, the best fitting model also had 1 component and explained 32.1% of the variance of HAMD-Outcome (p = 3.964E-9) with a balanced accuracy of predicting remission of 61% (95% CI: 50.8–70.3%) (Sensitivity: 56%, Specificity 66%). In the duloxetine group, the best-fitting model had 2 components that jointly explained 67.7% of the variance in HAMD-Outcome (p = 6.1397E-23) with a balanced accuracy of predicting remission of 81% (95% CI: 71.3–88.0%) (Sensitivity: 84%; Specificity: 78%). The total predictive balanced accuracy for remission across all groups was 71% (95% CI: 65.2–76.2%) (Sensitivity 70%, Specificity: 73%). Thus, sensitivity and specificity were quite balanced. The items that loaded onto each component were examined (see Supplemental Tables 1 and 2).
Simulated treatment recommendation in PReDICT sample
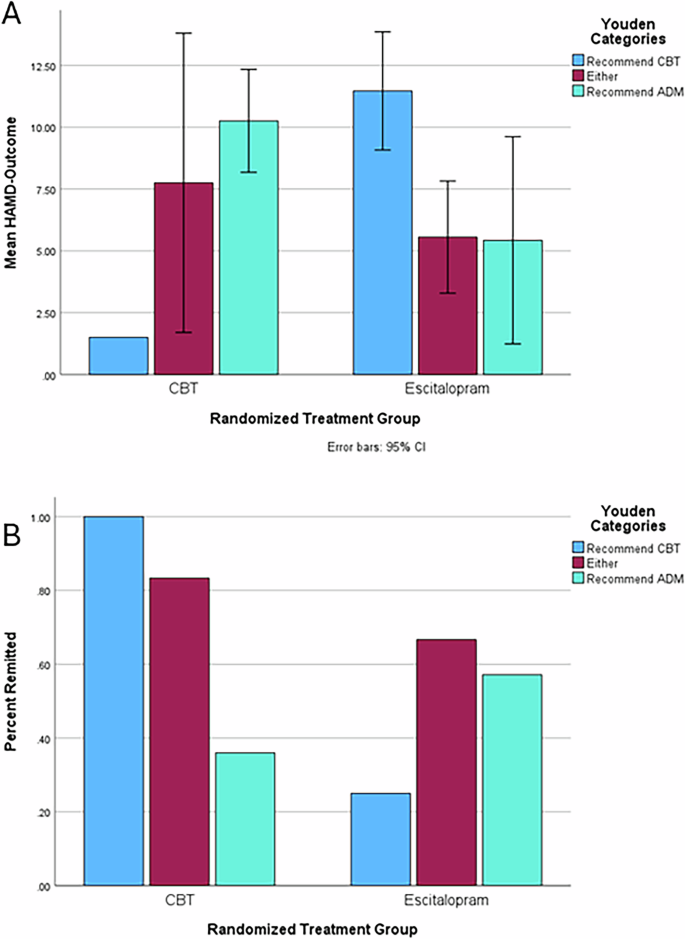
We created individual treatment recommendations for each participant based on their PLSR-derived predicted treatment responses. First, we created a difference score by subtracting the predicted CBT HAMD-Outcome from the predicted ADM HAMD-Outcome. Next, we calculated the maximum Youden index29 to find the value of this continuous variable with the highest sensitivity and specificity in predicting true treatment response to ADM and CBT separately. This yielded a grouping variable with three categories: Recommend CBT, Either, and Recommend ADM (see “Methods” section for full description).
Mean HAMD-Outcome values and ANOVA test statistics are available in Supplemental Table 3 and plotted in Fig. 1A. Combining across groups such that individuals in the “Either” category were considered to have gotten a recommended treatment, an independent t-test revealed that participants who received the recommended treatment (N = 184) and those who did not (N = 64) had significantly different HAMD-Outcome scores (means of 7.1 and 11.7, respectively, t = 5.5, p = 7.3206E-8, Hedge’s g = 0.80). Individuals who received matching CBT or ADM treatment had highly significantly better HAMD-Outcome scores than those who did not receive the recommended treatment with large effect sizes (for Recommend CBT: Hedge’s g = 2.81, p = 0.003; for Recommend ADM: Hedge’s g = 1.92, p = 0.00001). As a direct test of moderation, we conducted a 2 × 3 (CBT/ADM × Recommend CBT/Either/Recommend ADM) ANOVA for HAMD-Outcome, finding no main effect of recommendation category (F = 0.95, p = 0.39) or treatment type (F = 2.26, p = 0.13; mean HAMD-Outcome scores: CBT 9.4, escitalopram 8.1, duloxetine 7.7) but a highly significant interaction between them (F = 17.41, p = 8.65E−8). Of note, a recent study established a threshold for clinically meaningful change in HAM-D scores as 3.930, which indicates that the difference in receiving recommended treatment is clinically significant.

A Mean end-of-treatment depression severity (HAMD-Outcome) by treatment and recommendation group. Error bars represent 95% confidence intervals. B Percent remitted by treatment and recommendation group.
We next examined the remission rates across groups (see Fig. 1B). Again, participants who received the recommended treatment had higher remission rates (59% vs 33%, p = 0.002) than those who did not. The matched-to-recommendation outcomes were superior to the overall remission rates within the actual treatment groups: escitalopram (47%), CBT (42%), duloxetine (55%), and study-wide (48%). This led to a study-wide absolute improvement in remission rate of 11% which translates to a number needed to assess of 9.1.
Phase 2 and recurrence analyses in PReDICT
In phase 2 of PReDICT, patients who did not remit in phase 1 were offered combined CBT and ADM treatment. We examined whether patients who received matching (i.e., received the recommended treatment) vs mismatched treatment in phase 1 differed in outcomes during phase 2 treatment. Patients with a treatment mismatch in Phase 1 (and thus received matching treatment in Phase 2) had a significantly greater decrease in HAMD-Outcome during Phase 2 (N = 34, M = −8.06) compared to patients who entered Phase 2 after having received their matching treatment in phase 1 in an independent t-test (N = 63, M = −4.84) (p = 0.001, Hedge’s g = 0.65). Although the cell sizes are small, leading to low power, exploratory comparisons within the Recommend ADM (Phase 1 Matching N = 37, M = −4.0 vs Phase 1 Mismatched N = 23 M = −8.7, p = 0.0003, g = 0.87) and Recommend CBT (Phase 1 Matching N = 1, M = 0 vs N = 11, M = −6.7, p = N/A, g = 1.01) groups showed similar patterns. The Either group received matching treatment in both phases by definition (N = 55, M = −6.3). Further, there was no significant difference in the overall change in HAM-D from baseline to end of Phase 2 between those who initially had matching vs mismatched treatment (p = 0.23), indicating that the order of receiving the recommended treatment first or as a combined treatment was not related to outcome, only that the largest portion of the improvement that occurred was during the phase in which the patients received the recommended treatment.
We also compared 18-month recurrence rates between matched and mismatched treatments. Among patients who remitted in phase 1 and entered follow-up (i.e., never received combined treatment), the recurrence rate was significantly higher for patients who received a mismatched treatment (N = 18, recurrence = 22.2%) compared to those who received matching treatment (N = 93, recurrence = 8.6%) (p = 0.045, Hedge’s g = 0.44). Including those who also participated in Phase 2, the recurrence rate was still significantly higher for patients with mismatched Phase 1 treatment (N = 44, recurrence = 22.7%) compared to those with matching treatment (N = 147, recurrence = 12.2%) (p = 0.043, Hedge’s g = 0.30). These differences were present both within the Recommend ADM (Phase 1 Matching N = 86, M = 12.8% vs Phase 1 Mismatched N = 30 M = 26.7%, p = 0.039, g = 0.34) and Recommend CBT (Phase 1 Matching N = 6, recurrence = 0% vs N = 14, recurrence = 14.3%, p = 0.08, g = 0.39) groups, although the sample size in the Recommend CBT group is small leading to underpowered analyses. The Either group (N = 55) had a 12.7% recurrence rate.
Partial least squares regression in PET-predictor sample
We applied the algorithm derived from the PLSR analyses in the PReDICT sample to the same variables in the PET-Predictor sample in order to predict HAMD-Outcome in this sample. In the PET-Predictor sample, the PReDICT-derived CBT predictor variable explained 9.0% of the variance (p = 0.047) of HAMD-Outcome in the CBT group, with a balanced accuracy of predicting remission of 66% (95% CI: 48.7–79.9%) (Sensitivity: 40%, Specificity: 94%). The ADM predictor variable explained 23.7% of the variance of HAMD-Outcome (p = 0.01) with a balanced accuracy of 69% (95% CI: 50.8–83.8%) (Sensitivity: 71%, Specificity: 67%). The total predictive balanced accuracy in the PET-Predictor sample was 67.5% (95% CI: 51.3–74.2%) (Sensitivity: 55%, Specificity: 80%). Thus, performance was stronger for specificity than sensitivity unlike in the PReDICT sample.
Simulated treatment recommendation in PET-predictor sample
For external validation, we applied the maximum Youden Index values derived from the PReDICT sample to the analyses of the PET-Predictor sample. Importantly, overall sample sizes and cell sizes are small, and thus, the precision of the estimates is notably lower than in the PReDICT sample meaning that some caution should be taken in interpreting the results comparatively. The mean HAMD-Outcome scores and test statistics from independent-sample t-tests for these groups are available in the Supplemental Table 4 and plotted in Fig. 2A. Individuals receiving matching treatment improved much more than those receiving mismatched treatment for both CBT (g = 0.81, p = 0.02) and ADM (g = 0.95, p = 0.02). Combining across groups, those who got the recommended treatment (M = 5.9, SD = 4.3) had a much lower HAMD-Outcome than those who did not (M = 10.7, SD = 4.8) and this difference (p = 0.000087, Hedge’s g = 1.03) had a large effect size. As another direct test of moderation, we conducted a 2 × 3 ANOVA for HAMD-Outcome, finding no main effect of recommendation category (F = 0.34, p = 0.71) or treatment type (F = 0.26, p = 0.61; mean HAMD-Outcome scores: CBT 9.5, escitalopram 8.5) but a significant interaction between them (F = 4.02, p = 0.02), indicating again that patient’s responses were sensitive only to whether their treatment type matched the recommended treatment.
A Mean end-of-treatment depression severity (HAMD-Outcome) by treatment and recommendation group. Error bars represent 95% confidence intervals. B Percent remitted by treatment and recommendation group.
Finally, we examined the remission rates in the PET-Predictor sample (see Fig. 2B). This yielded sizeable differences between remission rates among those who received the recommended treatment and those who did not for both CBT (86% vs 25% remission) and ADM (63% vs 36%). Combining across treatments and comparing with a chi-square test, those who got their recommended treatment remitted (70% vs 31%, p = 0.004) at much higher rates than those who did not. For comparison, the PET-Predictor remission rates were as follows: CBT (47%), escitalopram (44%), and study-wide (45%). This represents a 25% absolute improvement in remission rates over random assignment, which translates to a number needed to assess in 4. Taking the mean HAMD-Outcome and remission rates together, these simulated treatment recommendation results using the Youden strategy represent a marked improvement over the random assignment to treatment in identifying those likely to both respond well and poorly to CBT vs medication in a fully independent, non-treatment naïve sample. Thus, this constitutes highly promising evidence of utility for this PLSR-derived treatment recommendation tool.
Discussion
In this study reporting on patients with MDD, we used an ML algorithm, PLSR, to predict treatment outcomes to CBT, duloxetine, and escitalopram. This process produced variables with a high level of variance explained in the end-of-treatment depression severity and predicted remission with accuracies in the 60–72% range. We then simulated treatment assignments and compared HAMD-Outcome scores between those who were randomized to receive the treatment that did and did not match their recommended treatment. We found that individuals who had matched treatment had much better HAMD-Outcome scores and remission, response, and recurrence rates than those who received mismatched treatment, with large effect sizes. We also found that individuals who received combination treatments but received mismatched treatment initially had better treatment outcomes when their recommended treatment was added and had higher recurrence rates during follow-up. In our external validation analyses there was a similar level of accuracy for predicting remission, although there was some deterioration of predictive power of treatment outcome in the PET-Predictor sample using the algorithms and threshold recommendation scores developed in the PReDICT sample. Again, we found that, after simulating treatment recommendations, there were much better HAMD-Outcome values and remission and response rates for those with matched treatment, in parallel to the PReDICT sample results. This external validation for the treatment recommendation tool in an independent sample demonstrates its great potential value to inform treatment decisions between CBT and ADM.
Notably, the improvement between matched and mismatched treatment in both samples was in the range of meaningful and clinically significant change established in a recent study30, meaning that this level of difference is associated with clear quality of life differences along with symptom change. Although we have created categorical cutpoints along the difference score between predicted HAMD-Outcome for CBT and ADM for the purposes of statistical comparison and informing dichotomous decision-making, application in clinical practice may be less simplified. One might envision that the difference score itself, the degree of predicted improvement regardless of modality, and patient preference may provide valuable information that clinicians and patients could use to inform clinical decision-making. For example, an individual in the Recomommend ADM group may have a very large difference in predicted HAMD-Outcome for ADM compared to CBT or a difference just above the threshold, which may influence decision-making differently than a categorical designation. With larger samples and further validation, this approach has the potential to provide more granular and nuanced information to those who would want it alongside a more simplified categorical recommendation.
These results represent advances over the extant literature involving the development of ML-derived prediction of MDD treatment response10,14,21,22,25 due to several factors. First, we were able to develop and validate algorithms predicting responses to both CBT and antidepressant medications using the same pool of variables. These items are drawn from easily and commonly administered clinical measures and demographic information. Thus, providers could predict an individual’s likely outcomes to CBT or ADM by administering one item pool and receiving predicted values for both treatments.
Examining the individual loadings of each item onto the predictor variables revealed several notable patterns. Generally, higher levels of depression symptoms were indicative of poorer response to all treatments. Likewise, high levels of life functioning were indicative of better outcomes for all treatments. Higher levels of childhood trauma and worse childhood family functioning appeared to be indicative of better treatment response for duloxetine but worse treatment response for CBT. Higher levels of somatic symptoms (e.g., reduced appetite, agitation, lassitude, insomnia) also were indicative of better duloxetine response but worse treatment response for CBT and escitalopram. Low mood seemed more important for poor medication response than poor CBT response. It also appeared that high anxiety was related to poorer duloxetine response but was not as predictive of escitalopram or CBT response. Also, we found some parallels in predictive variables with other studies using ML. For example, depression severity, psychomotor agitation, and reduced energy were predictive of ADM response in the STAR*D trial14 and similar symptoms along with reduced interest, indecisiveness, anxiety, and pessimism predicted escitalopram response in another study19. These items loaded onto the predictor variables from this study, in some cases more strongly for the duloxetine and escitalopram variables. Meanwhile, several studies found that depression and anxiety symptoms, life events, social support, and deprivation were predictive of psychotherapy response21,22. These items also loaded onto the predictor variables from this study, in some cases more strongly for the CBT predictor.
The second advance of this study over the extant literature is the development of a tool to recommend CBT or ADM for MDD. The critical and common clinical decision between pursuing psychotherapy or ADM treatment may be informed by this tool and thus crucial time, expense, and effort could be saved for both patients and providers if our findings continue to be validated.
The third advance of this study is the finding that those who receive treatment matching their recommended treatment are less likely to have a recurrence of depression and that those who receive a mismatched treatment are more likely to respond to combined treatment than those who were already receiving their recommended treatment. These findings imply that matching treatment leads not only to better immediate treatment response but lower chance of depression returning, regardless of treatment modality. If this is the case, it underscores the importance of receiving the recommended treatment and may partially explain why some individuals have a recurrence of depression even after remitting to a non-optimal treatment.
Combination treatment of MDD in comparison to single-modality treatment is often found to be more effective31, as is stepping up to combined treatment after initial treatment failure to psychotherapy or ADM32. Yet even combined treatment does not lead to remission for all patients33 and up until now little has been established as to why some patients respond better than others to combined treatment after treatment failure. Our findings imply that, if individuals are not receiving their recommended treatment, adding it may be more fruitful than adding another mismatched treatment.
A final advance of the current study is the use of PLSR, an ML method that, to our knowledge, has not previously been applied in treatment prediction for MDD. Further, we established an analytic pipeline that could be applied to developing tools to predict response and recommend decisions between any two treatments with sufficient data: (1) develop separate PLSR algorithms that predict outcomes for each treatment; (2) derive a difference score between the treatment types and use the maximum Youden Index to establish cut-points for treatment recommendation; and (3) externally validate treatment outcomes and treatment recommendation in an independent sample.
There are several issues to consider regarding the clinical significance and potential utility of this approach. First, although 151 total variables were included, 36 did not load on any component, so only 115 would be necessary. That being said, further item reduction and, therefore, patient burden would be critical to adoption. One of our planned future directions for this work is to determine to what degree the number of items can be further reduced while maintaining acceptable performance metrics.
Several limitations apply to our results. First, we did not have a validation sample with patients who were treated with duloxetine, despite our prediction of duloxetine response in the PReDICT sample being the strongest. Second, although we validated our predictions in a non-treatment naïve sample, our samples did have exclusion criteria that potentially limited their generalizability to individuals with higher levels of treatment resistance, an active substance use disorder, or who are actively suicidal. Third, it is possible that other ML methods may provide improved performance. We chose PLSR due to its ability to address collinearity and high-dimensionality, as well as to perform well with smaller sample sizes and provide more interpretable components that drive the relationship between predictors and outcomes. Nevertheless, future work could improve on these results by applying various other approaches. Finally, the sample sizes of both the PReDICT and PET-Predictor samples are smaller than those seen in other ML studies, which could lead to concerns of power issues. In smaller samples, ML methods may overfit the data due to the relative lack of diversity of data available to the model, causing too much weighting on the particular nuances of this sample. This likely explains the deterioration in variance explained, and the size of the PET-Predictor sample raises the possibility that the degree validation in that sample is influenced by chance. Further, it may be the case that there are more items with a small effect that our sample sizes were too small to detect. Also, there may be relevant variables that were not available in these samples that could improve prediction. Conversely, the level of performance of our approach in a small validation sample could also indicate the strength of the signal being detected. Larger sample sizes may yield more accurate and stable predictions of treatment response by allowing for the detection of these effects.
We believe that our results represent a highly promising potential advancement for personalized medicine in the treatment of MDD. Future work is essential to establish the replicability and accuracy of our treatment recommendation tool as well as to determine how generalizable this tool is across treatment modalities, patient populations, and provider orientations. Also, this tool could be combined with prediction algorithms from sources such as genomics, brain imaging, and EEG to further improve the prediction of response through a more comprehensive approach. For example, much work has been done establishing the existence of neural signatures of general and differential treatment response34,35; future work should explore the degree to which the components derived from this study align with such signatures, have an additive or multiplicative degree of prediction, or are worthy targets themselves of research to determine their neural correlates.
Methods
PReDICT participants and procedures
The design and results of the acute phase of treatment of the PReDICT study have been published2,27,33. The study aimed to identify predictors and moderators of outcomes to first line treatments for MDD. Briefly, from 2007 to 2013, PReDICT enrolled 344 adult outpatients ages 18–65 who met DSM-IV-TR criteria for MDD without psychotic features. Eligible participants were treatment naïve, defined as having had no prior treatment for a mood disorder with either medication or evidence-based, structured psychotherapy (e.g., CBT, interpersonal therapy, or behavioral marital therapy) for more than four weeks. Key exclusion criteria included any significant medical condition that could interfere with study participation, current obsessive-compulsive disorder, eating disorder, substance dependence, or dissociative disorder in the year before screening, or substance abuse within the 3 months prior to baseline. Total scores ≥18 at screening and ≥15 at baseline on the 17-item Hamilton Depression Rating Scale (HAM-D)36 were required for randomized assignment to a treatment group.
Patients were randomly assigned in a 1:1:1 ratio to receive 12 weeks of acute treatment with flexibly dosed escitalopram (10–20 mg/day), duloxetine (30–60 mg/day), or 16 one-hour individual sessions of protocol-based CBT37. For the current analysis, we used treatment completers with all data available (N = 92 for escitalopram, N = 84 for duloxetine, N = 72 for CBT). Patients completed baseline measures (outlined below) on the same day as randomization. The HAM-D was subsequently administered at weeks 1–6, 8, 10, and 12. Non-remitters at week 12 were offered the option of entering phase 2, a 12-week treatment period in which they received a combination of medication and CBT33. In this phase, patients who initially received escitalopram or duloxetine continued their medication and added 16 sessions of CBT. Patients who initially received CBT received three booster CBT sessions and one possible crisis session during the 12 weeks and added escitalopram 10–20 mg/day. Duloxetine was not included in Phase 2 because we expected an insufficient number of patients during Phase 1 whose depression did not remit to CBT to power meaningful comparisons between the two medications. The HAM-D was administered at weeks 13–18, 20, 22, and 24. Long-term follow-up was offered to patients who had remitted at week 12 and to non-remitters who responded to combination treatment at the end of phase 2. Long-term follow-up involved assessment for recurrence using the Longitudinal Interval Follow-Up Evaluation at 3-month intervals until 24 months from the patient’s baseline study visit38.
Visits with the study clinicians who administered the pharmacotherapy were conducted according to the guidelines recommended by Fawcett and colleagues39. These clinicians were not permitted to provide specific evidence-based psychotherapeutic interventions, including CBT-related interventions, other than general psychoeducation. For the CBT therapists, competence in administering protocol-based CBT was assessed by independent raters at the Beck Institute by viewing video-recorded sessions (sessions 2, 8, and 12) and rating 11 components of CBT treatment. Any therapist found to have below-threshold scores (<40) for a session received additional training and supervision at that time. Other psychotropic medications were not permitted during the study, except for hypnotic medications (excluding benzodiazepines), used up to three times weekly.
PET-predictor study participants and procedures
The design of the PET-Predictor study, which ran from 2007 to 2012, has been previously published28. This study aimed to determine whether a pre-treatment brain metabolic activity signal as measured by PET could identify those patients likely to remit to treatment with CBT or escitalopram. The clinical assessment schedule was identical to that used in PReDICT. Enrollment criteria were also similar, with the exception that the age range was 18–60 and patients were not treatment naïve; the only treatment history exclusions were any history of treatment failure with ≥4 CBT sessions for depression or ≥6 weeks of escitalopram, or electroconvulsive therapy. Patients were randomly assigned to three treatment conditions in a 1:1 manner: a 12 week course of escitalopram (10–20 mg/day); or CBT (16 one-hour individual sessions). Thirty-two completers in each treatment arm had usable data for the current analysis.
Both studies were approved by the Emory Institutional Review Board, and all patients provided written informed consent prior to beginning study procedures.
Measures
The analyses included all demographic variables, clinical variables, and baseline visit item-level responses on the scale-based measures, as detailed below.
All demographic variables were based on responses to a self-report form and included biological sex, age, race, ethnicity, family history of mood disorder, family history of MDD, family history of bipolar disorder, family history of psychotic disorder, education level, and marital status. Clinically assessed variables included lifetime number of suicide attempts, lifetime number of major depressive episodes, presence of current anxiety disorder, lifetime presence of a substance use disorder, and weight.
Clinician-administered measures included the following: the 17-item HAM-D36 is a clinician-administered interview that evaluates the severity of depression by assessing symptoms of depressed mood, guilt, suicidality, insomnia, agitation or retardation, anxiety, difficulty functioning, and somatic symptoms. The Montgomery–Åsberg Depression Rating Scale40,41 is a 10-item clinician rating scale particularly sensitive to changes during pharmacologic treatment and was delivered using a structured interview guide42 (Williams & Kobak42). The Hamilton Anxiety Rating Scale (HAM-A)43 is a 14-item clinician-administered scale that assesses a broad range of psychic and somatic anxiety symptoms33.
Self-report measures included the following: the Quick Inventory of Depressive Symptomatology, Self-Report (QIDS-SR)44 is a patient-completed questionnaire of 16 items designed to assess the nine symptom domains of DSM-IV-defined major depressive episodes. The Beck Depression Inventory (BDI-I)45 is a 21-item self-report measure of depression severity with excellent psychometric properties. The Childhood Trauma Questionnaire-Short Form (CTQ)46 is a commonly used 28-item scale that is validated and has high test-retest reliability. The Klein Trauma And Abuse-Neglect measure47 is a 7-item measure that aims to assess death, divorce, abandonment, or separation from parents as well as abuse, neglect, and sexual trauma. The Sheehan Disability Scale (SDS)48 is a composite of three self-rated 10-point Likert scale response items that aim to assess impairment in work/school, family, and social functioning. The Quality of Life Enjoyment and Satisfaction Questionnaire Short Form (Q-LES-Q)49,50 is a 16-item self-reported questionnaire that evaluates overall enjoyment and satisfaction with physical health, mood, work, household and leisure activities, social and family relationships, daily functioning, and overall well-being.
The study protocol identified the primary outcome as symptomatic remission, defined as a HAM-D score ≤7 at both weeks 10 and 12. In order to create a continuous measure of symptom improvement that matched the definition of remission, the average of the week 10 and 12 HAM-D scores (hereafter referred to as HAMD-Outcome) was used as the dependent variable in all PLSR analyses. For completeness, similar analyses were performed for the outcome of response (defined as a >=50% reduction in HAM-D score from baseline to week 12), which are reported in the Supplement.
Data analysis
The first phase of data analysis used PLSR51, an ML data analytic technique that is designed to address the situation in which there are many, possibly correlated, predictor variables and one or a few dependent/outcome variables. It models relationships between sets of observed variables with latent variables by decomposing the covariance among predictor variables into orthogonal components and loadings onto components. This reduces the effect of multicollinearity among predictor variables and models that share information about those variables. PLSR aims to take into account information on both predictor and outcome variables in the definition of factors and loadings to maximize the prediction of the outcome variable. It is particularly well-suited for high-dimensional, co-linear datasets in which there are more variables than participants and performs particularly well in comparison to other methods when sample sizes are below 25052. The R package “pls” was used to complete PLSR53.
The procedure for the PReDCT PLSR analysis was as follows. First, data were prepared by creating three data files, one for each PReDICT treatment condition, with data for each participant who completed treatment and had data available on all 151 variables (i.e., all demographic and clinical variables and items from each measure described above). In each case, the dependent variable was the HAMD-Outcome score. Second, separate PLSR models were run with one component up to 50 components for each treatment condition to determine the number of components that best fit the data. These models used 5-fold cross-validation. The model chosen as the best-fitting model was selected by comparing the root mean squared error of prediction (RMSEP) among models with differing numbers of components. The model with the lowest RMSEP was selected for each of the three PLSR analyses. The “pls” package reports the percentage of variance of the dependent variable explained by the combined components. We also calculated predictive accuracy for remission by determining how many individuals were correctly predicted to have a HAMD-Outcome ≦7 vs correctly predicted to not remit. Next, item loadings onto components were inspected for interpretation of the components. Individual scores for each PLSR component were carried forward as predictor variables.
The second phase of PLSR analysis used the PET-Predictor data set as test data to evaluate the PLSR models generated using the PReDICT data. Data were prepared by creating two data files for the CBT and escitalopram treatment conditions of the study (N = 32 for each). Then, the “predict” function of the pls package was used to output predicted HAMD-Outcome values for each participant for each treatment type (i.e., each individual had a predicted outcome score on the HAM-D to escitalopram, duloxetine, and CBT). The percentage of the variance of true HAMD-Outcome explained by these predicted scores was examined. This same method was also used to assess the counterfactual outcomes by predicting HAMD-Outcome for treatments not received in the PReDICT sample (e.g., predicted response to CBT for participants who received duloxetine).
The final phase of data analysis involved simulating the use of the PLSR predictor variables as a treatment recommendation tool. This was done using two strategies.
The first strategy involved calculating the maximum Youden index29 to find a value with the highest sensitivity and specificity in predicting remission. We combined the duloxetine and escitalopram arms for this analysis. This was done for several reasons: (a) the Youden index requires a dichotomous decision variable; (b) previous analyses in the PReDICT study have combined medication groups34; (c) a priori treatment decisions made by depressed individuals and practitioners are often between whether to begin treatment with psychotherapy or medication broadly; and, (d) this allowed us to examine Phase 2 treatment response, in which all CBT non-remitters received escitalopram treatment but those who received duloxetine in Phase 1 continued taking it. We calculated a difference score by standardizing the predicted HAMD-Outcome for CBT and ADM, then subtracting the predicted HAMD-Outcome for ADM from the predicted HAMD-Outcome for CBT. We then found the two values of this difference score with the maximum Youden index for predicting remission (i.e., had the highest combined sensitivity and specificity to dichotomize the sample into predicted to remit to CBT/ADM or not) separately for CBT (value −0.8) and ADM (value −0.2). That is, if a participant’s predicted HAMD-Outcome for CBT was more than 0.8 better than the predicted HAMD-Outcome for ADM, they were recommended CBT; if it was less than 0.2 better (or if the predicted HAMD-Outcome for ADM was better), they were recommended ADM; if it was between −0.8 and −0.2, either treatment was recommended. This yielded three groups: Recommend CBT Recommended, Either, and Recommend ADM. Within these three groups, some individuals actually received CBT, and some received ADM. Thus, participants could be grouped based on whether they received the recommended treatment. Mean HAMD-Outcome and remission rates were then calculated for and compared among participants who randomly received the recommended treatment vs other treatments (e.g., whether those who were predicted to respond best to CBT and were randomly assigned to receive CBT responded better to treatment than those who were predicted to respond best to CBT and received ADM). Comparisons were performed using independent sample t-tests and chi-square tests. For each t-test performed, we used Levene’s Test for Equality of Variances and used the adjusted results. In any case, this test was significant, and thus, equal variances could not be assumed. We also performed Kolmogorov–Smirnov Tests of normality for HAMD-Outcome within the groups being compared and in each case, the test was nonsignificant, meaning the distributions were sufficiently normal. Thus, the assumptions for t-tests are fulfilled. The effect sizes reported are Hedge’s g, which applies a correction factor for small sample sizes to Hedge’s g.
The same strategy was used in the PET-Predictor sample to simulate treatment recommendations. First, participants were categorized using the same difference score cut-off values from the PReDICT sample analysis into Recommend CBT, Either, and Recommend ADM groups, and HAMD-Outcome and remission rates were compared among these groups.
We also considered an alternative treatment assignment strategy, which was to consider the treatment for which a participant had the lowest predicted HAMD-Outcome to be their recommended treatment. These results are reported in the supplement.

Responses