Meta analysis of resting frontal alpha asymmetry as a biomarker of depression

Introduction
Major depressive disorder (MDD), characterized by affective and cognitive abnormalities1, is a prevalent psychiatric disorder that potentially resulting in diminished pleasure, decreased quality of life, and increased risk for suicide2,3,4. Despite dedicated efforts to improve diagnostic techniques and therapeutic interventions, MDD remains prevalent, affecting an estimated 3.8% of the global population—equivalent to around 280 million individuals5. Given the inherent subjectivity of structured interviews and self-report questionnaires, there is a growing interest in the development of objective biomarkers. Neuroimaging data, which offer a more substantive approach, could be instrumental in both diagnosing MDD and monitoring its progression, ultimately contributing to better clinical outcomes for individuals living with MDD6.
Biomarkers, serving as tangible physiological signposts of disease processes, are crucial for verifying the presence or absence of various illnesses7. The quest for biomarkers in MDD has led to the identification of several promising candidates, including microRNAs, nerve growth factors such as brain-derived neurotrophic factor (BDNF) and vascular growth factor (VGF), inflammatory cytokines, and neurotransmitters including serotonin and dopamine6,8,9. However, given disparate research methodology and inconsistent results, biomarker candidates for MDD remain elusive and face several potential challenges, including heterogeneity of individual conditions (different symptoms and comorbidity), insufficient accuracy (sensitivity and specificity), duplicability, and lack of validation6,7,8,10.
Over the past three decades, non-invasive electroencephalogram (EEG) studies have provided insights into MDD diagnosis, with vast literature pointing prefrontal cortex (PFC) dysfunction11,12,13. Among the various EEG markers scrutinized in MDD, resting frontal alpha asymmetry (FAA) stands out as a significant measure, reflecting the disparity in EEG alpha power between the right and left frontal lobes14.
Previous resting FAA meta-analysis in MDD has found inconsistent results15,16,17,18. Early EEG research suggested a pattern of left-sided FAA (greater left than right frontal alpha activity) in depressed patients, with a moderate effect size distinguishing depressed patients from controls17. However, this pattern has not been consistently replicated in more recent studies16,19. A comprehensive meta-analysis encompassing 1883 MDD patients and 2161 controls found non-significant effect sizes between MDD patients and controls, thereby concluded that the association between FAA (F4 – F3) and depressive states is either partial or negligible18. Using a fixed-effect model, their analysis highlighted considerable heterogeneity across studies. While their post hoc tests and cross-sectional analyses demonstrated a significant three-way interaction of gender × age × depression severity on FAA, they did not identify any main effect from individual variables. Subsequently, including studies using only Cz reference and the logarithmic transformation of FAA (In F4 − In F3), another study analyzed data from 326 MDD subjects and 735 healthy controls16. Their findings indicated a slight, yet non-significant, tendency toward left lateralization in the depression group, with low heterogeneity (I² = 27%) across studies. Such mixed results underscore the complexity of using FAA as a diagnostic biomarker for MDD. Besides, previous meta-analyses only used F4 – F3, but F8 – F7, Fp2 – Fp1 are also commonly calculated as FAA. Hence, further research is required to elucidate the relationship between depression and FAA.
To delve deeper into the influence of potential moderating factors on FAA, this study endeavors to offer an up-to-date meta-analysis. By employing a standardized methodology, we aim to provide greater clarity on FAA’s role in MDD. Our analysis encompasses the key EEG electrode sites traditionally investigated in FAA studies: F3/F4, associated with the dorsolateral prefrontal regions; F7/F8, linked to the lateral-frontal areas; and Fp1/Fp2, corresponding to the prefrontal regions20,21.
Methods
Study design and data sources
This meta-analysis adhered to the PRISMA guidelines. A systematic search was conducted in PubMed for the period up until July 2023, using the query “Major depressive disorder[Title/Abstract] OR depress*[Title/Abstract] AND (hemispheric lateralization or alpha asymmetry AND (EEG[Title/Abstract] OR electroencephalogram[Title/Abstract]”. Computer searches were supplemented with a manual search. The reference lists of the eligible publications were also manually searched to further identify relevant publications16,17,18.
Inclusion criteria
-
(1)
availability of adults (age≥18 years) with diagnoses of MDD or clinically significant depression according to ICD-10, DSM-IV/V, structured clinical interviews using the SCID or MINI, or self-report assessment [Center for Epidemiologic Studies Depression Scale (CES-D) and Hamilton Depression Rating Scale (HDRS)];
-
(2)
inclusion of a healthy control group with no history or presence of psychiatric illness;
-
(3)
availability of mean, standard deviation (SD), and sample size of resting FAA (electrode F4 − F3, F8 − F7, or Fp2 − Fp1);
-
(4)
reporting of EEG reference montage.
Exclusion criteria
-
(1)
MDD patients with bipolar disorder, severe psychiatric comorbidity (e.g., schizophrenia), neurological disorders (e.g., epilepsy), or have received electroconvulsive treatment in the previous six months;
-
(2)
No EEG recordings during resting states or no recordings of corresponding locations (F4, F3, F8, F7, Fp2, Fp1);
-
(3)
meta-analysis, reviews, case reports, unable to obtain full-text articles or unavailable data.
Data extraction
When FAA means and SDs were not provided, the Engauge Digitizer v.12.1 software was used to extract FAA data from the bar graphs (with error bars). For each study, reference montage, resting EEG condition [eyes open (EO), eyes closed (EC), or both], recording length, and the alpha bandwidth were reported. Additional subject information was gathered as follows: mean and SD of age, comorbid classifications (% and type of comorbidity), medication status (% receiving an antidepressant), education background (~ years), gender (~ female), depression severity mean, and SD. We further classified the sample according to the average depression severity scores of the samples (Table 1). In the statistical data analysis, only the following variables were used: number of participants, SD, calculation formula, age and severity classification, and reference montage.
Statistical analyses
All statistical analyses were conducted utilizing Stata 15 MP. We computed Mean differences (MD) and 95% confidence intervals (CIs) continuous variables based the means and SDs of MDD group and control. Heterogeneity among studies were assessed using χ2 test and ({I}^{2}) > 50% was considered indicative for significant heterogeneity. Heterogeneity was assessed as low (({I}^{2}) ≤ 50%), moderate (50% < ({{I}}^{2}) ≤ 75%), and high (({I}^{2}) > 75%). If ({I}^{2}) < 50% and p > 0.01 (Q-test), a fixed effect model would be used; otherwise, a random effect model would be applied. Galbraith plot served to identify studies contributing to heterogeneity. When the total heterogeneity of a sample (Qt) was significant—indicating that the variance among ESs is greater than expected by sampling error—the study contributing the most to this significance was sequentially excluded from further analysis. This exclusion process was repeated until the Qt value no longer indicated significance, with a maximum of three iterations permitted. Effects of potential factors were explored through subgroup analyses, categorized by depression severity (mild, moderate, severe), EEG reference montage (e.g. CA, Cz, LE), age groups (adults, older adults), and the specific algorithms used. These analyses aimed to uncover any underlying patterns or effects that could be attributed to these variables. To assess publication bias, Egger’s test and funnel plots were employed. A p-value of less than 0.05 was set as the threshold for statistical significance, ensuring that the findings were not due to chance. Subgroup analyses were then performed based on depression severity (mild, moderate, or severe), reference montage (CA, Cz, LE…), age (adults or older), and algorithm to find out potential effects of other explanatory variables. We also performed Egger’s test and funnel plots to access publication bias. A value of p < 0.05 was considered statistically significant.
Results
Study selection and study characteristics
A total of 239 potential articles for initial screening were published between January 2000 and July 2023. Thirty-six additional relevant studies were identified from studies covered by the previous meta-analysis16,17,18 and reviews. After the exclusion of duplicates, 253 articles remained, of which 98 were rejected based on the reading of titles and abstracts, and 155 were selected for the entire reading of the texts. Then, 108 other studies were excluded because they did not meet the eligibility criteria. Another 24 studies could not be statistically analyzed due to the absence of the alpha band frontal asymmetry index (FAA) measure for electrodes F4, F3, F8, F7, Fp2, and Fp1. Therefore, 25 articles (23 groups of data)20,21,22,23,24,25,26,27,28,29,30,31,32,33,34,35,36,37,38,39,40,41,42,43,44 were included in this review. See Fig. 1 for the flow diagram of the inclusion process and Table 1 for an overview.

Flow diagram of the inclusion process.
The existence of hemispheric lateralization of the alpha wave in depression was investigated. The FAA (F4 − F3) was calculated from the difference between the logarithms of the absolute spectral values of the alpha wave from the F4/F8/Fp2 and F3/F7/Fp1 electrodes. For negative FAA, the value of F3/F7/Fp1 was higher than the value of F4/F8/Fp2, suggesting higher alpha power in the left front hemisphere (left alpha lateralization) and a decrease of cortical activity in this region, as they are inversely proportional magnitudes. Meanwhile, when FAA is positive, the value of F4/F8/Fp2 is higher than that of F3/F7/Fp1 and alpha power was focused on the right front hemisphere (right alpha side), with consequent reduction of cortical activity on the right. The forest plot in Fig. 2 and funnel plot in Fig. 3 showed a graphical overview of ESs and the grand mean of all FAA measures.
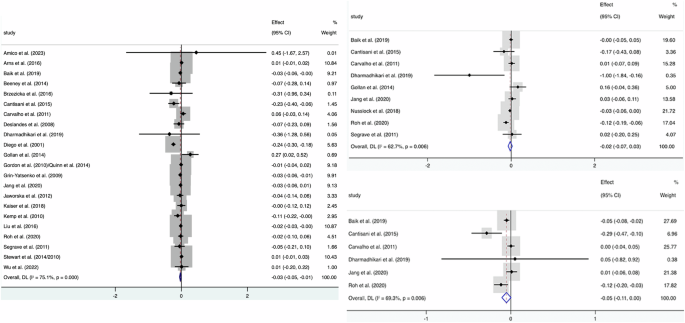
Forest plot of the effect sizes (ES) of all included studies and the grand mean ES for all studies. The grand mean ES of FAA (F4 – F3) after resolving heterogeneity was -0.03 (Left), while F8 – F7 (Right Top) and Fp2 – Fp1 (Right Bottom) didn’t yield a significant result.
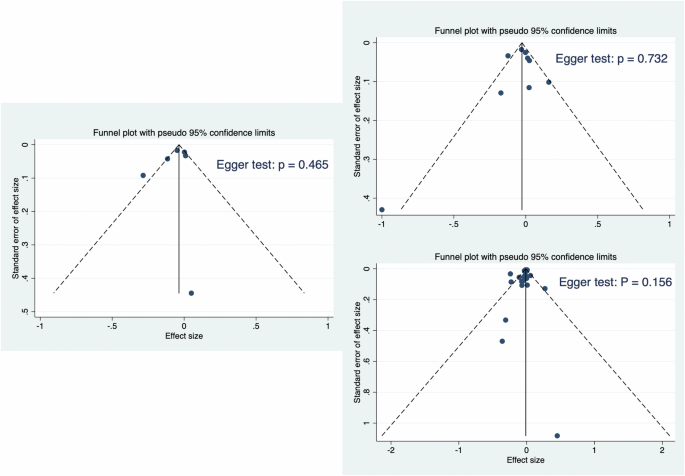
Funnel plot of the study effect sizes (ES) and corresponding sample sizes, with the vertical line indicating the grand mean ES. Egger’s test is used to assess potential publication bias. Left: F4 – F3; Right Top: F8 – F7; Right Bottom: Fp2 – Fp1.
F4 − F3
All the included studies (except Nusslock et al.20) evaluated the relationship between FAA (F4 − F3) and depression states. A total of 1928 MDD subjects and 2604 control subjects were included in the meta-analysis. A random effect model analysis showed a small but significant grand mean ES of −0.03 (95% CI: −0.05 to −0.01; p = 0.005) between the two groups with high heterogeneity (Fig. 2). The subgroup analyses showed no significant differences stratified by the calculation formula, the reference montage, age, and depression severity.
F8 − F7
Nine of the included studies20,21,24,27,28,30,32,36,41 evaluated the relationship between FAA (F8 − F7) and depression states. A total of 289 MDD subjects and 275 control subjects were included in the meta-analysis. A random effect model analysis found no significant difference in mean ES of −0.02 (95% CI: −0.07 to 0.03; p = 0.37) between the two groups with high heterogeneity (Fig. 2). The subgroup analyses showed no significant differences stratified by the algorithm, the reference montage, and depression severity.
Fp2 − Fp1
A total of 181 MDD subjects and 153 control subjects were included in the meta-analysis21,24,27,28,30,36. A random effect model analysis showed that a marginal grand mean ES of −0.05 (95% CI: −0.11 to 0.00; p = 0.06) between the two groups with high heterogeneity (Fig. 2). The subgroup analyses showed no significant differences stratified by the algorithm, the reference montage, and depression severity.
Sensitivity analysis and publication bias
Sensitivity analysis suggested that most of the conclusions are stable. Heterogeneity of FAA (F4 − F3) (({I}^{2},)= 75.1%) decreased (({I}^{2},)= 44.8%) after rejecting one study only using CES-D scores to classify MDD (Diego et al.31), and the result (MD = −0.02; 95% CI: −0.03 to −0.00; p = 0.036) resembled the former (Fig. 4). Further exclusion of three studies23,27,32 eliminated the significant heterogeneity (({I}^{2},)= 1.1%), resulting in a significant grand mean ES of −0.02 (95% CI: −0.03 to −0.01).
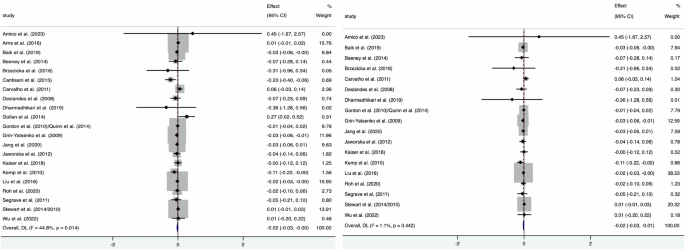
Forest plot after excluding Diego et al.31(Left) and further exclusion of three studies (Right).
We assessed publication bias by funnel plot and found that the shapes of funnel plots of F4 − F3, F8 − F7, and Fp2 − Fp1 in the present meta-analysis were relatively symmetric, indicating no publication bias (Fig. 3).
Discussion
This meta-analysis evaluated the diagnostic value of FAA in MDD patients and the impact of several potential factors on FAA. The significant effect observed at electrode site F3/F4, coupled with the high degree of heterogeneity among the included studies, implies that FAA may serve as a potential, yet not exhaustive, biomarker for diagnosing MDD. Given the relatively smaller sample sizes for the F7/F8 and Fp1/Fp2 sites, the non-significant negative values of FAA might hint at a subtle tendency towards left lateralization in individuals with depression when compared to the control group, with the Fp1/Fp2 site showing particularly noteworthy results.
Consistent with previous findings, our FAA (F4–F3) analysis exhibited a pattern relative left frontal activation in MDD patients compared with controls16,18. This pattern has been associated with behavioral withdrawal34 and emotion regulation16. Encountering aversive stimuli, such as distressing memories or negative emotional experiences, can provoke attempts at cognitive and behavioral avoidance45. These avoidance behaviors are notably associated with depressive symptoms46, and may trigger hyperactivation of the right PFC and hypoactivation of the left PFC47. While earlier studies, mostly published before 2015, reported that MDD patients tend to have reduced FAA (with less activity in the left frontal region compared to the right), a series of more recent investigations have not been able to consistently reproduce this association20,21,30,36,38,44. This discrepancy suggests that the neurological model based on behavioral withdrawal may not fully account for the variations in FAA observed in MDD.
Emotion regulation, critical in managing depression, involves the capacity to alter emotional responses and to manage behaviors during intense emotional experiences16,48. A substantial body of research implicates emotion dysregulation as a key factor in the persistence of negative affect in depression48. Furthermore, improved emotion regulation capabilities have been correlated with increased relative left frontal activity as measured by FAA49,50. Our findings thus support the notion that negative FAA values may be associated with impaired emotion regulation in MDD.
Previous meta-analysis has addressed the interaction effects of gender, age, and depression severity through post-hoc cross-sectional analysis18. Recording montage and depression severity differences between studies may lead to substantial variability across studies and thus possible inconsistencies in results50. Therefore, to replicate previous findings and explore the effects of other potential factors, subgroup analyses were performed to explore potential candidate moderators in three pairs of sites that have been suggested to explain differences between studies such as age, EEG reference montage, calculation formula of FAA, and depression severity. However, in line with previous studies, there are no significant differences between FAA subgroups with different ages, depression severity, or reference montage. Although age effects may theoretically exist due to increased neural heterogeneity in older adults51, the consistent finding of FAA across different age groups suggests that FAA does not change across the lifespan of both MDD and healthy individuals47,52.
EEG research has predominantly utilized the average reference (CA), Cz, and linked ears referencing due to their widespread acceptance and established methodology14. The Cz reference is favored for its topographical proximity to the F3 and F4 electrodes, potentially minimizing distortions in EEG signal interpretation. Meanwhile, the linked ears referencing is noted for its potential insensitivity to minor variations in EEG activity. Despite these nuances, the common average reference is often recommended for its ability to mitigate noise and enhance EEG signal quality14,18,40,47. Our meta-analysis, however, revealed a relatively low level of heterogeneity among subgroups employing different referencing techniques, indicating that the use of Cz and linked ears referencing methods are also methodologically sound in FAA research.
Considering calculation methodologies for FAA, it’s important to note that the unnormalized calculation of FAA might lead to results that are not generalizable. This is because the positively skewed distribution was often observed in EEG power measurements32. To normalize EEG data, the use of (R – L)/(R + L), the natural logarithm (ln), and log-transformed data are prevalent practices in the field18. Arns et al.23 had conducted a comparison between log-transformed FAA and the non-log-transformed difference ratio, such as (F4 – F3)/(F4 + F3). They claimed that the non-log-transformed ratio was more closely approximated a normal distribution than log-transformed FAA. However, in the current study, the results were found to be consistent regardless of whether the log transformation was applied or not. While previous research has suggested that not dividing by the sum in the calculation could affect the negativity degree of FAA18, our meta-analysis revealed low heterogeneity among subgroups that utilized these different calculation methods. This suggests that the outcomes derived from these various calculations are indeed comparable, providing researchers with flexibility in their analytical approaches while maintaining confidence in the generalizability of their findings.
Our meta-analysis offered several notable strengths. It included the largest number of participants compared to prior systematic studies16,18, and it is the first to confirm the diagnostic value of FAA (F4 – F3). Additionally, it expands the scope of analysis to include FAA from other scalp sites, such as F7/F8 and Fp1/Fp2. We have also conducted subgroup analyses based on calculation formulas, depression severity, and EEG reference montages, providing insights into the sources of heterogeneity across studies. Importantly, our findings confirm that these variables do not adequately account for the observed variance, suggesting the influence of unexamined interaction effects.
However, our study has certain limitations. The analysis was restricted to data from single pairs of electrodes F4/F3, F7/F8, and Fp1/Fp2. Given the inherent limitations in EEG’s spatial resolution, there is a growing trend in the literature to report the mean FAA across the entire frontal region and to consider various referencing methods. These approaches yield more stable and replicable results25,35,53. Therefore, we advocate for future research to explore FAA across different montages, particularly studies aimed at identifying quantitative biological markers in depression. Another limitation is the absence of analysis regarding participants’ comorbid anxiety and medication status, both of which could influence EEG patterns. Studies have indicated that comorbid anxiety might obscure or mitigate the relationship between depression and FAA20,50. Yet, findings are mixed, with some research showing no difference in FAA between adolescent MDD patients without comorbid anxiety and healthy controls, while those with comorbid anxiety exhibit significantly lower FAA53. Considering the high rate of comorbidity between anxiety and depression, with 41.6% of MDD patients also experiencing anxiety within the same 12-month period54, the impact of comorbid anxiety on EEG patterns is substantial. Furthermore, while previous reviews have not found FAA variations following treatment with escitalopram, sertraline, or venlafaxine19, studies utilizing selective serotonin reuptake inhibitors (SSRIs) have reported that treatment responders tend to exhibit more right-sided alpha asymmetry, in contrast to non-responders who show an opposite asymmetry23,55. Given these mixed results, it is imperative for future research to revisit these aspects, especially in light of the complex interplay between comorbid conditions and medication effects on FAA in MDD.
In conclusion, our study reveals a modest yet noteworthy association between FAA and MDD, particularly for FAA (F4 − F3), despite significant heterogeneity across studies. Future research should delve into the influence of comorbidities and medication status on FAA, considering a broader range of EEG montages to enhance the biomarker’s applicability. The findings underscore the need for a multifaceted approach to MDD diagnosis, where FAA complements rather than replaces existing clinical assessments, moving towards a more precise understanding and treatment of depression.
Responses