Decreased impulsiveness and MEG normalization after AI-digital therapy in ADHD children: a RCT

Introduction
Attention-deficit/hyperactivity disorder (ADHD) is one of the most common neurodevelopmental disorders that affects 2–7% worldwide of children, mostly boys, and often lasts into adulthood1,2,3. Based on the types of symptoms, three presentations of ADHD can occur: predominantly inattentive, predominantly hyperactive and combined. The ADHD-combined (ADHD-C) is the most prevalent presentation in children. Research suggests that approximately 50–75% of children diagnosed with ADHD exhibit the combined subtype, which involves both inattentive and hyperactive-impulsive symptoms. In contrast, the inattentive subtype, which is primarily associated with focus and attention difficulties without significant hyperactivity, accounts for about 20–30% of cases. The hyperactive-impulsive subtype, characterized by impulsivity and hyperactivity with fewer attention issues, is the least frequent, accounting for approximately 10–20% of ADHD diagnoses in children4,5,6. Additionally, children with ADHD-C show moderate impairments in multiple cognitive domains including attention, executive functions, and memory1,6. These cognitive impairments have also been studied in relation to the brain correlates of ADHD using neurophysiological techniques, such as electroencephalography (EEG) and magnetoencephalography (MEG)7,8. Increasing evidence from M/EEG power spectral analysis is showing that ADHD patients, in comparison to the neurotypical control group, present a pattern of significantly higher theta and alpha relative power and lower beta relative power, along with higher theta/alpha and theta/beta ratios9,10,11. The “Maturational Lag” hypothesis suggests that electrophysiological correlates of ADHD support a model of maturational delay on the central nervous system, rather than a different neurological dysfunction12,13. When compared to controls, ADHD groups’ slow frequency activity decreased later in age, revealing a delay in maturation10. However, among ADHD types, the hyperactive/impulsive showed a faster reduction in slow frequency bands in comparison to the inattentive type8. Recently, this maturational hypothesis has also been supported from graph theory analysis12, as ADHD children seem to have differential functional network development (decreased integration and segregation) in the regions overlapping with default mode network (DMN), salience network (SAL), dorsal attention network (DAN) and visual network (VN).
Treatment options can be divided into three main categories: (1) pharmacological; (2) nonpharmacological; and (3) combined treatments13. Pharmacological treatments use stimulant or non-stimulant medications to address symptoms, while nonpharmacological treatments include therapies such as behavioral training, cognitive behavioral therapy (CBT), and mindfulness14,15. Pharmacological treatments effectively manage symptoms, while behavioral and skills training have shown moderate improvement16,17,18. Despite evidence supporting these treatments, access is limited due to barriers like cost, stigma, and long waiting lists. Additionally, pharmacological treatments manage symptoms temporarily but do not address underlying causes like cognitive or emotional issues19,20,21.
To address these barriers, the development of technological advancements, including mobile applications, have grown to assess and treat several disorders, including ADHD22,23. These applications are familiar to patients and can offer greater engagement and motivation than traditional cognitive therapies. They allow patients to safely test their abilities and skills while enhancing treatment effectiveness through personalized adjustments to cognitive tasks levels based on symptom severity. Furthermore, they help address the limitations of conventional rehabilitation methods by providing safer, more accessible and flexible therapeutic options24. Neudecker et al.25 reported significant improvements in executive functions, inhibition, parent-reported psychological difficulties, and motor skills, following a home-based exergaming intervention in a sample of 51 children with ADHD (ages 8–12). Preliminary positive findings suggest that such interventions may help reduce inattentive symptoms although results regarding impulsivity are mixed26,27,28,29. Recently, several scoping and systematic reviews have synthesized the evidence on the use of technological cognitive intervention systems in children and adolescents with ADHD27,30,31. However, despite these promising outcomes and the interest from the healthcare professionals, further research is needed to establish sufficient evidence for the widespread practical implementation. Regarding the neural mechanisms that underlie these cognitive changes, stimulant pharmacological treatments have been shown to normalize electroencephalogram (EEG) abnormalities post-administration, with a reduction in theta [4–7 Hz] band power spectra in 44% of the studies (8 out of 18)32,33,34,35,36,37,38. Non-stimulant medications have demonstrated a similar effect, normalizing the EEG spectral profile in 40% of the studies (2 out of 5)39,40. Several studies have also investigated non-pharmacological interventions41. While physical exercise has been shown to normalize EEG patterns, results for neurofeedback have been inconclusive42,43. Digital cognitive treatments (DCT) have exhibited promising outcomes, with evidence of brain enhancements and EEG normalization44. For instance, alpha suppression during oddball tasks post-training suggests that alpha activity may be linked to attention switching and cognitive workload45. Additionally, computer-based inhibitory control training has been associated with reduced relative theta power in resting EEG and trending improvements in parents reported in inattentive behaviors46. This findings highlight that the latest DCTs are specifically designed to leverage the brain’s neuroplasticity, the ability to reorganize and form new neural connections across the lifespan. These interventions often target cognitive functions—such as memory, attention, or problem-solving—through personalized and adaptive approaches. By employing artificial intelligence algorithms, these interventions can automatically adjust task difficulty or game modalities based on individual performance and needs. This creates a dynamic training environment that optimizes cognitive improvement through tailored experiences that enhance both engagement and effectiveness47. Starting from these premises, Sincrolab has developed a DCT designed to enhance cognitive functions through personalized and adaptive interventions28,29. The program utilizes advanced technologies, including artificial intelligence and neuropsychological principles, to tailor cognitive training exercises according to the specific needs of each child (for more detail, see Supplementary Materials 1 and 2). The main objective of this study was to assess the efficacy of the Sincrolab DCT (KAD_SCL_01) on inhibitory control in pediatric ADHD-C. By comparing two intervention conditions of random allocation (KAD_SCL_01 condition vs. control condition), we assessed pre-post interaction effects of KAD_SCL_01 on inhibitory control. The primary outcome measure for this objective was the Commission score from the Conners Continuous Performance Test (CPT-3)48. Additionally, the study evaluated the efficacy of the intervention with KAD_SCL_01 on other cognitive processes and clinical measures (refer to “Treatment assessment” in “Materials and methods” section). Lastly, the study sought to demonstrate the relationship and changes between neuropsychological and clinical measures and power spectral activity within the ADHD brain networks.
Methods
Participants
An initial sample of 56 children diagnosed with ADHD-C were enrolled from health facilities, schools, and associations in the community of Madrid (Spain), with prior authorization by the latter to researchers to contact with legal guardians. The enrollment consisted of emails, phone, and video calls with the legal guardians in which were provided all the clinical trial information. The legal guardians of the participants who agreed to participate, were subsequently contacted to verify the eligibility criteria To be included in the clinical trial, the following criteria had to be met: (1) children age between 8 and 11 years old; (2) children diagnosed with ADHD-C according to the Diagnostic and Statistical Manual of Mental Disorders, Fourth Edition (DSM-IV-TR)49 criteria by an authorized professional; (3) stopping ADHD medication 3 days before visit days (according to the methylphenidate specifications, it has a half-life of 3.5 h and the 90% is excreted in urine and the rest in feces in 48–96 h); (4) maintaining of the same pharmacological doses during the clinical trial; (5) non-use of other psychoactive drugs; (6) no other psychiatric comorbidities and (7) the compliance with the clinical protocol. The exclusion criteria were the following: (1) beginning or discontinuing behavioral therapies or psychoactive drugs during the clinical trial; (2) use of psychoactive drugs and presence of suspicion of substance abuse in the last 6 months; (3) any other psychological diagnosis and comorbidity; (4) children with hand motor difficulties enabled to use the mobile devices (tablet or smartphone); and (5) children with blindness or visual acuity difficulties. From the initial sample of 56 participants, n = 6 declined to participate and n = 1 was excluded for not meeting all the inclusion criteria. Those who met the inclusion criteria were randomized with a ratio of 1:1 and an allocation probability of 0.50 to be included in the experimental or control group. From the 49 participants, n = 3 subjects did not perform the post-assessment with magnetoencephalography (MEG) because they did not complete the treatment protocol and n = 5 was discarded from the analysis because of the quality of the MEG register. The final sample of n = 41 subjects underwent the final pre-and-post intervention assessment including MEG recordings, neuropsychological batteries, and clinical questionnaires: 20 in experimental condition and 21 in control condition. Prior to inclusion in the clinical trial, the legal guardians of all participants received and signed an informed consent form explaining the objectives of the research and the characteristics of the experimental procedure. The clinical trial obtained the approval of the Ethics Committee at the San Carlos Hospital (Madrid, Spain) and the entire procedure was designed following the guidelines of the Declaration of Helsinki regarding the ethical standards to be followed in any procedure that includes human beings. This clinical trial is registered in the ISRCTN registry (ISRCTN71041318). Reporting Trials (CONSORT) 2010 flow diagram is presented in Fig. 1.

Consolidated Standards of Reporting Trials flow diagram.
Neuropsychological and clinical outcomes
The assessment protocol pre-and-post digital intervention consisted of the following neuropsychological batteries:
-
Main neuropsychological outcome measure:
-
Commission score (CPT_C) from the Conners Continuous Performance Test (CPT-3)45.
-
-
Secondary neuropsychological outcomes measures:
-
Conners Continuous Performance Test (CPT-3): for each dimension (inattentiveness, impulsivity, sustained attention, and vigilance) the following scores had been considered as secondary outcomes:
-
Inattentiveness: detectability (CPT_d), omissions (CPT_O), hit reaction time (CPT_HRT), standard deviation of HRT (CPT_HRTSD), response variability (CPT_Var);
-
Impulsivity: HRT and preservations (CPT_P);
-
Sustained Attention: HRT block change, omissions by block (CPT_HRT and CPT_O);
-
Vigilance: HRT inter-stimulus (CPT_HRTISI), Interval (ISI) change and omissions by ISI.
-
-
Developmental Neuropsychological Assessment-II (NEPSY-II)50 the following subtests related to attention domain were administered to participants pre-and-post the digital intervention:
-
Auditory attention and response set. From this test, the number of correct answers (NAtAu_Ac) and commissions (NAtAu_EC), omissions (NAtAu_ EO) and inhibition errors (NAtAu_ EI) scores have been computed.
-
Inhibition. From this subtest, response time (Ninh_1T), number of errors (Ninh_1E) and number of self-corrected errors (Ninh_1EAc) have been computed.
-
Card Classification. From this subtest, the number of correct answers (Clas_C), repeated errors (Clas_R), inaccurate answers (Clas_O) and total errors (Clas_TE) have been computed.
-
-
Wechsler Intelligence Scales for Children-IV (WISC-IV)51: the following subtests from the Working Memory Index and Processing Speed Index were administered to participants pre-and-post digital intervention:
-
Digit Span: from this subtest, total number of correct responses (DIG_D and DIG_I) and the length of the last sequence (DIG_D+ and DIG_I + ) successfully repeated for each condition have been computed.
-
Coding: from this subtest, correct (CN_Ac) and incorrect responses (CN_E) and the total number of processed integer numbers (CN_T) have been computed.
-
Symbol search: from this subtest, the number of correct (BS_Ac) and incorrect items (BS_E) and total processed items (BS_T) have been computed.
-
-
From Weschler Non-Verbal Scales (WNV), the Corsi Block Tapping Test52 has been administered and total number of correct answers (LE_D and LE_I) and the length of the last sequence (LE_D+ and LE_I+) in each condition have been computed.
Regarding clinical outcomes, the following measures have been used to assess the effectiveness of the intervention:
-
Scale for the Evaluation of Attention Deficit Hyperactivity Disorder (EDAH)53: it consists of 20-items and aims to assess the main ADHD features and any coexisting behavioral disorders. Inattention (EDAH_DA), hyperactivity (EDAH_H), hyperactivity and inattention (EDAH_DAH) behavioral disorders (EDAH_TC) and the global indexes have been computed.
-
Behavior Rating Inventory of Executive Function, Parent Version (BRIEF)54: it consists of two forms (parent and teacher form) of 86-items each and aims to assess executive functioning in daily life activities. The parent form has been administered in the clinical trial and inhibition (BrPa_Ih), flexibility (BrPa_Flx), working memory (BrPa_MO), emotional control (BrPa_CE), planning (BrPa_Pla), initiate (BrPa_Ini), organization (BrPa_Org), and monitoring (BrPa_Mon) scores have been computed.
-
Neurophysiological outcomes and procedure
Neurophysiological pre-and-post digital intervention data have been recorded using the Elekta-Neuromag MEG system composed of 306 channels (Elekta AB) at the Center for Biomedical Technology (Madrid, Spain). MEG data have been recorded at a sampling frequency of 1000 Hz and have been online filtered with a band-pass between 0.1 Hz and 330 Hz.
For the MEG data acquisition, participants were placed inside the magnetically shielded room in which the MEG was located. The shape of each subject’s head was defined with respect to three anatomical points (nasion and bilateral preauricular points) using a 3D digitizer (Fastrak, Polhemus, VT, USA) and head movement was tracked through four HPI (Head Position Indicator) coils attached to the scalp. These HPI coils continuously monitored the subjects’ head movements, while eye movements were monitored by a vertical electrooculogram (EOG) unit consisting of a pair of bipolar electrodes. For the MEG recording, the participants were given instructions that included to relax, not to move and not to move their heads outside the MEG helmet, as well as to remain silent. For the pre-and-post MEG data recording was asked to participants to close their eyes for 5-min to stay in a resting state. Closing the eyes was facilitated by reducing the room lighting.
Subsequently the data acquisition, data preprocessing was carried out in several steps: (1) The temporal extension of the Space Signal Separation (tSSS)55 method was applied to remove external noise from raw data. A window length of 10 s and a correlation threshold of 0.90 were used as input parameters for the Maxfilter (v 2.2 Elekta AB, Stockholm, Sweden) software; (2) Ocular, cardiac and muscle artifacts were automatically detected with FieldTrip package56 and manually validated by a MEG expert. (3) Eye-blinks and cardiac activity were removed using an independent component analysis based on SOBI57; (4) The data were segmented in 4-s trials and trials marked as containing artifacts were discarded from subsequent analysis.
Later, for the power calculation, the cleaned MEG time series were filtered using a band-pass filter ranging from 2 to 30 Hz, with 0.5 s of padding. For each node of the grid, the power spectrum was computed using discrete prolate spheroidal (Slepian) sequences (dpss) with 1 Hz smoothing. The power spectrum was normalized by the total power over the 2–30 Hz range. Then, the source template with 2459 nodes in a 10 mm spacing grid was segmented into 78 regions of the Automated Anatomical Labeling (AAL48) atlas66, excluding the cerebellum, basal ganglia, thalamus, and olfactory cortices. These 78 regions of interest included 1202 of the original 2459 nodes. After averaging trials across subjects, the result ended up with a source-reconstructed power matrix of 1202 nodes × 41 participants. Finally, the power ratio (post-condition/pre-condition) was calculated to assess the change between the two conditions of the follow-up.
Finally, a template head model was employed for source reconstruction due to the lack of individual anatomical data. The head model consisted of a single layer representing the inner skull interface, generated from the union of gray matter, white matter, and cerebrospinal fluid in the Montreal Neurological Institute (MNI) brain. As a result, a regular grid of sources with 10 mm spacing defined in MNI space was obtained. From these, the 1202 source positions falling under cortical areas of the AAL atlas were extracted. The scalp of the MNI template was linearly transformed to match the individual head shape using an affine transformation generated with an iterative algorithm, and the same transformation was applied to both head and source models. The lead field was calculated using a single shell model. Finally, a Linearly Constrained Minimum Variance beamformer was applied to reconstruct the source’s time series using the trial-average covariance matrix and a regularization factor of 5% of the average sensor power.
Digital cognitive intervention (KAD_SCL_01) and control condition
The experimental condition consisted of a DCT delivered through a serious game on a mobile device (mobile phone and/or tablet). A “serious game” is designed with a primary purpose beyond mere entertainment58; while it incorporates elements typical of traditional video games, such as interactive features and engaging storytelling, its main goal is to educate, train, or raise awareness about specific topics. The intervention comprised 14 cognitive game-based tasks designed and developed based on scientific-supported neuropsychological tasks (e.g., go/no-go task, n-back task; see Supplementary Material 1). The intervention was scheduled 12-weeks, with three 15-min sessions each week59,60. The first session included a selection of tasks from the 14 cognitive tasks-games tailored according to the child’s age and the cognitive profile. This selection was adjusted throughout the intervention to target different cognitive functions. Results from each treatment session were transmitted to the AI system that used algorithms to automatically modify the selection of the cognitive tasks-games and levels of difficulty, ensuring ongoing adaptation of the intervention (see Supplementary Material 2).
The control condition consisted of three entertainment games—Knightmare Tower, Bloons Super Monkey, and Super Stacker 2—all available on the Kongregate open-access platform (Kongregate Inc.). Knightmare Tower is a runner-style game where the player ascends a tower, avoiding enemies and traps along the way. Bloons Super Monkey, like the classic Space Invaders, involves moving left or right to defeat enemies and obstacles. Lastly, Super Stacker 2 is a puzzle game where the player strategically places geometrical shapes to keep them balanced. Kongregate was selected as the platform for the control condition for several reasons. First, Kongregate offers a wide range of casual games that are engaging yet neutral, meaning they are not specifically designed to influence cognitive, psychological, or therapeutic outcomes. This made it ideal for a sham intervention, allowing participants to engage in screen-based activities without the active components of the experimental intervention. Additionally, the games provided on Kongregate ensured a similar time and attention investment as in the experimental condition, helping to control for these variables in the study design. By using this platform, participants in the control condition followed the same protocol as those in the experimental condition, without influencing the targeted outcomes.
Experimental design and procedure
A single-center, parallel, single-blind, randomized controlled trial has been conducted. The study procedure included four visits: (1) Recruitment and screening according to inclusion and exclusion criteria; (2) Pre-intervention assessment included MEG recordings, neuropsychological batteries and clinical questionnaires; (3) At-home digital intervention and (4) Post-intervention assessment included MEG recordings, neuropsychological batteries and clinical questionnaires. The order of neuropsychological batteries and MEG recordings was counterbalanced in the pre-and-post-assessments.
Pre-and-post MEG and neuropsychological assessments have been performed at the Center for Biomedical Technology, at the Technical University of Madrid by a Sincrolab researcher. Clinical pre-and-post questionnaires have been performed by the children’s legal guardians.
The whole intervention period of compliance, as well as the possible adverse events have been monitored by the Sincrolab researcher. After the 12 weeks of intervention protocol, participants who completed at least 80% of the intervention sessions (28 out of 36) have been appointed for the post-intervention assessment.
Statistical analysis
Power analyses determined that a sample size of 56 participants would be sufficient to detect a mean difference of 0.64 SD in the commission score from the CPT-3, with a significance level of α = 0.05 and a power of 0.8 (1−β = 0.8). The calculation procedure followed the sample size estimation for a 2-tailed, 2-samples mean difference with a correction factor for repeated measures.
Statistical analyses were carried out using MATLAB R2020b (Mathworks Inc) and Rstudio software. Specifically, MATLAB FieldTrip toolbox has been used for MEG analysis and the R package “lme4” (function “lmer”) for fitting linear mixed-effects models (LMMs).
The first analysis (I) examined group differences in cognitive and clinical outcomes using linear mixed-effects models. The cognitive and clinical outcome measures were adjusted to linear mixed-effects models with a random intercept and fixed slope (function “lmer”, R package “lme4”). For the random effect factor, an unstructured covariance matrix (Sigma) using the robust restricted maximum likelihood method has been estimated (REML). Using a stepwise method, each model added age as co-variable. To control p values for multiple comparisons, False Discovery Rate (FDR) correction was applied61. As the commission score from CPT-3 was set as the main outcome measure, no correction for multiplicity was applied. Regarding the rest of the outcome measures, FDR adjustments were applied considering different cognitive processes (i.e., inhibition) as independent statistical families.
The second analysis (II) explored the correlation between magnetoencephalography power spectrum ratio values and CPT-C, as well as other cognitive and clinical outcomes. The goal of this methodology was to extract any neurophysiological markers whose dynamics could be associated with the evolution of the inhibition-control performance. Such analysis relied on network-based statistics62, following a pipeline developed by C3N laboratory based on FieldTrip toolbox62.
First, clusters were formed based on a criterion of spatial and frequency adjacency. Each cluster comprised several adjacent nodes, which systematically exhibited a significant partial correlation (with age as a covariate) at a minimum of three 3 consecutive frequency steps (a 1-Hz interval) between their corresponding power ratio values and CPT ratio (Spearman correlation coefficient p < 0.05). All nodes within a cluster needed to display the same sign for the correlation coefficient for the cluster to be considered a functional unit. Only clusters involving at least 0.5% of the nodes (i.e., a minimum of 6 nodes) at each frequency step were considered. Cluster-mass statistics were assessed by summing the Spearman ρ values across all nodes and significant frequency steps.
Second, to control for multiple comparisons, the entire analysis pipeline was then repeated 5000 times, with random assignments between power ratio estimates and the neuropsychological scores. At each iteration, the maximum statistic of the surrogate clusters (in absolute value) was recorded, creating a maximal null distribution that would ensure control of the familywise error rate at the cluster level. The cluster-mass statistics for each cluster in the original dataset were compared with the same measure in the randomized data. The network-based statistics p value represents the proportion of the permutation distribution with cluster-mass statistic values greater or equal to the cluster-mass statistic value of the original data.
Power ratio values were averaged across all nodes and frequencies that belonged to the cluster. This average was the representative MEG marker value for that cluster and was used in subsequent correlation analyses. Therefore, the statistics presented in the results section were derived from the correlation between the averaged power ratio value of each significant cluster and the corresponding CPT ratio for each participant. As mentioned previously, correlations were first performed within the entire sample. In a second step, correlations between the average power ratio and the CPT commission ratio scores were performed independently for both intervention conditions within the sample (experimental and control).
Finally, the last analysis (III) focused on responder analysis and the determination of the minimal clinically important difference (MCID). Anchor-based responder analysis63 to experimental and control groups, following a Fisher’s test to analyze statistical differences between groups for each CPT-3 outcome. The proportions of responders at the end of treatment phase for primary and secondary outcomes were pre-specified on the basis of previous work and clinical meaningfulness for these analyses was defined as: CPT-3 (commissions, perseveration, omissions, response variability) pre-treatment score of >54 and post-treatment score (reduction to normative range)51,52,63; EDAH-H and EDAH-DA pre-treatment score of >10 and post-treatment score <10 (below clinically meaningful cut-off); EDAH-DAH pre-treatment score of >18 and post-treatment score <10 (below clinically meaningful cut-off)64.
Furthermore, for the purpose of summarizing findings across various outcomes, we calculated odds ratios using Fisher’s test and determined confidence intervals (CIs) to assess the efficacy of the experimental group compared to the control. Odds ratios for CPT-C and CPT-P were not calculated using Fisher’s test but were estimated straight from the contingency matrix due to the small sample size. No subjects in the control group reached the MCID, leading to an infinite estimation of odds ratio by Fisher’s test. We estimated a downward odds ratio in CPT-C and CPT-P by considering one subject in the control group that reached MCID in our calculations.
When responder analysis was based on effect size (distribution-based method)63, the definition of effect size was a standardized measure of change obtained by dividing the difference in scores from pre-treatment to post-treatment by the standard deviation of pretreatment scores. We evaluated the proportion of patients in each group that reached a MCID with small (0.3), medium (0.5) and large (0.7) effect sizes.
Results
Baseline and demographic characteristics
The baseline demographics and other characteristics for each group, along with the between-group comparisons, are presented in Table 1.
Analysis I. Group differences in cognitive and clinical outcomes: linear mixed-effects models
The main outcome measure showed no deviation from normality in any of the study periods. Table 2 and Fig. 2 describe skewness and kurtosis statistics for the main outcome measure CPT-C. The Shapiro–Wilk test of normality indicates that the distribution of CPT-C in any study period is not significantly different from a normal distribution (p > 0.05).
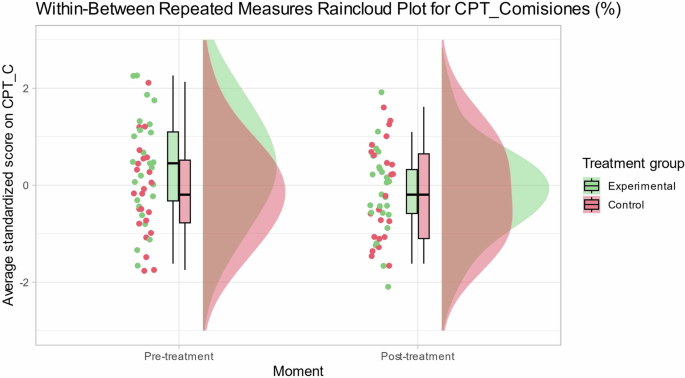
Individual and average scores for commission errors in Conners continuous performance test per condition (treatment vs. control) and stage (pre vs. post).
Mixed-effects models for CPT-C measure were estimated using robust constrained maximum likelihood method, introducing condition-period interaction effect with stepwise procedure to assess improvements in model fitting.
The linear mixed-effects model for main cognitive measure (CPT-C) with a condition-period interaction effect (see Model 2 in Table 3) did not show a statistically significant improvement (xi2 = 3,320; p = 0.068) compared to Model 1 (without condition-period interaction effect). However, Table 4 shows that β estimator for the condition-period interaction effect in Model 2 was statistically different from 0 (β = 0.56; t46 = 2.03; p = 0.047). In Model 2, the inclusion of the interaction effect explains a greater proportion of the variance in CPT-C scores (R2 total = 0.56; R2 fixed = 0.06) when compared to Model 1 (R2 total = 0.52; R2 fixed = 0.04).
Additionally, it is noteworthy that Model 3, which encompasses both the interaction effect and age as covariate, exhibits a similar performance to that of Model 2. However, Model 3 faces a penalty for its increased complexity when assessed through the criteria of AIC and BIC, as elucidated by Vrieze in 2012. Notably, Model 2 presents the most favorable AIC index among all models, with an AIC value of 268. Conversely, as BIC penalizes complexity, it is Model 1 that achieves the most favorable fit according to this metric (BIC = 282). It is worth noting that Model 1’s BIC value is closely aligned with that of the more complex Model 2 (BIC = 283). Thus, Model 2 is accepted as the final model as it shows a statistically significant condition–moment effect, the best combination of R2 explained variance, AIC and BIC adjustment. Finally, the other Cognitive and Clinical outcome measures (a total of 53 sub-indices) were adjusted to mixed-effects models. Table 5 shows the sub-indices that had a statistically significant condition–moment interaction effect and which of them remain significant after multiple comparisons correction with FDR (applied by cognitive domain). The measures that survived family-wise FDR multiple comparisons were spatial processing inverse max items (β = −1.10; p = 0.001); inhibition time (β = −0.23; p = 0.025) and spatial processing inverse (β = -0.61; p = 0.036; Fig. 3). Effect sizes are medium Cohen’s d > 0.5 and effect size for LE_I+, Ninh_1T and LE_I are large (Cohen’s d > 0.8).
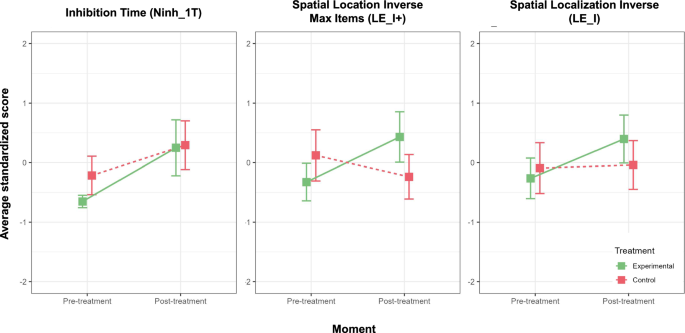
Bar plots of standardized measures with a statistically significant condition–moment interaction effect.
Analysis II. Power ratio values correlation with main outcome and other cognitive and clinical outcomes
Two main dimensions were tested for correlations with power: Impulsivity Domain (CPT-Commissions, CPT-Perseverations) and Inattentiveness Domain (CPT-Omissions, CPT-Variance in response). The main outcome measure of CPT-Commissions was included in the impulsivity domain as in our sample high commission error rates are correlated with fast reaction times (CPT-HRT; r = −0.26; p < 0.000; see Supplementary Material 3, Fig. 1 and Table 1). Statistically significant clusters of correlation between power ratio values and measures of impulsive and inattentive domains are presented in Table 6. For each cognitive outcome, the clusters p-value in alpha [7–13 Hz] and beta [13–30 Hz] frequency bands are shown.
First, impulsivity was assessed using the CPT Commissions (%) as the main outcome measure and CPT Perseverations (%) was used as a measure of cognitive control and response inhibition.
Regarding CPT Commissions, for the whole sample analysis, the power ratio shows a positive correlation with the CPT-C ratio (ρ = 0.53; p = 0.000) within a statistically significant cluster (p = 0.047) (Table 6; see Supplementary Material 3, Fig. 2). In the experimental group analysis, the power ratio shows a positive correlation with the CPT-C ratio (ρ = 0.54; p = 0.01) (Fig. 4A.2). The nodes with a statistically significant correlation to the CPT-C ratio are grouped in a cluster that is close to significance (p = 0.06; Fig. 4A.1) within the beta frequency interval (25.5–30 Hz). This cluster is primarily located in the right temporal gyrus (32%), right precuneus (12%) and right angular gyrus (12%). The correlation of the average power of the previous cluster with the CPT-C ratio in the control group was non-significant (ρ = 0.27; p = 0.22).
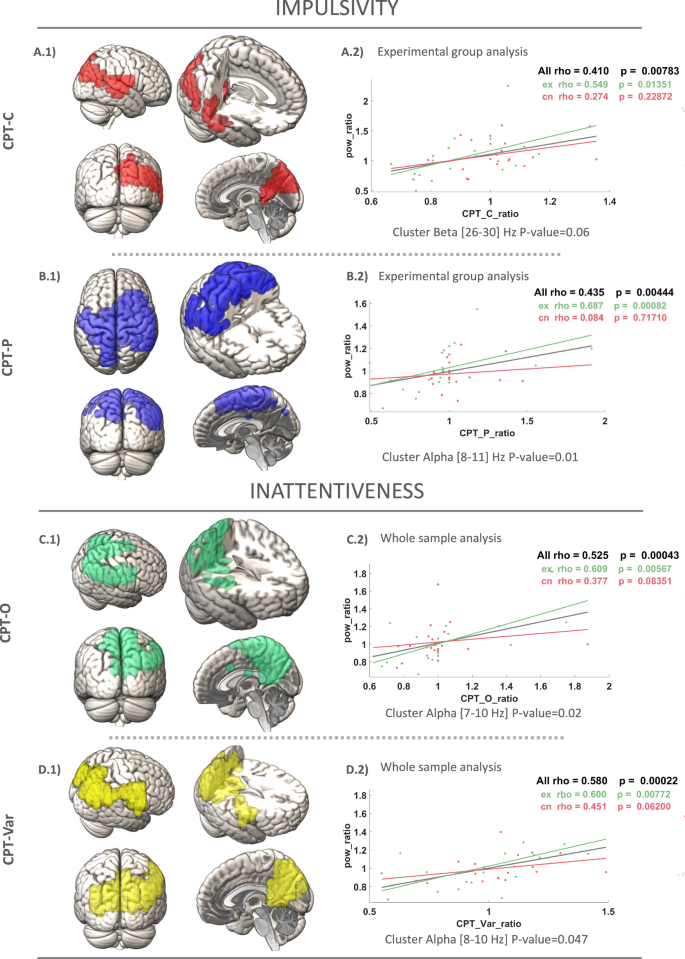
Measurement of impulsivity based on Commissions (A) in the CPT-3 test. The figure illustrates a positive correlation cluster of power ratio with the CPT ratios in the experimental subgroup, with the control group represented. B Measuring impulsivity based on Perseverations (A) in CPT-3 test. Positive correlation cluster of the power ratio with the CPT ratios in the experimental subgroup, with the control group represented. Measuring inattentiveness based on Omissions (C) and Variance (D) in CPT-3 test. Positive correlation clusters of power ratio with CPT ratios in the whole sample.
As for CPT Perseverations, in the whole sample analysis, the power ratio shows a positive correlation with the CPT-P ratio (ρ = 0.63; p = 0.000) within a statistically significant cluster (p = 0.03) (Table 6; see Supplementary Material 3, Fig. 3). For the experimental group analysis, the power ratio shows a positive correlation with the CPT-P ratio (ρ = 0.68; p = 0.001; Fig. 4B.2). The nodes with a statistically significant correlation to the CPT-P ratio are grouped in a statistically significant cluster (p = 0.01; Fig. 4B.1) within the frequency interval (8.25–10.5 Hz). This cluster is mainly located in the bilateral postcentral gyrus (18%), right precentral gyrus (10%) and right middle frontal gyrus (7%). The correlation of the average power of the previous cluster with the CPT-P ratio in the control group was non-significant (ρ = 0.08; p = 0.71).
Second, inattentiveness was measured using CPT Omissions (%), which reflects lapses in attention during the task and CPT Variability (%) was used to assess fluctuations in response time, providing insight into attentional consistency during the task.
Regarding CPT Omissions, for whole sample analysis, the power ratio shows a positive correlation with the CPT-O ratio (ρ = 0.525; p = 0.000; Fig. 4C.2). The nodes with a statistically significant correlation to CPT-O ratio are grouped in a statistically significant cluster (p = 0.02) in the frequency interval (7–10 Hz; Fig. 4C.1). This cluster is mainly located in the bilateral pre-cuneus (18%), the right angular gyrus (8.5%) and the right precentral gyrus (7.5%). This correlation remains statistically significant within the experimental and control group.
When the experimental group was evaluated, the power ratio shows a positive correlation with the CPT-O ratio within a cluster close to statistical significance (p = 0.051) (see Supplementary Material 3, Fig. 4).
As for CPT Variability, for whole sample analysis, the power ratio shows a positive correlation with the CPT-Var ratio (ρ = 0.58; p = 0.000; Fig. 4D.2). The nodes with a statistically significant correlation to CPT-Var ratio are grouped in a statistically significant cluster (p = 0.047) in the frequency interval (8–10 Hz; Fig. 4D.1). This cluster is mainly located in the bilateral precuneus (21%), the right angular gyrus (7.8%) and the right postcentral gyrus (9.2%). This correlation remains statistically significant within the experimental and control group. When the experimental group was evaluated, the power ratio showed a positive correlation with the CPT-O ratio within a cluster close to statistical significance (p = .052) (see Supplementary Material 3, Fig. 5).
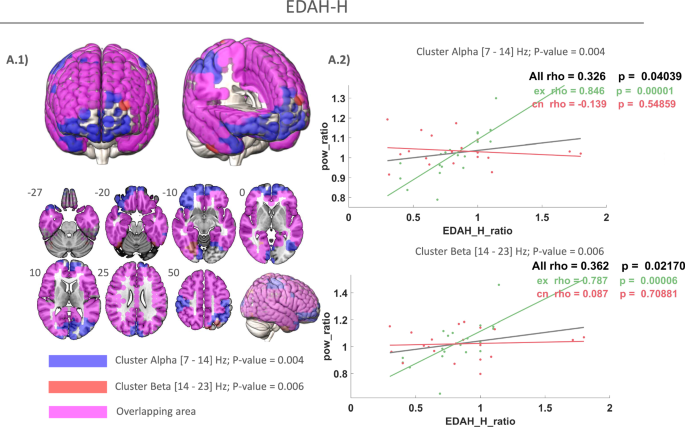
A.1 Blue: positive correlation cluster of power ratio within alpha band in treatment group. Red: positive correlation cluster of power ratio with EDAH—Hyperactivity (EDAH-H) in beta band in treatment group. Pink: overlapping areas between alpha and beta frequency clusters. A.2 Positive correlation cluster of power ratio with the EDAH-H ratios in the experimental subgroup, with the control group represented.
In essence, the enhancements observed in inattentive domains following cognitive training are linked to reductions in relative power spectra, specifically within the alpha frequency band. It is noteworthy that the experimental condition involving personalized digital cognitive intervention (KAD_SCL_01) does not exhibit superior performance compared to the control condition. In both conditions of cognitive training, we find a very similar correlation pattern between the improvement in inattention and the reduction in alpha power.
Clinical outcome
EDAH—Hyperactivity (EDAH-H) was used to measure levels of hyperactive behavior in participants, providing a quantitative assessment of impulsivity and restlessness. The correlation analysis of power ratio with clinical outcome measure EDAH-H ratio in the experimental group reveals a positive correlation in alpha frequency band [7–14 Hz] (ρ = 0.845; p = 0.000; Fig. 5A.2 top) and beta frequency band [14–23 Hz] (ρ = 0.787; p = 0.000) (Fig. 5A.2 bottom). The nodes with a statistically significant correlation to EDAH-H ratio are grouped in a statistically significant cluster in the alpha frequency interval (10.5–14 Hz; p = 0.004) (Fig. 5A.1, blue) and beta frequency interval (14–23 Hz; p = 0.006) (Fig. 5A.1, red). It can be observed how this alpha cluster (blue) is mainly located in the fronto-temporo-parietal regions and almost overlapped the beta cluster (blue). Overlapping areas between alpha and beta clusters are represented in pink in Fig. 5A.2. Interestingly, alpha involves frontal regions while beta extends throughout the parieto-temporal lobes.
Analysis III. Responder analysis and minimal clinical important difference (MCID)
Responder analyses demonstrated that the experimental group exhibited statistically significant reductions in CPT-C scores, bringing them within the normative range [45,54], with 28% (7 out of 25) of patients achieving this outcome, compared to none (0%) in the control group p = 0.009; Table 7). Furthermore, the experimental group showed a notable shift of more patients into normative ranges across various objective measures of attention and impulsivity in CPT-3. Specifically, CPT-P scores reached the [45,54] range in 20% (5 out of 25) of experimental group patients versus 0% in the control group, exhibiting a statistical tendency (p = 0.057; Table 6). Similarly, CPT-O showed a movement into the [45,54] range in 24% of the experimental group compared to 4.35% in the control group, also suggesting a statistical tendency (p = 0.099; Table 7).
Responder analyses for other comparisons, including all EDAH, did not indicate significant differences between the groups (Table 8). Nevertheless, it is noteworthy that most of the odds ratios are positive (7/8, 87.5%; Fig. 6), suggesting a trend wherein the experimental group exhibits a higher likelihood of having subjects with MCID after treatment.
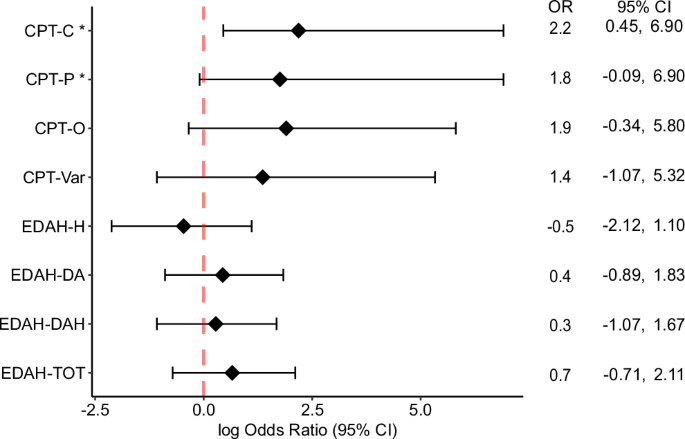
Odds ratio Forest plots for CPT-3 and EDAH outcomes based on Fisher’s test.
Discussion
This randomized controlled clinical trial demonstrated that KAD_SCL_01 significantly improved performance on the primary outcome measure, an objective measure of inattention and impulsivity (CPT-C), in pediatric patients with ADHD compared to the control group. Regarding secondary outcomes, the experimental group showed significantly greater improvements from pre- to post- intervention on additional inattention and impulsivity scores, including perseverations (CPT-P) and detectability (CPT-d’) on the CPT-C. Moreover, other cognitive secondary measures, including inhibitory control, cognitive flexibility, and spatial working memory showed significant improvements in the experimental group compared to the controls in the post intervention assessment. However, for other cognitive and clinical measures, the effect of KAD_SCL_01 from pre- to post- intervention did not significantly differ from the control group.
The current study’s findings of improved attention and impulsivity (via CPT-3) following treatment with KAD_SCL_01 align with positive results reported in prior research30. As a DCT, KAD_SCL_01 has the potential to overcome several challenges associated with traditional interventions. Firstly, it offers a favorable risk–benefit profile, as none of the patients in the experimental group experienced AEs, in contrast to the 40–60% AE rates observed in trials of commonly used stimulant medications65. Secondly, the digital format of this intervention may help reduce access barriers often associated with other behavioral or non-pharmacological interventions66. Digital interventions have been identified as promising solutions to enhance access to mental health services, decreasing waiting lists and an earlier neuropsychological recovery22.
The primary outcome measure for this trial, the CPT-3, differs from most pharmacological efficacy trials for ADHD, which typically use parent-rated or clinician-rated symptom measures. The selection of the CPT-3 was based on several factors. Firstly, because the digital tool was designed specifically to target inattention, sustained attention, impulsivity, and vigilance, we sought an outcome that would most precisely and validly index these processes. The CPT-3 is a tool for the objective assessment of attention and inhibitory control as part of an ADHD diagnosis or for monitoring intervention outcomes and has been widely used in both clinical practice and research studies. Secondly, the CPT-C measures cognitive functions that are relevant to the clinical presentation of ADHD, and attention performance metrics such as commissions, omission, perseverations, and reaction times metrics are well characterized indicators of ADHD-relevant cognitive processes and are associated with clinically relevant outcomes including academic behavior and inattention and social problems67.
In the current study, no differences were observed between the experimental and control conditions regarding the other secondary measures, and several factors might explain these findings. First, it is possible that parent- or clinician- reported outcomes (i.e., EDAH and BRIEF) lack sensitivity to the effects of the KAD_SCL_01. In this context, the cognitive process improvements resulting from the intervention may not be easily recognizable by parents and clinicians. Investigating the clinical implications of this possibility will be important for future research. Second, expectations regarding efficacy have been shown to moderate the effects of intervention in general, including digital interventions68. In our study, parents of patients in both groups believed that their child was receiving a novel intervention for ADHD; thus, the expectation of intervention effect can be assumed for both interventions and may partially explain improvements in both groups. This design differs from many pharmacological studies where patients and caregivers are aware of a non-active, placebo condition. Lastly, common mechanisms associated with both to KAD_SCL_01 and the control condition may have led to improvements in both groups. Both interventions required continued perseverance, even in the face of setbacks, and may have fostered coping and reappraisal skills or even enhanced the sense of self-efficacy and mastery69. Thus, any intervention that requires the patient to engage in a regular, structured setting that may include repeated failure or redundancy can be seen as a potential intervention for ADHD.
In the magnetoencephalography analysis, we explored the neurophysiological basis of improvements in ADHD performance after cognitive training. The findings indicated a positive association between changes in neuropsychological functions and electrophysiological patterns, providing biological evidence of neuromaturation12. Specifically, improvements in attention and inhibitory control were associated with a reduction in power within the alpha and beta frequency bands for both, KAD_SCL_01 and control treatments.
Regarding impulsivity domain, the neurophysiological correlates were predominantly observed in parietal and temporal cortex, related to voluntary sensorimotor control and visuospatial processing. On the other hand, in the case of inattentiveness domain, the correlated brain regions were associated with visuospatial imagery, episodic memory retrieval, and self-processing operations.
An important finding from this study was that digital cognitive stimulation driven by artificial intelligence (AI) appears to enhance neurocognitive maturation, as indicated by the stronger associations between brain activation and cognitive improvements observed in the experimental group. Particularly noteworthy is the impact on impulsivity: ADHD patients who underwent KAD_SCL_01 treatment demonstrated that greater improvements in inhibitory control were linked to a more substantial reduction in electrophysiological activity within the alpha and beta frequencies. Interestingly, it has been reported that these findings are further supported by clinical outcomes in EDAH-H, which exhibited a reduction in parents’ reported hyperactivity symptomatology associated with decreases in power across all cortex areas.
These results align with several previous studies investigating the electrophysiological mechanisms of cognitive training in ADHD45,46,70,71. Consequently, the reductions in relative power observed following the digital cognitive treatment may indicate an increase in the efficiency of neural networks involved in inhibitory control, reflecting a process of neuroplasticity through long-term potentiation72. Additionally, responder analyses revealed that the KAD_SCL_01 intervention led to significant reductions in the primary outcome measure, commission scores on the CPT-3. This suggests that the digital cognitive intervention may have a positive behavioral effect on the disorder.
Despite the positive results, the study has several limitations that must be considered. First, the small sample size was a consequence of the inclusion criteria, which required participants to have an ADHD-C diagnosis. Additionally, participants were excluded if they were taking ADHD medication or had significant psychiatric comorbidities, limiting the generalizability of the findings to the broader ADHD population. Second, the study used DSM-IV-TR criteria, which may not fully capture certain ADHD behaviors now included in the DSM-5, potentially affecting the validity and relevance of the results. Third, the intervention consisted of 12 weeks with 15-min sessions every 3 days, raising questions about whether alternative dosing schedules might have produced different outcomes. Further research is needed to explore longer intervention periods, the durability of effects 1-month post-treatment, and the impact of the intervention on children currently taking stimulant medications. In conclusion, KAD_SCL_01 demonstrated significant improvements in attention and impulsivity, as measured by the CPT-3. These cognitive improvements were linked to neurophysiological changes, including enhanced inhibitory control networks observed through MEG spectral normalization, suggesting neuroplasticity via long-term potentiation. The overall risk-benefit ratio suggests that KAD_SCL_01 could be a promising complement to traditional ADHD treatments, facilitating earlier cognitive recovery for daily functioning.
Responses