Longitudinal trajectories of symptom change during antidepressant treatment among managed care patients with depression and anxiety

Introduction
Symptoms of depression and anxiety often coexist. Anxious depression accounts for 42–78% of all depression cases and has been associated with higher immune and HPA-axis dysregulations and corticolimbic connectivity and more prominent cortical thinning than non-anxious depression1. Overall, anxious depression has poorer clinical outcomes than non-anxious depression2. Treatment with antidepressants is common, yet response to antidepressant treatment remains inconsistent, and dosage or medication changes often occur on a trial and error basis3,4.
Previous research has begun to explore trajectories of response to depression or anxiety treatment over time5,6,7,8,9,10. However, studies of comorbid symptom response patterns are largely limited to psychotherapy treatments5,7,9, and despite the high correlation and increased functional impairment in patients with comorbid anxiety and depression symptoms, little remains known about the course of each condition when presenting together in the context of antidepressant treatment. Furthermore, many studies do not take into account the intermediate oscillations in patients’ symptoms throughout the course of the treatment period, thereby misrepresenting differences in trajectories that may exist.
One study by Smagula et al.8 analyzed data on antidepressant response in a population of older adults from a 12 week pharmacological treatment study identified 6 distinct trajectories, including 3 responding and 3 nonresponding. Responding patients had rapid or delayed responses. A second study by Sunderland et al.9 investigated trajectories of change for distinct depressed and anxious patients receiving internet-based cognitive behavioral therapy identified two groups with higher and lower response rates across sessions. Another study by Saunders et al.7 investigated changes in symptoms of depression and anxiety over the course of psychotherapy identified 4 distinct trajectories of treatment response for depressive symptoms, and 5 trajectories for anxiety symptoms, including some with a delayed response. A large overlap was seen in terms of depressive and anxiety improvement, especially among those who did not respond to treatment for either diagnosis.
The most commonly identified predictor of poorer treatment response was higher baseline levels of symptom severity6,7,8,9. Other predictors included psychological distress9, older age, poorer self-reported physical health and unemployment6, longer duration of symptoms, better reported sleep, more guilt, more functional impairment8, lower socioeconomic status, and poorer overall functioning7.
Providing feedback to clinicians about their patients’ anticipated symptom change using expected response trajectories can improve outcomes7, and medication decisions are informed by anticipated responses. However, the usefulness of expected trajectories may be limited if anticipated outcomes are modeled upon an averaged response curve for patients. This may reduce the precision of clinical predictions and diminish the quality of management decisions.
Understanding clinical response trajectories and their contributing factors can be instrumental in beginning to predict clinical response. It may further serve as a significant step toward personalized medicine. Compared to traditional metrics for depression which neither consider variability across multiple time points nor account for co-occurring anxiety, understanding the course of response for depression and anxiety and how they relate to each other can help further elucidate the relationship with each other11.
Group-based trajectory modeling (GBTM), a latent class analysis method, provides a novel application for evaluating treatment response variability without depending on a prespecified remission threshold, in contrast to some prevailing literature8,11. GBTM is a data-driven method that allows identification of groups of patients that share common characteristics such as demographics, comorbidities, and outcomes including treatment response12. Previous studies on depression have demonstrated that GBTM has the potential to capture heterogeneity during the course of illness and recovery13,14.
The aims of study were to identify (1) patterns (trajectories) of symptom change and (2) patient and clinical characteristics associated with increased likelihood of following the identified trajectories. To achieve this, we applied GBTM to capture the typical trajectories of symptom change throughout the initial course of antidepressant treatment in patients with depression and anxiety. A heatmap was generated to analyze the synchronous and asynchronous relationships between the trajectories of depression and anxiety to delineate what clinicians are likely to observe in practice. In addition, the associations of baseline depression and anxiety symptom severity, sleep quality, characteristics, medical comorbidity, and overall health status with trajectory group membership were examined to identify potential predictors of symptom improvement.
Results
Characteristics of the derived trajectory groups
Six trajectory groups representing depressive symptom change were derived and named according to their relative baseline score and response pattern. Additional details about the process for choosing the optimal number of trajectory groups in GBTM (a quadratic curve was considered) using AIC, BIC, entropy, and SABIC are shown in the supplementary file (Supplementary Table 1, Supplementary Table 2, and Supplementary Fig. 2). These included “high, nonresponse” (Cluster 1), “high, response” (Cluster 2), “moderately severe, nonresponse” (Cluster 3), “moderately severe, response” (Cluster 4), “moderate, remission” (Cluster 5), and “moderate, nonresponse” (Cluster 6). With the baseline PHQ-9 score serving as a reference point, these trajectory groups can be roughly partitioned into “severe,” “moderately severe,” and “moderate” strata, consisting of n = 111 (19.24%), n = 230 (39.86%), and n = 236 (40.90%) patients, respectively. Within each stratum, one response and one nonresponse trajectory were observed. Within the “severe” stratum (baseline PHQ-9 ≥ 20), patients in the high, response group demonstrated a roughly linearly decreasing curve indicating substantial and sustained improvement in depression symptom severity overall, while high, nonresponse patients maintained a roughly constant PHQ-9 score trajectory, indicating neither improving nor worsening symptomatology. When observing the moderately severe group (baseline PHQ-9 = 15–19), patients in the moderately severe, response group exhibited an inverse sigmoid-shaped curve that was initially flat, then decreased sharply and gradually tapered off. Patients in the moderately severe, nonresponse group, however, showed little to no improvement. Finally, in the moderate groups (baseline PHQ-9 < 15), patients in the moderate, remission group showed an exponentially decreasing curve that reached and sustained a level below typical remission criteria (PHQ-9 ≤ 5) by the latter half of the observation window. In contrast, patients in the moderate, nonresponse group demonstrated only minimal improvement. Patient characteristics for the PHQ-9 trajectory groups are described in Table 1 and showed in Fig. 1. In addition, we explored Group-based Multi-Trajectory Modeling to examine depression and anxiety symptom courses concurrently. These results are provided in Supplementary Fig. 3 in the Supplementary materials.

The trajectory groups derived from PHQ-9 and GAD-7 scores.
Similarly, six trajectory groups were identified for anxiety symptom change, including “high, nonresponse” (Cluster 1 (n = 106, 18.37%)), “high, response” (Cluster 2 (n = 100, 17.33%)), “moderate, nonresponse-1” (Cluster 3 (n = 97, 16.81%)), “moderate, nonresponse-2” (Cluster 4 (n = 115, 19.93%)), “high, remission” (Cluster 5 (n = 66, 11.44%)), and “moderate, remission” (Cluster 6 (n = 93, 16.12%)). Patients in the trajectory group “high, nonresponse” experienced limited change during antidepressant treatment. Patients in the “high, response” group demonstrated a substantial and measurable decline in anxiety symptoms. Patients in the “high, remission” group had severe anxiety at baseline, but demonstrated the greatest symptom improvement and ultimately achieved levels below typical remission criteria (GAD-7 ≤ 5). Patients in the “moderate, remission” group initiated care with moderate anxiety symptoms and displayed steady improvement, also reaching levels below typical remission criteria. Although patients in “high, remission” and “moderate, remission” groups achieved the largest symptom improvements, the slope of “high, remission” group was steeper than that of the “moderate, remission” group, which suggests that the speed and intensity of improvement was higher in “high, remission” group. We observed unremarkable improvement for patients in GAD-7 trajectory groups “moderate, nonresponse-1” and “moderate, nonresponse-2” groups. Patient characteristics for the GAD-7 trajectory groups are shown in Table 2.
The overlap of patients between all permutations of the PHQ-9 and GAD-7 trajectory groups was also explored (Fig. 2). The pairing with the largest degree of overlap (n = 49, 32.67%) occurred between the PHQ-9 moderate, remission group (Cluster 5) and GAD-7 moderate, remission group (Cluster 6), suggesting similar rates of improvement for both depression and anxiety symptoms. The next largest degree of overlap (n = 41, 20.1%) occurred between the PHQ-9 moderate, nonresponse group (Cluster 6) and GAD-7 moderate, nonresponse-2 group (Cluster 4), which suggests that a group of patients experience minimal change in depressive and anxiety symptoms during this time period. Analysis of all the overlap permutations revealed that most overlap sets (72.45% patients) displayed similar trendlines in terms of PHQ-9 and GAD-7 score change, which suggests that patients with comorbid depression and anxiety generally experience synchronous trajectories treatment response or nonresponse. However, patients in some overlap sets (27.55% patients) did demonstrate asynchronous symptom change. For example, the overlap set that contains the PHQ-9 moderately severe, nonresponse group (Cluster 3) and GAD-7 high, response group (Cluster 2) exhibited improvement in anxiety symptoms with antidepressant treatment, but similar significant improvements were not observed in depressive symptoms.
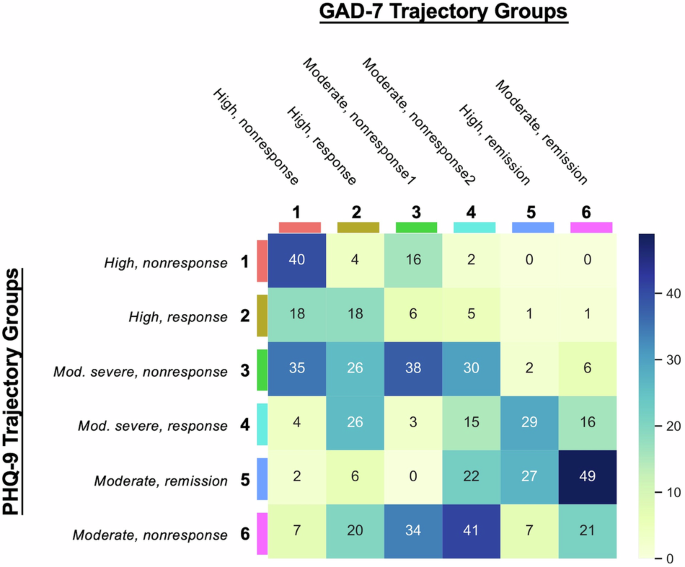
These numbers represent the number of patients overlapping in the corresponding clusters from both the PHQ-9 and GAD-7 trajectory groups.
Associations of baseline patient characteristics with trajectory group membership
Associations of patients’ baseline characteristics with their derived PHQ-9 and GAD-7 trajectory classes were investigated using a multinomial regression model (see Table 3 (PHQ-9) and Table 4 (GAD-7)). These tables summarize the relative risk (RR), corresponding 95% confidence intervals (CI), p-values for different patients’ baseline characteristics (i.e., predictor variables) regarding six classes. The RR measures the risk of a certain outcome (e.g., being in a specific PHQ-9 class) relative to the reference category. An RR of 1 means no difference in risk; greater than 1 indicates higher risk, and less than 1 indicates lower risk compared to the reference. In Table 3 regarding PHQ-9 trajectories, the reference category is PHQ-9 Class 5 (Moderate, remission). The relative risk values indicate the likelihood of being in one of the other PHQ-9 classes compared to the Class 5, based on the predictor variables. In particular, the variable age does not significantly affect the likelihood of being in any PHQ-9 class except for Class 6 (Moderate, nonresponse), where older age increases the risk (RR = 1.02, p-value = 0.041). The Patient-Reported Outcomes Measurement Information System (PROMIS) score is a significant predictor for most PHQ-9 classes compared to the reference group. Compared to Class 5, an increase in PROMIS score decreases the likelihood of being in Class 1 (High, nonresponse), Class 2 (High, response), Class 3 (Moderately severe, nonresponse), and Class 4 (Moderately severe, response) with RRs of 0.47 (p-value < 0.001), 0.43 (p-value < 0.001), 0.76 (p-value < 0.001), and 0.66 (p-value < 0.001), respectively. The Sheehan Disability Scale (SDS) score is a significant predictor for Classes 1 and 2. Compared to Class 5, an increase in SDS score decreases the likelihood of being in Class 1 and Class 2, with RRs of 0.88 (p-value < 0.01) and 0.88 (p-value < 0.022), respectively. The baseline PHQ-9 score is a highly significant predictor across all classes. An increase of PHQ-9 score increase the likelihood of being in Classes 1, 2, 3, and 4 (RRs of 2.08 (p-value < 0.001), 2.44 (p-value < 0.001), 1.26 (p-value < 0.001), and 1.67 (p-value < 0.001), respectively) compared to the reference group (Class 5). Interestingly, an increase in PHQ-9 score decreases the likelihood of being in a non-response group (Class 6, Moderate, nonresponse) with RR of 0.88 (p-value = 0.021). The variables including gender, race, Alcohol Use Disorders Identification Test (AUDIT), Columbia-Suicide Severity Rating Scale (C-SSRS), Pittsburgh Sleep Quality Index (PSQI), and baseline GAD-7 score are not significant (p-value > 0.05 for all those variables) predictors across any of the PHQ-9 classes compared to the reference group. From these results, we can find that compared to patients in the remission group, older age and lower depression severity show associations with depressive symptom nonresponse.
The associations of baseline patient characteristics with GAD-7 trajectory group membership were as follows. From Table 4, we found that the variable age is not a significant predictor for most GAD-7 classes compared to the reference group (Cluster 5 (High, remission)), except for GAD-7 Class 6 (Moderate, remission), where older age slightly increases the risk (RR = 1.04, p-value = 0.012). Race (non-White) significantly increases the risk of being in GAD-7 Classes 3 and 4 (Moderate, nonresponse1 and nonresponse2) with RRs of 2.05 (p-value = 0.04) and 2.47 (p-value = 0.016), respectively, compared to the reference group. The Patient-Reported Outcomes Measurement Information System (PROMIS) score is a significant predictor. Compared to the reference group (Class 5), an increase in PROMIS score decreases the likelihood of being in Class 1, with RR of 0.82 (p-value < 0.001), however, it increases the likelihood of being in Classes 3, 4, and 6 (RRs of 1.19 (p-value < 0.001), 1.5 (p-value < 0.001) and 1.53 (p-value < 0.001), respectively). The Pittsburgh Sleep Quality Index (PSQI) score significantly increases the risk of being in GAD-7 Classes 3 and 4 (Moderate, nonresponse1 and nonresponse2) (RRs of 1.2 (p-value = 0.016) and 1.21 (p-value = 0.019), respectively) compared to the reference group. The baseline PHQ-9 score significantly increases the risk in Classes 4 and 6 (RRs of 1.13 (p-value = 0.36) and 1.19 (p-value < 0.001), respectively), compared to the reference group. The baseline GAD-7 score significantly reduces the risk in Classes 3, 4, and 6 (RRs of 0.65 (p-value < 0.001), 0.48 (p-value < 0.001) and 0.46 (p-value < 0.001), respectively) compared to the reference group, indicating a lower likelihood of being in these classes as GAD-7 scores increase. The variables including the gender, Alcohol Use Disorders Identification Test (AUDIT), Columbia-Suicide Severity Rating Scale (C-SSRS), and Sheehan Disability Scale (SDS) are not significant predictors across any GAD-7 classes when compared to the reference group.
Discussion
This study investigated short-term trajectories of depression and anxiety symptom severity in a cohort of patients during antidepressant treatment in an outpatient behavioral health clinic. GBTM revealed six distinct depression and anxiety response trajectories. Fewer than half of patients were included in the responder groups for depressive (42.98%) and anxiety (44.89%) related symptoms over weeks 1 to 13 of antidepressant treatment. In depression trajectory groups, lower baseline PHQ-9 score relates to poorer symptom response by comparing mean scores between response or remission (cluster 2, 4, and 5) and non-response (cluster 1, 3, and 6) groups. Similarly, the lower GAD-7 score also relates to poorer symptom response in anxiety trajectory groups. The highest degrees of overlap occurred between PHQ-9 and GAD-7 trajectories that follow synchronous paths (72.55%), suggesting a close relationship between symptoms of depression and anxiety. Several factors measured at baseline were also found to be uniquely associated with some trajectories (e.g., PROMIS, PSQI, SDS, and age).
From Fig. 1, we can observe that higher severity of depression symptoms (PHQ-9 score ≥15) prior to antidepressant initiation was generally associated with lack of change. However, there is a group of patients who achieved a favorable course towards remission despite initiating antidepressant therapy with depression symptoms in the severe ranges. Higher severity of anxiety symptoms (GAD-7 score ≥ 15) prior to antidepressant initiation was generally associated with more change. Other groups (for PHQ-9 and GAD-7) with moderate symptoms at baseline did not show obvious difference between depression and anxiety. This illustrates that baseline severity may be only one of several factors that is correlated with treatment response. In addition, from Tables 3 and 4, compared to patients in the remission group, factors associated with depressive symptom nonresponse included older age and lower depression severity.
Among the responder groups, there were differences in the rate of response, with at least one group demonstrating a slow initial response followed by rapid and sustained improvement in symptoms beginning in the fourth week. This may have clinical relevance in terms of determining at what point a treatment regimen should be reconsidered for a non-responding patient. This finding is juxtaposed with previous studies that suggested clinicians should change or cease treatment if no remarkable improvement was noted by the third therapy session15,16. Baseline demographic and clinical variables related to the identified trajectories of symptom change can be used to predict the most likely trajectory group for treatment response, which has a potential to enhance clinical decision making, optimize resource allocation, and improve treatment outcomes7. Patients who are identified as potential responders to treatment may be candidates for continuing treatment, while those identified as potential nonresponders may pursue alternative interventions, such as psychotherapy, at an earlier time point17.
Another interesting finding emerged from our analysis of patients with overlapping trajectories for anxiety and depression (Fig. 2). Despite the high correlation and increased functional impairment in patients with comorbid anxiety and depression symptoms, little was known about the course of each condition when presenting together in the context of antidepressant treatment. The heatmap analysis showed that most patients had synchronous depression and anxiety trajectories after initiating treatment. In particular, patients who experienced large degrees of depressive symptomatic change similarly experienced large degrees of anxiety symptomatic change. However, there were several asynchronous cases (27.45% patients) where patients who experienced large degrees of depressive symptomatic change experienced small degrees of anxiety symptomatic change, and vice versa. One reason may be attributed to the different dosages of SSRIs sometimes necessary to achieve therapeutic benefits for anxiety as opposed to depression. However, further exploration of the causes for asynchronous change may provide some clarity regarding the interplay of depression and anxiety for patients with comorbid symptoms. Some baseline variables were associated with symptom change or lack thereof. Older age was associated with nonresponse, which supports previous work that showed treatment resistance in older populations18. Lower depression severity at baseline were also associated with poorer response during antidepressant treatment. These associations were obtained based on multivariable models suggesting shared variance between these factors. Clinicians may consider these factors in their treatment plan, and more closely follow patients with these characteristics.
The findings of this study may have implications for clinical practice in antidepressant therapy and personalized clinical management of patients suffering from comorbid depression and anxiety. First, our analysis of the associations of pretreatment characteristics with symptom change may aid clinicians in making treatment recommendations. For example, the ability to identify likely nonresponders at the point of a baseline assessment might encourage clinicians and patients to pursue other treatment options earlier in the course of treatment, thereby reducing unnecessary trial-and-error, delays and risk of adverse effects. The findings might also suggest what risk factors clinicians should be more aware of in terms of evaluating treatment response trajectories. The baseline characteristics information can also be used to help anticipate likely symptom change trajectories, which can support clinical decision-making and lead to better treatment outcomes. The trajectories we described may also aid in the identification of patients whose symptoms are not improving, as well as deciding at what point clinicians should intervene or switch antidepressants or consider adjuvant treatment. On a broader scale, understanding these sub-populations can facilitate clinicians in personalizing care and management for these patients. Furthermore, our analysis showed that, although there are many features and symptoms that overlap between depression and anxiety, there are some that are unique to each. Our analysis of the several characteristics associated with the anxiety and depression trajectories derived in this study lays the groundwork for deeper investigation of the interaction and impacts that one disorder has on the other.
The results of this study should be understood within the context of some methodological limitations. First, because the analysis was limited to patients receiving antidepressant medications, it is not possible to attribute the symptom trajectories to antidepressant treatment as distinct from regression to the mean. Second, this study used data from a single outpatient mental health clinic at an urban academic medical center, including a relatively small sample size, which limits our ability to generalize the model’s utility across multiple different settings and health systems. It will be necessary to replicate the observed response patterns in other cohorts. Third, although commonly associated with the use of EHR data across a single health system, patients may have sought concurrent or previous treatment at sites not affiliated with the health system and therefore not captured within our EHR. This limits our ability to fully control for or reliably measure the influence of such factors on treatment response. Fourth, although all patients had at least moderate symptoms of depression at baseline, a small number of patients (n = 37, 6.4%) initiated antidepressant treatment up to three months before baseline, which potentially introduces a treatment effect at baseline for these patients. Due to dataset limitations, polypharmacy and other categorical diagnoses, which may affect clinical response to antidepressants, were also unable to be considered.
In conclusion, six different trajectories of symptom change for depression and anxiety were derived. The observed trajectories included various paths to symptom response and remission that clinicians may encounter in practice, and casted two often conflated mental health conditions in their own lights. While our analysis also examined several factors associated with certain trajectory responses, deeper understanding of the underlying factors of trajectory-based subgroups may reveal insights into the mixed pathophysiology of depression and anxiety, and motivate strategies to personalize therapy for these conditions.
Methods
Overview
This cohort study used electronic health records (EHRs) and repeated Patient Health Questionnaire (PHQ-9) and Generalized Anxiety Disorder (GAD-7) measurements in 577 patients who received outpatient mental healthcare services and treatment at an urban academic medical center. We used GBTM to identify patients with similar trajectories of PHQ-9 and GAD-7 change following initiation of antidepressant therapy. These trajectory groups were then characterized using comprehensive patient information from their EHRs including demographics, comorbidities, and a variety of scoring instruments and questionnaires. The synchronicity of PHQ-9 and GAD-7 trajectories for individual patients was then described. Finally, a multinomial regression model was built to investigate the associations of prognostic factors with trajectory group membership. The overall study design is illustrated in Fig. 3.
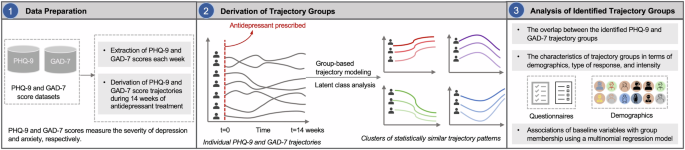
Step 1: PHQ-9 and GAD-7 scores self-reported by patients each week were extracted from two datasets. Step 2: The PHQ-9 and GAD-7 scores trajectory during 14 weeks were constructed. Then, a Group-Based Trajectory Modeling (GBTM) was performed on the top of individual PHQ-9 and GAD-7 score trajectories to identify trajectory groups. Step 3: The characteristics of trajectory groups were analyzed. A multinomial regression model was built to investigate the association of baseline variables with the trajectory groups.
Cohort Description
Individual-level EHR data were obtained from the outpatient behavioral health clinic at a major medical center in New York City. Patients at this clinic were administered multiple mental health and overall physical health related questionnaires as part of routine clinical encounters. Patients (n = 577) with multiple self-reported PHQ-9 (n = 3730) and GAD-7 (n = 3,704) scores between June 13, 2016 and September 26, 2020 were included. Adult patients ( ≥ 18 years old) were included in this study if a) they received antidepressant prescriptions three months before or up to one week after establishing care at the clinic, and b) both PHQ-9 and GAD-7 scores were measured at baseline. The majority of patients (n = 540, 93.6%) initiated antidepressant treatment within one week after establishing care at the clinic. Prescribed antidepressants included selective serotonin reuptake inhibitors (SSRIs) (63.95%), atypical antidepressants (22.18%), serotonin and norepinephrine reuptake inhibitors (SNRIs) (9.53%), tricyclic antidepressants (TCAs) (3.99%), and monoamine oxidase inhibitors (MAOIs) (0.35%).
To ensure sufficient detail to model trajectories of depression and anxiety symptom change, patients (n = 1069) with fewer than three treatment sessions were excluded. For other patients, missing values regarding PHQ-9 and GAD-7 scores during a three-month period were imputed using the last observation carried forward (LOCF) or first observation carried backward (FOCB) method. Note that the missing rate was 38.3% and 40.7% for PHQ-9 and GAD-7, respectively. Since a PHQ-9 score of ≥10 and GAD-7 score of ≥8 represents a reasonable cut-off for identifying probable cases of depressive disorder7 and generalized anxiety disorder19, respectively, patients were also excluded (n = 726) if their baseline assessments were PHQ-9 < 10 or GAD-7 < 8. The inclusion/exclusion cascade for identifying study participants is shown in Supplementary Fig. 1. IRB exemption was granted by the Weill Cornell Medicine (WCM) Institutional Review Board (IRB). The need for informed consent was waived by the ethics committee given the use of fully de-identified EHR data.
Measures
Outcomes
Depression symptom severity was measured with the PHQ-9 using symptom severity ranges of absent (0–4), mild (5–9), moderate (10–14), moderately severe (15–19), or severe (20–27)13. Anxiety symptom severity was measured with the GAD-7 using symptom severity ranges of minimal (0–4), mild (5–9), moderate (10–14), or severe (15–21)14. Response was defined as a follow-up PHQ-9 (or GAD-7) score that was at least 50% lower than the patient’s baseline score6. Remission was defined as achieving a follow-up score of ≤56.
Baseline characteristics
Baseline characteristics include demographic (age, gender, and race), comorbidities (post-traumatic stress disorder (PTSD), bipolar disorder, and “suicidal behavior”), and multiple validated scoring instruments and questionnaires (Alcohol Use Disorders Identification Test (AUDIT)20, Columbia-Suicide Severity Rating Scale (C-SSRS)21; Pittsburgh Sleep Quality Index (PSQI)22; Patient-Reported Outcomes Measurement Information System (PROMIS)23, and Sheehan Disability Scale (SDS)24. More details about these baseline characteristics are included in the supplementary materials.
Statistical analysis
Analysis and the identification of clusters were conducted in R (version 4.0.3)25,26. The number of groups was determined by using the Akaike Information Criterion (AIC), Bayesian Information Criterion (BIC), entropy, and SABIC27,28. Lower AIC, BIC, and SABIC values indicate better model fit, while higher values of entropy indicate better classification quality. In addition, following convention with GBTM models, each class needed to contain at least 5% of the sample for it to be considered meaningful and numerically stable7,8. The univariate and multivariate tests were performed to obtain associations between baseline prognostic factors and trajectory groups. For the univariate analyses, we applied a Chi-square test and a Kruskal-Wallis One-Way analysis of variance (ANOVA) where appropriate. For the multivariate analyses, multinomial logistic regression models were used, where all variables were considered in a single model.
Responses