Reshaping lipid metabolism with long-term alternate day feeding in type 2 diabetes mice

Introduction
Seven hundred million people worldwide will be diagnosed with diabetes in the next 20 years1. Currently, diabetes prevention relies heavily on adjustments in diet composition and/or calorie restriction targeting glucose regulation. While various calorie restriction protocols have been put forth, intermittent fasting (IF) has recently received much attention from the lay press and has become a popular intervention as a lifestyle modification that can be followed for years. Despite this, there are very few mechanistic studies of long-term IF on diabetic subjects. Different IF regimens include alternate-day fasting, fasting a few days per week, and time-restricted fasting, where eating is restricted to a defined window during each day. Currently, 61 clinical trials are registered on clinicaltrial.gov investigating whether time-restricted feeding (TRF) or IF can protect from metabolic syndrome, obesity, prediabetes, and diabetes. These regimens have shown a favorable impact on weight loss and glucose homeostasis in obese prediabetic and diabetic patients, including decreasing fasting glucose, reduced insulin and insulin resistance, and lower leptin levels while simultaneously increasing adiponectin levels; however, less is known about their impact of liver metabolism2. In the US alone, greater than 70% of people with T2D have steatosis, a proportion that climbs to 90% in those with a BMI of greater than 35 kg/m2 3,. Alternate day fasting has been suggested as an innovative non-pharmacological lifestyle strategy to treat fatty liver disease2,4,5,6,7,8,9,10,11, thus understanding its impact on diabetic liver complications is critically needed.
We previously showed that an IF regimen of alternate-day fasting in T2D mice not only increased longevity but also delayed the appearance of diabetic retinopathy12 by restructuring the microbiome and favoring the generation of neuroprotective bile acids such as tauroursodeoxycholate (TUDCA)12. Surprisingly, these beneficial effects occurred without weight loss culminating in a “healthy obese” phenotype and providing evidence that IF beneficially impacts the gut-eye axis12. In the current study, we interrogated the metabolic effects of alternate day feeding on bioenergetics, glucose homeostasis, adipose tissue physiology and liver metabolism. The db/db mouse harbors a mutation in the leptin receptor13, resulting in obesity, hyperglycemia, abnormal glycogen metabolism, hyperinsulinemia, atrophy of insulin-producing pancreatic β-cells14 and elevated serum concentrations of triglycerides15. Db/db mice experience characteristics of diabetic macrovascular16 and microvascular complications including diabetic retinopathy12,17, peripheral neuropathy18 and are prone to liver steatosis19.The metabolic pathways leading to hepatic steatosis include enhanced nonesterified fatty acid release from the adipose tissue, increased de novo lipogenesis, incomplete lipid oxidation and reduced VLDL export20. Insulin resistance has also been linked to increased lipolysis, increased ceramides in plasma and liver resulting in further increased fatty acid uptake in the liver. Insulin resistance results in lipogenesis and decreased mitochondrial efficiency that can lead to lipotoxicity21 and liver damage. IF beneficially influences other tissues, including the brain, by reducing oxidative stress22, increasing levels of the protective factors23, reducing inflammation, improving mitochondrial function and decreasing overall cellular oxidative stress24.
Our study demonstrates that IF has multiple beneficial effects in diabetes. D-IF mice on a 6-month IF regimen showed improved energy expenditure (EE), respiratory exchange ratio (RER) and carbohydrate utilization. The improved carbohydrate utilization was due to improved glucose homeostasis, a result of both increased insulin production and improvement of insulin sensitivity. We show that the white adipose tissue (WAT) of the D-IF mice showed persistent metabolic dysfunction but less inflammation during the fasting period. Metabolomic analysis demonstrated a link between gut-predicted functional changes and blood sphingolipid metabolism. The effect of IF on lipid metabolism was further demonstrated by reduced levels of all classes of lipids, oxidized lipids, and ceramides and dramatically improved lipid composition in the fed state. We found that livers in the fed state were not steatotic, indicating an improvement in substrate utilization with IF. Collectively, these data reflect that chronic IF results in an overall improvement in insulin sensitivity and carbohydrate utilization, a reduction of lipid content in the liver, and a concurrent temporal regulation of inflammation linked to nutrient availability.
Materials and methods
Animals and intermittent fasting
Studies were approved by the University of Florida (IACUC # 201106420) and Indiana University (IACUC #10604 and #11167). Male B6.BKS(D)-Leprdb/J (stock number:000697) homozygous diabetic (db/db) mice and heterozygotes control (db/m) were used as D and C cohorts, respectively. All mice were obtained from Jackson Laboratory (Bar Harbor, ME). Mice were housed in standard laboratory housing conditions, light/dark conditions 12 hr:12 hr (LD), Lux 100-200, 70-80% humidity, 23 °C, in individually ventilated cages, and sterilized water and standard chow diet (2018SX, Teklad global 18% protein, fat 5%, fiber 5%, Harlan, Indianapolis, IN). Mice were housed in the animal care facilities at the University of Florida (IACUC # 201106420) and at Indiana University (IACUC #10604 and #11167). Upon arrival of the animals to the animal care facility, blood glucose was tested weekly, and the mice were considered suitable as a model of diabetes if blood glucose levels remained above 13.88 mmol/l (250 mg/dl) at consecutive measurements. The db/db animals that did not develop diabetes (blood glucose below 13.88 mmol/l) were excluded from the study. After this initial confirmation of diabetes, blood glucose was tested monthly, and HbA1c was measured using a Mouse HbA1c Assay Kit (80310; Crystal Chem, USA) at the completion of the study. At 2 months of age, after diabetes development, the C and D cohorts were randomly assigned to either: AL, where mice had ad-lib access to food or IF, where mice were fasted for 24 hours every other day and had access to food the next day. IF was initiated at the beginning of every other night. This IF protocol was followed for 6 months (alternate day fasting). (Fig. 1).

Db/m (Controls) and db/db (Diabetic) mice were housed in a 12 hr light:dark schedule with ad-libitum access to food and water until they reached 2 months of age and diabetes development was confirmed. Then they were divided into two subgroups: the AL group (ad-libitum), where mice had ad-lib access to food and IF group (Intermittent fasting group) where mice were fasted for 24 hours every other day for 6 months (alternate day fasting). Fasting was initiated at the beginning of every other night. Four cohorts of mice were studied: D-AL: diabetic -ad-lib, D-IF: diabetic-intermittent fasting, C-AL: control-ad-lib, and C-IF: control-intermittent fasting. Samples were collected at the same time of day, as indicated in the figures in all groups. For the IF cohorts, separate samples were collected at the feeding phase (IF-feed) or the fasting phase (IF-fast).
Metabolic Assessment
Body composition was analyzed using EchoMRI Body Composition Analyzer (EchoMRI, Houston, TX) a month before the end of the study (5 months). Indirect calorimetry measures were performed using a TSE systems LabMaster Metabolism Research Platform (Chesterfield, MO) equipped with calorimeter, feeding, and activity system. The experimenters were blind to group assignments during outcome assessment. Each animal was singly housed, and all measurements were performed after a 48-hr acclimation period followed by 48-hr of data collected every 10 min. Results are displayed in terms of mean measurements over a 24-h period as well as during light (0700 –1900) and dark cycles (1900–0700). Energy expenditure was calculated with the Weir formula: EE (kcal/min) = 3.941 x VO2 + 1.106 x VCO2. Carbohydrate utilization [mg/min] was calculated as 4.55 x VCO2-3.21 x VO2, and lipid oxidation [mg/min] as 1.67 x VO2-1.67 x VCO2 as described previously25. Glucose tolerance tests (GTTs) were performed following a 16-hr fast and intraperitoneal injection of 2 g/kg lean mass of D-glucose solution. Blood was sampled from the tail vein at 0, 10, 20, 30, 60, 90, and 120 min, and glucose was measured using a glucometer (AlphaTRAK, Abbott Park, IL). Homeostatic Model Assessment for Insulin Resistance (HOMA IR) was calculated as glucose (mg/dL) x insulin (mU/L)/405 after overnight fast.
Immunohistochemistry
Mice were euthanized using carbon monoxide based on the AVMA Guidelines for the Euthanasia of Animals. PFA fixed paraffin-embedded liver, white adipose tissue (WAT) and pancreas were cut and stained for H&E at the Histology Core at IU. Microscopic examination of liver H&E-stained slides was performed by a veterinary pathologist that was masked to the identity of the experimental groups and the steatosis score was based on an adapted nonalcoholic fatty liver disease score26. WAT sections were stained with MAC-2/galectin-3 for the identification of crownlike structures as described previously27. The adipocyte area was measured on H&E-stained images. Pancreatic sections were stained with the AB_2800361 anti- insulin antibody (Agilent, Santa Clara, CA). Slides were scanned and visualized at the Microscopy Core at the Center for Diabetes and Metabolic Diseases, IU.
Flow cytometry
Whole blood was separated with lympholyte mammal (Cedarlane, Burlington, Canada) and red blood cells were lysed with ACS reagent (Stem cell technologies, Cambridge, MA). Standard cell surface staining protocol was used for the enumeration of monocytes with the following antibodies (eBioscience ThermoFisher, Waltham MA): FITC-CD43 (S7); CD19 (RA3-6B2); NK1.1 (PK136); Ly6G (1A8)], APC-lineage 2 [CD11c (HL3); F4/80 (BM8); IA-b (AF6-120.1)], PECy7-Ly6C (Al-21); BV500- CD45 (30-F11); PE-Texas Red-CD11b (M1/7), BV421 –CD115 (CSF-1R), fixable – viability dye eFluor450. PE- CCR2 (475301) was from R&D Systems, Minneapolis, MN. Samples were acquired on an LSR II flow cytometer equipped with 407, 488, 561 and 630 nm lasers at Simon Cancer Center flow cytometry facility, IU. Data were analyzed using FlowJo software (Tree Star, Ashland, OR). The identity of the samples was masked by the individual performing the analysis.
ELISA
Adiponectin and insulin levels in EDTA plasma collected from the groups at termination of the study (8 mo.) and was analyzed with ELISA according to the manufacturer’s instructions (Abcam, Cambridge UK, ab108785 for adiponectin and ab277390 for insulin).
Quantitative real-time-PCR (qRT-PCR)
Total RNA was extracted from mouse tissue samples using RNeasy Mini kit (Qiagen). Reverse transcription was done with cDNA with iScriptTM cDNA Synthesis Kit (Biorad, Pleasanton, CA). Validated primers were purchased from Thermo Scientific/Applied Biosystems (Carlsbad, CA) and qRT-PCR was carried out using TaqMan master mix (Applied Biosystems, ThermoFisher).
Functional metagenomic content of the gut microbiota
16S ribosomal RNA (rRNA) gene sequences derived from a previous publication with the same cohorts12 were used to estimate the functional capacity of the microbial communities impacted by IF using the Piphillin28 by Second Genome Inc (San Francisco, CA). Estimated KEGG pathways from the AL and IF-Feeding and IF fasting groups of D mice at daytime (ZT8) were analyzed with MicrobiomeAnalyst 2.029 with the Shotgun Data profiling module. Low count, and low variance filters were applied, and data were normalized to cumulative sum scaling. Clustering analysis was used for heatmap generation, and linear discriminant analysis effect size with p-value cutoff 0.1 (FDR-adjusted) and logLDA score 1.5. Finally differential analysis was done for single factor statistical comparisons (treatment: AL, IF-feed, IF-fast) with EdgeR and adjusted p value cutoff 0.05.
Global metabolomics analysis
Blood was collected by cardiac puncture at termination into EDTA tubes and plasma was separated and frozen at −80 °C. Samples (n = 5-6 per group) were sent to Metabolon Inc (Morrisville, NC) and global metabolic analysis was performed with their Metabolon Platform using a Waters ACQUITY ultra-performance liquid chromatography (UPLC) and a Thermo Scientific Q-Exactive high resolution/accurate mass spectrometer interfaced with a heated electrospray ionization (HESI-II) source and Orbitrap mass analyzer operated at 35,000 mass resolution. Following normalization to sample volume extracted, log transformation and imputation of missing values, if any, ANOVA contrasts were used to identify biochemicals that differed significantly between experimental groups (p ≤ 0.05). An estimate of the false discovery rate (q-value) was calculated to consider the multiple comparisons that normally occur in metabolomic-based studies. Lists of statistically significant differential metabolites were used with the MetaboloAnalyst 5.030 for pathway enrichment analysis, PCA and generation of heatmaps.
Liver lipidomic
Monophasic lipid extraction with methanol: chloroform: water (2:1:0.74, v: v: v) was applied to 5 mg of frozen liver tissue and shotgun tandem mass spectrometry approach was performed as previously described31,32. For mass spectrometry analysis, liver lipid extracts were combined with the synthetic internal standards PC(14:0/14:0), PE(14:0/14:0), and PS(14:0/14:0) from Avanti Polar Lipids (Alabaster, AL), and subjected to sequential functional group selective modification of PE and PS lipids using 13C1-S,S’-dimethylthiobutanoylhydroxysuccinimide ester (13C1-DMBNHS), and the O-alkenyl-ether double bond of plasmalogen lipids using iodine and methanol, as previously described33. Peak finding, lipid identification, and quantification were performed using the Lipid Mass Spectrum Analysis (LIMSA) v.1.0 software34 as described32. Lipids were classified into broad lipid classes and two-way ANOVA was used to identify significant differences between C, D and treatments.
Liver microarray analysis
Daytime liver samples from D mice collected at ZT9 from the D- AL and D-IF groups during fed and fasted states were used for microarray analysis. Total RNA was extracted using miRNeasy Mini kit (Qiagen, Valencia, CA) and standard procedures were used for hybridization, staining, and scanning GeneChip Mouse Gene 2.0 ST Arrays (Affymetrix, Santa Clara, CA). CEL files were analyzed with Expression Console software (Affymetrix), the statistical analysis was performed with Transcriptome Analysis Console Software (Affymetrix), and gene-level RMA was used for normalization. ANOVA method (eBayes) was used for identifying differentially expressed genes and a cut off > 2.0 (+/-) fold change and FDR < 0.05 was used for identifying differentially expressed genes. Principal Component Analysis was plotted using normalized values for all the genes profiled using the ClustVis software35. Pathway analysis was generated with the TAC software. Ingenuity pathway analysis (IPA) (Qiagen) was used for upstream regulation analysis.
Statistical analysis
A power calculation based on the preliminary data on respiratory exchange rate demonstrated that we need to begin the studies with 5 mice/group (effect size 2.233, actual power 0.952). Most statistical testing was done with two-way ANOVA (disease, treatment) followed by post hoc tests using GraphPad, Prism, (La Jolla, CA). We used ANCOVA models with random subject to account for within-subject correlation for data from indirect calorimetry. Covariates analyzed were Group (Control AL; Control IF; Diabetes Al; Diabetes IF), Feeding vs Fasting, Time, Weight and Glucose. Comparison of AL vs IF within groups (control or diabetes) was conducted using LSMEANS with Bonferroni corrected p-values to control for multiple testing.
Results
Impact of IF on the bioenergetics in diabetic mice
Diabetic-IF mice did not exhibit weight loss (Fig. 2A) or any changes in body fat (Fig. 2B), but they had a reduction in lean mass (Fig. 2C). Control- IF gained fat mass. Both groups on IF ate more food during their feeding phase (Supplemental Fig. 1A), but diabetic IF mice did not differ in their activity levels with treatment, in contrast to control IF mice that showed higher activity with IF (Supplemental Fig. 1B).
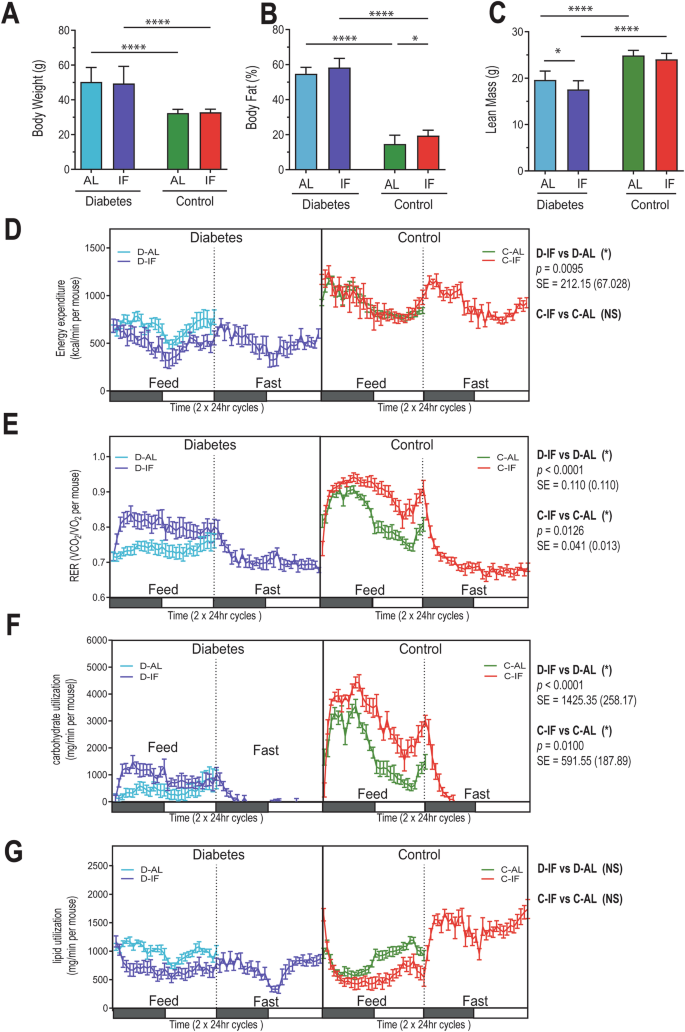
Mice (n = 8) from each cohort (D-AL: diabetic-ad-lib, D-IF: diabetic-intermittent fasting, C-AL: control-ad-lib, and C-IF: control-intermittent fasting) were assessed for body composition and indirect calorimetry after a 48-hr acclimation period followed by 48 hr. of data collection every 10 min. (A) Gross body weight (gr), (B) percentage of body fat, and (C) percentage of lean mass analyzed using the EchoMRI Analyzer. (D) Energy expenditure, (E) respiratory exchange ratio (RER), (F) carbohydrate utilization, and (G) lipid utilization were assessed with the TSE systems LabMaster Metabolism Research Platform. Two-way ANOVA was used for (A–C), *p < 0.05, ****p < 0.0001. ANOCOVA was used for (D–G).
Metabolic rate, measured as EE, showed that diabetic-IF exhibited a significant reduction of EE (D-IF vs D-AL p < 0.001) (Fig. 2D), which was not observed in the C-IF group. Despite this, the RER (Fig. 2E), which indicates substrate utilization, was increased in both IF groups (D-IF vs D-AL p < 0.001, C-IF vs C-AL p = 0.0126). An increase in carbohydrate utilization was observed in both IF groups compared to their AL counterparts (D-IF vs. D-AL p < 0.001, C-IF vs. C-AL p = 0.01) (Fig. 2F), but lipid utilization remained unchanged (Fig. 2G). Collectively, these results support that IF in diabetic mice did not result in weight loss, possibly due to the reduction in EE observed; however, the D-IF mice showed improved RER and carbohydrate utilization.
Impact on glucose homeostasis and insulin sensitivity
We then examined whether IF improved glucose homeostasis in the diabetic cohort. D-IF mice had reduced glycated hemoglobin (Fig. 3A), improved random glucose (Fig. 3B), reduced fasting glucose (Fig. 3C) and better glucose tolerance (Fig. 3D, E). HOMA-IR, a surrogate for insulin resistance, suggests that IF improved insulin sensitivity in the diabetic cohort (Fig. 3F). To examine if IF increased insulin production, pancreatic sections were stained for insulin immunoreactivity. D-IF mice presented significantly more insulin-positive cells compared to D-AL mice suggesting that beta cells are generating more insulin (Fig. 3G, H). Basal levels of insulin in the blood, however, were similar between D-AL and D-IF (Fig. 3I). Collectively, this data show that chronic IF improved glucose homeostasis in db/db mice by increased insulin sensitivity and glucose clearance.
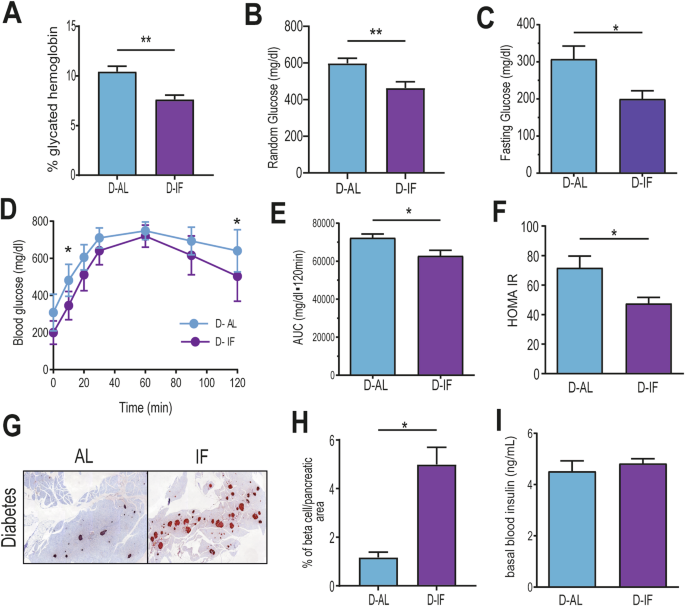
Mice (n = 6-8) from D-AL: diabetic -ad-lib, and D-IF: diabetic-intermittent fasting) were assessed for (A) glycated hemoglobulin, (B) random glucose, and (C) fasting glucose measured after a 6-hour fast during the day. (D) Glucose tolerance test (GTT) was performed following a 16 hr fast and intraperitoneal injection of 2 g/kg lean mass of D-glucose solution, and (E) area under the curve for GTT was calculated. (F) HOMA-IR was calculated with fasting glucose and insulin levels in blood taken from mice during midday after 16 hour fast. (G) Insulin-positive cells in fixed pancreatic sections (5 sections per mouse). (H) The percentage of insulin-positive area/ pancreatic area was calculated. (I) Circulating basal insulin levels in blood. T-tests, asterisks indicate statistical difference *p < 0.5, **P < 0.01, ****p < 0.0001.
Impact on white adipose tissue (WAT)
We next asked whether IF could correct the dysfunction and inflammation typically observed in WAT in mice with metabolic syndrome36. Adipocytes from D-IF mice were of similar size as adipocytes from D-AL mice (Fig. 4A, B). Consistent with WAT insulin resistance, D mice had decreased adiponectin levels, which were not restored by IF (Fig. 4C). Expression levels of key genes that regulate lipolysis (lipe, pnpla2) and genes related to fatty acid synthesis (fasn and acaca) were examined (Fig. 4D). As expected, lipe was increased during the fasting phase of the IF regimen in the diabetic cohort but pnpla2. No changes were observed with fasting in fasn and acaca. In contrast, these genes were significantly increased in the control IF cohort. Collectively, these data suggest that lipolysis was increased in the D-IF mice during fasting, but overall lipid metabolism remained dysregulated in WAT.
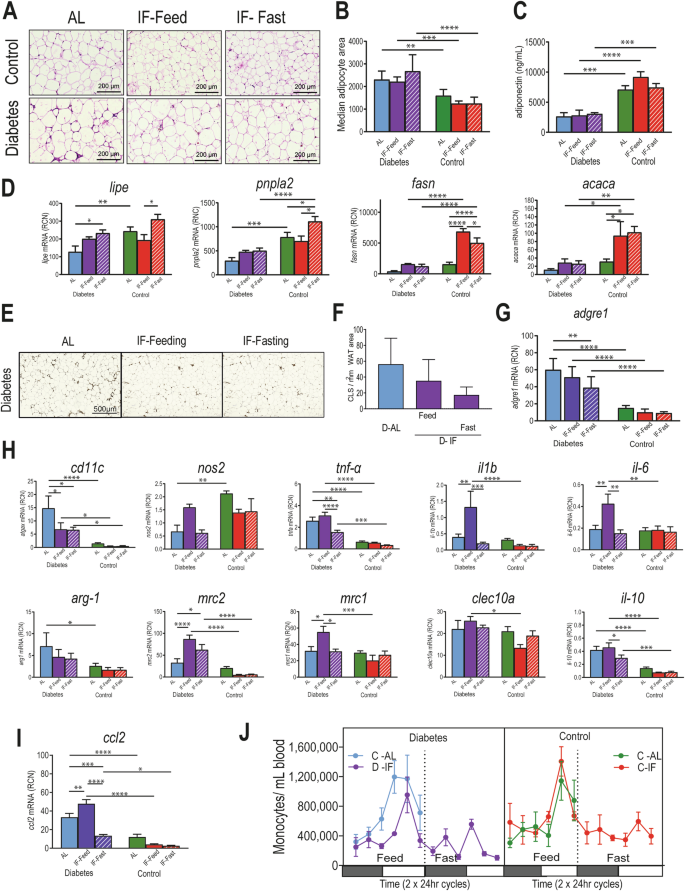
Epididymal fat and blood samples were collected from mice (n = 5) from each cohort (D-AL: diabetic-ad-lib, D-IF: diabetic-intermittent fasting, C-AL: control-ad-lib, and C-IF: control-intermittent fasting) after 6 months of IF for further assessment. Samples were all collected at the same time of the day (A) H&E staining of fixed WAT. B adipocyte size shown in bars was measured as adipocyte area. C adiponectin levels in plasma measured by ELISA. D mRNA gene expression of lipe, pnpla2, fasn, and acaca in total RNA isolated from WAT at midday. E Mac-2 staining in fixed WAT and (F) counts of Mac2 positive crown like structures per 1mm2 WAT area. G mRNA expression of adgre1 (F480), as another indicator of macrophages. H mRNA gene expression of genes associated with M1 macrophages (atgax, nos2, tnfa, il-1b, and il-6) and genes associated with M2 macrophages (arg1, mrc2, mrc1, clec10a, and Il-10). I mRNA expression of chemokine Ccl2 in WAT. J Numbers of circulating monocytes in blood identified by flow cytometry. Two-way ANOVA: asterisks indicate statistical difference *p < 0.5, **P < 0.01, ***p < 0.001, ****p < 0.0001.
We next examined markers of WAT inflammation. Crown-like structures, identified as Mac2 staining, a hallmark of proinflammatory processes in WAT, showed a trended decrease in D-IF compared to D-AL mice (Fig. 4E, F). The mRNA expression of the F480 antigen, adgre1, confirms significant reduction of macrophages in the D-IF fasted cohort (Fig. 4G). To examine the polarization of WAT macrophages, we measured mRNA expression levels of M1 gene signature (atgax (Cd11c), nos2, tnfα, il-1β and il-6) and M2 (arg1, mrc2, mrc1, clec10a and il-10) (Fig. 4H). D-AL mice had increased expression of atgax, tnfa, arg1, and il10 compared to controls, and IF treatment, especially during the fasting period, reduced them. Gene expression for inflammatory cytokines, tnfα, il-1β and il-6, were increased during the feeding period in the IF treatment, however, they were significantly suppressed with fasting, implying that food availability was linked to an inflammatory state. From the M2 markers, similar regulation based on food availability was observed for mrc1 and il10, with increased expression during the feeding period and suppression during fasting.
We then examined whether this temporal regulation of inflammation was linked with the kinetics of monocyte infiltration to WAT. To accomplish this, we examined the expression of ccl2 mRNA, a chemokine that dictates inflammatory monocyte trafficking into tissues. Cccl2 mRNA expression was significantly increased in WAT under diabetic conditions and remained elevated during the feeding period but was significantly suppressed during the fasting period in D-IF mice (Fig. 4I). Similarly, the levels of circulating CCR2+ monocytes in both IF cohorts were depleted from the circulation during the fasting period of IF (Fig. 4J). Altogether, these results suggest chronic IF during fasting showed that one lipolytic gene was increased, suggesting at least some restoration of the physiological response to fasting; however, gene expression for other enzymes did not change supporting persistent metabolic dysfunction. Inflammation of WAT only occurred in diabetic mice and showed that WAT had fewer resident macrophages and inflammation mostly during the fasting period.
IF affects sphingolipid metabolism in the gut microbiome
Previously, we demonstrated that IF cohorts had a unique microbiota signature with increased microbial species that generated secondary bile acids such as TUDCA, which reduced inflammation in the retina and prevented diabetic retinopathy12. Using this microbiome data, we performed a predictive functional microbiome analysis and demonstrated that the fasting microbiome was enriched in bacterial species predicted to regulate energy metabolism, phosphatase and tensin homolog (PTEN), sphingolipid metabolism, N-glycan biosynthesis, and RNA degradation. In contrast, bacteria predicted to participate in iron transport, phosphotransferase and phenylalanine metabolism were reduced (Fig. 5A–C). This data brings attention to the importance of including changes in microbiota when assessing host metabolic responses. Further emphasizing this point is the knowledge that bacterial sphingolipids can be processed via mammalian sphingolipid pathways37.
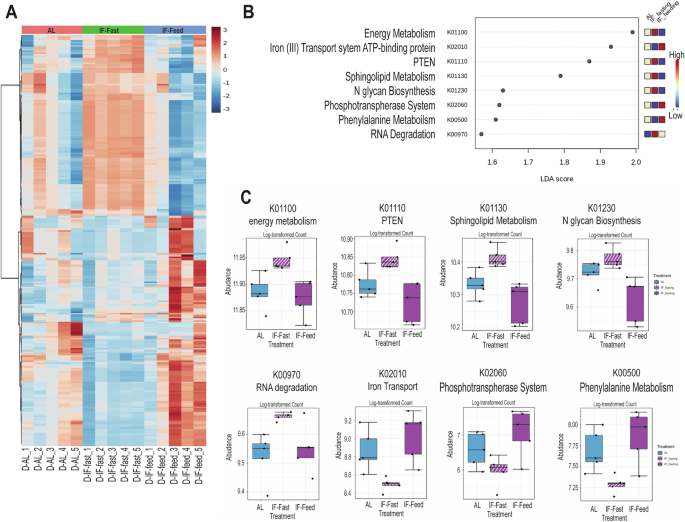
D-AL: diabetic -ad-lib, D-IF: diabetic-intermittent fasting (Feed/Fast). 16S rRNA sequences from samples collected at the same time of the day were selected for the analysis. Samples were collected at 6 months of IF treatment (n = 5). (A) heatmap of KEGG pathways from 16S ribosomal RNA sequences from faeces isolated in D-AL, D-IF in feeding and in fasting (daytime) indicate clustering based on the feeding/fasting cycle. (B) Linear discriminant analysis effect size with logLDA score <1.5. (C) averaged abundance counts for each KEGG pathway shown in B.
IF results in unique blood metabolic signature in diabetic mice
The complexity of interpretation of microbiome studies leads us to perform a global metabolomics analysis on blood samples isolated during the day (ZT5) in the four cohorts. The presence of diabetes affected 422 metabolites. IF treatment affected 178 metabolites (Fig. 6A and Supplemental Table 1). When D-IF-Feed mice were compared to D-AL, beta-oxidation of medium and very-long chain fatty acids, sphingolipid metabolism and general fatty acid biosynthesis was reduced, while bile acid, steroid and glycerolipid biosynthesis pathways were increased (Fig. 6B). When D-IF-Fasting mice were compared to D-IF-Feeding, as expected oxidation of medium and very long chain fatty acids was upregulated, and many biosynthesis pathways were reduced (Fig. 6B). Both D and C groups utilized beta-oxidation during fasting, as 3-Hydroxybutyrate (BHBA) was significantly elevated compared to non-fasted samples and returned to a lower level during the re-feeding period (Fig. 6C). D-AL mice are expected to have increased lipid utilization, but while BHBA was not found to be as elevated in the AL stage compared to the IF-fast state, acetyl-carnitines were increased (Supplemental Fig. 2A–C) and, with long-term IF, they were significantly reduced in the fed state and only increased in the fasted state (Supplemental Fig. 2C), indicating an improvement in fatty acid metabolism with IF. The D-IF fasted mice had elevated levels of long-chain fatty acids in the blood, supporting active lipolysis from WAT (Fig. 6D). Moreover, the metabolomics analysis reinforced that sphingolipid metabolism is affected by IF (Fig. 6E–I). Total ceramide species, including hexylceramides, and ceramides containing C16 and C18 acyl chains, were significantly reduced in D-IF compared to D-AL, especially at the fast state. Collectively, these data strongly support that lipid metabolism was dramatically impacted by IF in the diabetic cohort.
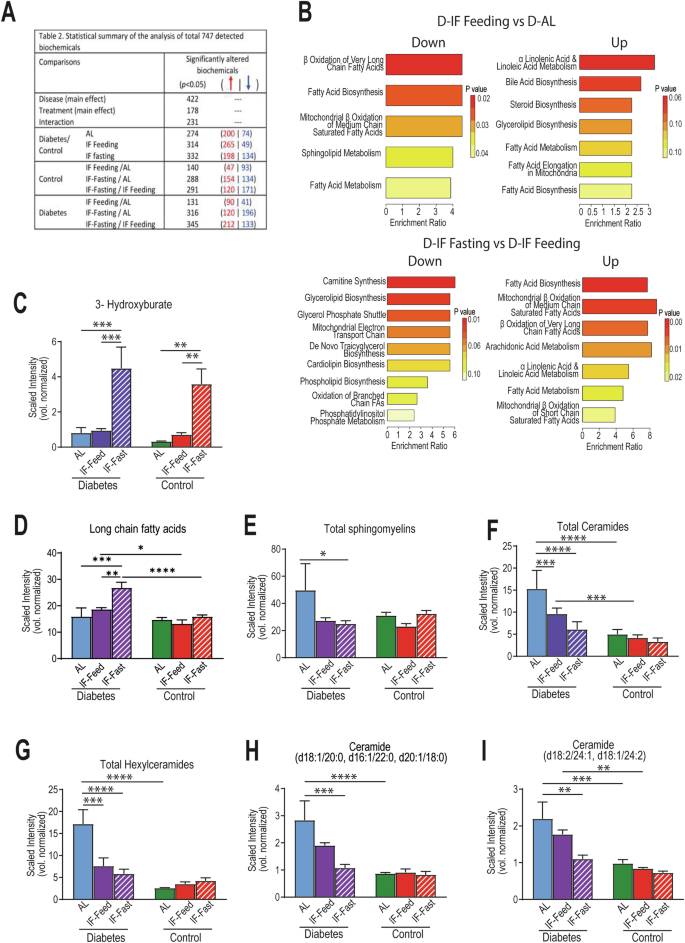
Plasma samples were collected from mice (n = 5) from each cohort (D-AL: diabetic-ad-lib, D-IF: diabetic-intermittent fasting, C-AL: control-ad-lib and C-IF: control-intermittent fasting) after 6 months of IF at midday (ZT5). Global metabolomics analysis performed by Metabolon Inc. (A) summary of statistical analysis of the identified metabolites using a global untargeted metabolomics platform. (B) Enrichment analysis of the metabolites that were found to be differentially expressed in control and diabetes during their response to IF-feeding and IF-fasting. (C) levels of 3-hydroxyburate, (D) levels of long chain fatty acids and (E–H) levels of components of sphingolipid metabolism. Data were normalized to sample volume extracted (vol normalized). Two-way ANOVA: asterisks indicate statistical difference *p < 0.5, **P < 0.01, ***p < 0.001, ****p < 0.0001. p < 0.05.
Impact on liver lipid composition
The liver is central to both lipid and glucose metabolism, we therefore examined the effects of IF on liver pathology and lipid content. Liver steatosis scores26 were significantly elevated compared to control and they showed a trend toward improvement with IF (Fig. 7A, B). Using mass spectrometry for both polar and non-polar lipids32, we observed striking changes in lipid content with the IF treatment (Fig. 7C and Supplemental Table 2) D-IF mice in the fed state show the appropriate reduction in lipid species compared to D-AL reinforcing the notion that IF results in better lipid handling by the diabetic liver. Livers from D-AL mice had increased levels of most lipid species compared to healthy control mice apart from sphingomyelins (Fig. 7D). An influx of lipids is observed in the diabetic livers during the fasting state, possibly because of increased WAT lipolysis, however, these lipids were vastly different compared to D-AL (Fig. 7E). All phospholipids, oxidized lipids, and hexylceramides were significantly reduced, especially in the fed state, but they remained reduced during fasting (Supplemental Fig. 3), despite the influx of lipids in the liver. Moreover, total triglycerides (Fig. 7G), total diglycerides (Fig. 7H), cholesterol esters (Fig. 7I) and total hexyl-ceramides (Fig. 7H) were dramatically reduced in the D-IF fed compared to D-AL mice. A detailed comparison of the glycosylated ceramide species suggests reductions of those containing C24:0 and C24:1 long-chain fatty acids (Fig. 7H). Taken together, alternate feeding/fasting cycles significantly impacted lipid metabolism in the diabetic liver, reduced levels of all classes of lipids, oxidized lipids, and ceramides, and dramatically improved lipid composition in the fed state, indicative of improved insulin sensitivity.
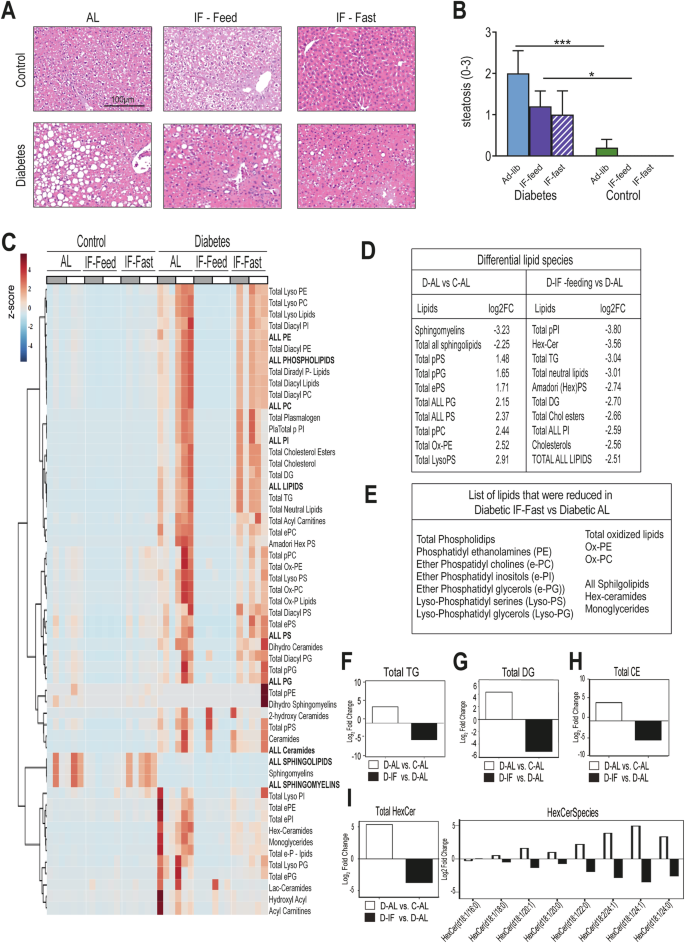
Liver samples were collected from mice from each cohort (D-AL: diabetic -ad-lib, D-IF: diabetic-intermittent fasting, C-AL: control-ad-lib and C-IF: control-intermittent fasting) after 6 months of IF. (A) H&E staining of fixed liver tissue. (B) Liver steatosis scores (n = 5). One-Way ANOVA *p < 0.05, ***p < 0.001. (C) Heatmap of lipid classes identified by high resolution/accurate mass spectrometry from liver lipid extracts. Samples (n = 3) collected at 6 time points throughout day /night. Data was normalized to sample weight extracted, and z-scores were mapped. (D) Significant differential lipid species in D-AL vs C-AL and D-IF-Feeding vs D-AL. (E) Significant differential lipid species between D-AL vs D-IF-Fasting. Summary of all (F) triglycerides, (G) diglycerides, (H) cholesteryl esters (CE), and (I) hexosylceramides and abundance of individual HexCer molecular species. Data are shown after log2 transformation of the fold change of D-AL over C-AL (open bars) and D-IF fed over D-AL mice (closed bars). Lipid species are presented as total fatty acid carbons: total double bonds. For (B–I) data represent daytime (ZT9).
IF has pleiotropic effects on liver lipid metabolism
To better understand the mechanisms responsible for the changes we observed in the D-IF liver, we examined gene expression under feeding and fasting conditions and compared the changes to D-AL. Using microarray studies of livers, we found a total of 650 genes that were differentially expressed in pairwise comparisons demonstrating a higher than two-fold change (Supplemental Table 3). The majority of differentially expressed genes (503 genes) were driven by the feed/fast cycle. In contrast, only 95 differentially expressed genes were observed when both groups were in the fed state. Heatmap (Fig. 8A) and PCA analysis (Fig. 8B) confirmed that most differences were driven by the feeding/fasting cycle. The D-AL liver is closer to the D-IF liver during the feeding cycle than the fasting showing fewer gene changes (Fig. 8C) than when comparing D- IF fed to fasting (Fig. 8D).
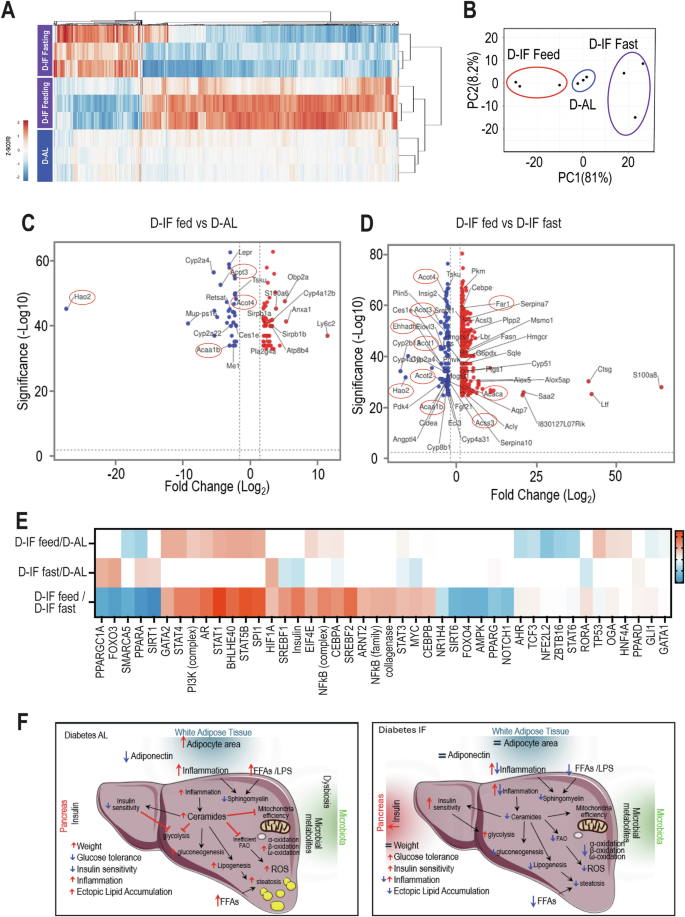
Liver samples were collected from mice (n = 3) from each cohort (D-AL: diabetic -ad-lib, D-IF: diabetic-intermittent fasting, C-AL: control-ad-lib and C-IF: control-intermittent fasting) after 6 months of IF. Liver microarray analysis was done for diabetic samples (n = 3/cohort) collected at ZT9. (A) heatmap and cluster analysis of the differential genes in livers from diabetic mice after IF compared to AL conditions. (B) Principal Component Analysis of differentiated genes. (C) Volcano plots showing genes that were significantly changed in IF-fed vs. AL conditions. (D) Volcano plots showing genes that were significantly changed in Diabetic IF-fed vs. IF fasted conditions. (E) Comparative ingenuity pathway analysis of upstream regulators of the differentially expressed genes. (F) Graphical summary of long-term effects of IF on function of liver in db/db mice. Left panel: D-AL mice exhibit insulin resistance, impaired glucose tolerance, decreased insulin sensitivity, dysbiosis, increased inflammation, and ectopic lipid accumulation. Right panel: In the absence of weight loss, D-IF mice experienced enhanced glucose tolerance and insulin sensitivity reflected in increased carbohydrate utilization and reduced lipid accumulation in the liver during feeding. IF-treated diabetic mice showed reduced inflammatory pathways during the fasting state. Functional prediction analysis of the gut microbiome showed that D-IF mice had enrichment in bacterial pathways involved in sphingolipid metabolism. Plasma and liver lipidomics demonstrated an overall reduction of lipids, in particular ceramide levels and oxidized lipids. Oxidation of fatty acids was dramatically reduced, indicating increased insulin sensitivity, better mitochondrial metabolism and reduced reactive oxygen species resulting in improved overall lipid metabolism.
D-IF during the fed state resulted in upregulation of liver genes that belonged to pathways of long-chain fatty acid metabolic processes, fatty acid metabolism, PPAR signalling, arachidonic and eicosanoid metabolism, regulation of phagocytosis, adaptive immunity, neutrophil degradation lipid transport and distribution (Obpa2a, Atp8b4), and immune regulation (Sirpb1, Sirbp2) compared to D-AL. Genes that were downregulated in D-IF-feed mice compared to D-AL mice were related to peroxisomal and fatty acid metabolism- especially those of long-chain fatty acids (Hao2, Acot3, Acot4, Acaa1b, Me1, Mogat1, Cyp2a4, Cyp2a22)- as well as cholesterol metabolic processes (Ces1e, Lepr, Tsku). Collectively, these data indicate that D-IF mice during the fed state did not need to rely as much on perixosomal oxidation and lipid oxidation compared to the D-AL mice.
When comparing D-IF in the fed state to the fasting state (Fig. 8D), D-IF mice showed downregulation of genes related to fatty acid metabolism (Elovl3, Crat, Cyp2a4, Cyp2b13, Ces1e, Acot1, Acot2, Acot3, Acot4, Acaa1b, Hao2, Pdk4, Plin5, Eci3, Insig2, Ehhadh, Cyp8b1), PPAR signaling (Aqp7, Cy4a10, Angptl4, Ehhadh, Acaab1, Cyp4a31, Cyp4a32) and lipid peroxidation (Crat, Pdk4, Hao2, Plin5, Eci3, Ehhadh, Acaa1b). On the other hand, D-IF fed mice showed increased expression of inflammatory genes, belonged to immune cell activation, migration and inflammation and cholesterol metabolism (Cyp51, Fasn, Hmgcr, Hmgcs1, Lss, Scd2, Soat1, Sqle, Srefb1, Msm1, Pmvk3, Acsl3, Lbr).
To identify the cascade of upstream regulators that could explain the observed gene changes, we used the Ingenuity upstream regulator analysis in IPA (Fig. 8E). When comparing D-IF in the fed state to D-AL mice, transcriptional factor proteins that were predicted to be upstream regulators included those for insulin and growth factor signaling (PI3K, STAT3, HNF4A), cytokine signaling (NFκΒ, STAT1, STAT4, STAT5B), immune cell differentiation (GATA2) and factors influencing the circadian clock (HNF4A, BHLE40). On the other hand, transcriptional factor proteins PPARA and transcriptional repressor ZBTB16 were predicted to be downregulated. The reduction of PPARA in the fed state is in accordance with our lipidomic and transcriptomics analysis showing that the liver of D- IF mice had a significant reduction of fat oxidation supporting improving carbohydrate utilization. However, inflammatory signaling remained elevated, like what was observed in the white adipose tissue, suggesting that inflammatory pathways were suppressed only during the fasting phase. Long-term IF is predicted to upregulate key lipid regulators such as PPARA, PPARG, PPARD, and PPARGC1A. On the other hand, insulin signaling was reduced during fasting in the absence of nutrients. Key predicted lipid master regulators were validated by qRT-PCR (Supplemental Fig. 4). Altogether, these data show that long-term imposition of restricted feeding/fasting cycles provides transcriptional flexibility linked to nutrient availability, such as genes linked to insulin signaling, inflammation, and lipid and cholesterol metabolism.
Discussion
Our study, to our knowledge, is the first to examine the impact of long-term IF on D mice. We demonstrated that D-IF mice on a 6-month IF regimen showed improved EE, RER, and carbohydrate utilization. The improved carbohydrate utilization was due to improved glucose homeostasis in D- IF mice a result of both increased insulin production and improvement of insulin sensitivity. The adipocytes of the D-IF mice showed persistent metabolic dysfunction but a reduction of inflammation with fewer resident macrophages during the fasting period (Fig. 8F). Metabolomics analysis demonstrated a link between gut-predicted functional changes and blood sphingolipid metabolism as we showed that the microbiome of the D-IF mice parallels the metabolic changes observed in the host with bacteria demonstrating changes in energy metabolism and sphingolipid metabolism. Alternate feeding/fasting cycles significantly impacted lipid metabolism in the diabetic liver by reducing levels of all classes of lipids, oxidized lipids, and ceramides, and dramatically improving lipid composition in the fed state. Fatty acids were reduced in the fed state and were only increased in the fasted state indicating an improvement in fatty acid metabolism with IF. Total and key ceramide species, including hexylceramides, and ceramides containing C16 and C18 acyl chains, were significantly reduced in D-IF compared to D-AL, primarily during the fasting state. Long-term IF is predicted to upregulate key lipid regulators such as PPARA, PPARG, PPARD, and PPARGC1A. Collectively, these data reflect that chronic IF results in an overall improvement in insulin sensitivity and carbohydrate utilization with a concurrent transcriptional flexibility in lipid metabolism that is linked to nutrient availability.
A main finding of this study was that long term IF in diabetic mice improved their ability to utilize carbohydrates, improved glucose homeostasis and increased insulin sensitivity. Indirect calorimetry showed enhancement in carbohydrate utilization in the D-IF mice, which was corroborated by reductions in glucose levels and increased insulin release from the pancreas. Alternate day fasting has been extensively studied in humans but its effects on insulin sensitivity in individuals with diabetes remains controversial38,39. In individuals with T2D, restricting eating to two meals per day improves insulin sensitivity40, calorie restriction of two days per week41 reduced HbA1c level and 10 hour time restricted feeding for 3-months reduced body weight, improved fasting glucose and increased insulin sensitivity42. One murine study showed that IF in diet-induced obese mice improved insulin sensitivity43. These results corroborate current appreciation of the beneficial effects of fasting protocols, especially regarding beta cell preservation, such as the effects of fasting-mimicking diets (an intermittent fasting cycle of fasting for 3-5 days every 1 or 2 months)44. Like the latter study, we also observed that alternate-day fasting increased significantly beta cell mass in our D-IF cohort.
The improvement in metabolic health in our diabetic cohort was not linked to weight loss. Despite studies showing that short-term IF can result in weight loss in humans and mice42,45,46,47,48,49,50,51, our study, which used long-term IF in db/db mice, did not demonstrate weight loss. This is consistent with our previous study12 wherein we described chronic IF lead to a “healthy obese phenotype”. In agreement with not losing weight, Templeman et al. demonstrated that alternate-day fasting less effectively reduced body fat mass than a matched degree of daily energy restriction52. Our D-IF mice did not show a reduction in adipocyte size despite evidence of increased lipolysis. This could be due to reduced EE. However, the preservation of fat depots with IF has been previously reported by Harney et. al53, where it was identified that IF resulted in resistance to lipolysis due to fasting-induced downregulation of the b3 adrenergic receptors in adipocytes. Whether this occurred in our study would need further exploration with a focus on the WAT metabolism. Our study also supports those of Harney et al. and Liao et al., as both demonstrate fat maintenance during calorie restriction conditions or IF and despite no weight loss better survival in mouse models12,54. The typical effect of caloric restriction or IF, that we also observed, was a reduction in inflammation and ectopic fat deposition53. In agreement with others, we show that fasting depleted monocytes in the circulation with fewer cells recruited into adipose tissue and the liver, a process suggested to be dependent on liver lipid metabolism through PPARA55. This temporal regulation of inflammation could be the basis of improved insulin sensitivity, survival and many of the beneficial effects of IF in the absence of weight loss.
Another major point of our study was the reduction of ceramide species, specifically C16 and C18 ceramides, key regulators of insulin sensitivity and liver fatty acid oxidation56. We showed that the key lipid metabolic regulator PPARA and the transcriptional repressor ZBTB16 were downregulated in the fed state of the D-IF mice indicating a reduction in both lipid oxidation and insulin resistance57. Incomplete fatty acid oxidation is the primary source of lipid accumulation and lipotoxicity in T2D and obesity56. In the D- IF mice PPARG, PPARGC1A, and FOXO1 were elevated only during nutrient deprivation (at the fasting phase) in contrast to AL diabetic mice supporting that IF restored physiological regulation of lipid oxidation and autophagy. Thus, long-term IF corrected the abnormal lipid oxidation seen in the D-AL mice, improving elements of incomplete beta oxidation and in particular, peroxidation and oxidation of long-chain fatty acids, supporting less oxidative stress and lipotoxicity in the D-IF mice. Our comprehensive lipidomics showed that all the oxidized lipids and key lipid species, triglycerides, cholesterol esters, diacylglycerol and hexosylceramides were reduced in the D-IF mice compared to the D-AL mice.
Ceramides, a type of sphingolipids, have been implicated in the development of a range of metabolic disorders from insulin resistance to hepatic steatosis. In mammalian tissues, sphingolipids are both obtained from diet and generated by de novo synthesis. Because our liver microarray did not show downregulation of specific ceramide synthesis genes, but we observed significant reductions in total ceramides and hexylceramides, we postulate that the reduction in liver ceramide is due to IF-mediated changes in the gut microbiome with either bacterial degradation or gut mediated improvement of host ceramide degradation. Gut bacteria are inextricably linked to host metabolism. Specifically bacterial sphingolipids can be absorbed and detected in various organs throughout the body of the host37,58,59. Sphingolipids produced by Bacteroidetes species in the gut have been found to directly impact host lipid metabolism, lipid storage, liver function, as well as improve respiration of liver cells in vitro37. Of note, the presence of microbiota derived sphingolipids has been shown to be sufficient to reverse fatty liver disease in mice37. In agreement with this, we and others have shown that microbiome changes are a major driver of reversal of diabetes-induced complications12,45.
A major limitation of our study is the lack of additional mechanistic studies to pinpoint the exact pathways and targeted tissues, such as brain signals, adipose lipid turnover, and muscle insulin resistance, all of which could influence lipid content in the liver. We interpret our results as IF impact all tissues of the body and majorly, the beneficial effects are the result of improvements in insulin sensitivity, which allows better carbohydrate utilization. We focused on reductions in ceramide content both in blood and liver that have been linked to improvements in insulin sensitivity, but this study only highlights that additional studies into cross-tissue communication are needed to dissect the impact of pleiotropic treatments such as IF.
In summary, our study showed that D-IF mice showed improvements in both lipid and carbohydrate utilization (Fig. 8F). Long-term IF dramatically regulated WAT inflammation and systemic monocytosis. Functional analysis of gut microbiota shows that the bacteria of the IF microbiome have higher sphingolipid metabolism compared to that of D-AL mice, and this may specifically influence ceramide metabolism and drive the observed improvements in the liver cells we observed. Reductions in ceramides contribute to improved liver histology and metabolism as it is well established that both metabolic syndrome and T2D exhibit ceramide overproduction which is linked to lipotoxicity, insulin resistance and mitochondrial dysfunction60. We convincingly show using “multiomics” approach that long-term IF improves glucose homeostasis, insulin sensitivity while significantly reducing liver pathology and liver lipid content.


Responses