SMRT-depleted conventional DCs maintain inflammation despite lower glycolysis via mTOR signalling and succinate oxidation

Introduction
Regulation of inflammatory cues in DCs is primarily achieved by NF-kB activation and metabolic reprogramming adjustments1,2. Pro-inflammatory signals induce stimulatory capacities in DCs by undergoing a metabolic switch from oxidative phosphorylation (OXPHOS) to glycolysis3,4. Early induction of glycolysis is largely dependent on the TBK1/IKKɛ/AKT signalling cascade whereas, at later time points, induction of the AKT/mTOR/HIF-1α pathway takes the lead5,6. The precise regulation of glycolytic metabolism and fatty acid synthesis (FAS) depends on mTOR signalling in DCs7. From an immunological point of view, studies depicted both pro and anti-inflammatory role of mTOR inhibition in DCs8, which is activated by TLR-specific signalling, growth factors, nutrients, or by amino acids9. This ultimately leads to the upregulation of glucose transporters like GLUT1, and glycolytic enzymes, phosphofructokinase (PFK), pyruvate kinase-2 (PKM2), and lactate dehydrogenase (LDHA). Similarly, subsequent inhibition of mTOR results in reduced glucose uptake and lactate production10.
Enhanced glycolysis after DC activation is also crucial for their migration and upregulation of costimulatory molecules, which in turn is necessary to educate naive T helper (Th) cells towards different Th phenotypes like Th1, Th2 or Tregs11. Glycolytic pro-inflammatory DCs produce more reactive oxygen species (ROS) and show enhanced FAS, essential for secreting key proteins for activation by modulating ER stress responses5. Perturbation of glycolysis either with 2-DG or by galactose is known to subdue their inflammatory phenotype4. However, a limited number of studies showed that disruption of glycolysis during the activation process enhances the release of IL-23 in human DCs12. Similarly, murine DCs depict enhanced Th17 potential when treated with 2-DG5. In line with this, increased intake of extracellular fatty acids renders DCs glycolysis deficit but with strong inflammatory potential13.
TLR-specific stimulation also promotes rewiring and accumulation of TCA cycle metabolites/substrates-α-KGA, succinate, fumarate, malate, etc. These metabolites function as immunomodulatory signals14. It is difficult to identify the transcriptional regulators controlling the immune-metabolic characteristics of inflammatory DCs in varying disease conditions. Additionally, it is uncertain how these transcriptional networks affect diverse metabolic processes in DCs. An essential component of transcriptional regulatory circuits is the global co-repressor protein, the silencing mediator of retinoic acid and thyroid hormone receptor (SMRT). It is well reported to control a wide variety of metabolic activities in diverse cell types. In adipocytes, SMRT deficiency impairs glucose tolerance and insulin sensitivity, and its presence promotes OXPHOS. It maintains systemic metabolic homeostasis and therefore SMRT ablated mice suffer from hepatosteatosis. Specific deletion of the RID1 domain of SMRT causes decreased mitochondrial function manifested with premature ageing15,16,17. We recently reported that SMRT depletion in DCs generated a heightened inflammatory response with profound secretion of IL-6, IL-12p40/70, and IL-23 with a concomitant decrease in IL-1018. Here, we have investigated the metabolic control of SMRT in mediating inflammatory responses in DCs.
In this study, we identified an important immune-metabolic function of SMRT corepressor in cDC1 like DC line (DC-1940) and its association in varying autoimmune diseases like IBD (Ulcerative colitis and Crohn’s disease) and RA in humans. Specific signalling cascades and metabolic pathways in SMRT ablated DC-1940 pertaining to energy metabolism were profiled by employing functional assays, transcriptome analysis, DC-T cell co-culture studies, murine disease models and ultimately its alliance with inflammatory diseases. We investigated the mechanisms by which inflammatory pathways are upheld in spite of suppressed glycolysis in SMRT-depleted conditions. The results thus obtained revealed an optimal equilibrium between mTOR signalling and succinate transportation through enhanced glutaminolysis, crucial for sustenance of inflammation in SMRT-ablated conditions.
Results
SMRT-depleted inflammatory conventional DCs depict repressed glycolysis & increased OXPHOS upon TLR9 activation
To characterize the impact of SMRT depletion in DCs underlying inflammation, we decided to delineate the metabolic adaptations within a cDC1 like cell line, DC-1940. Lentivirus-mediated efficient transduction of empty control and Ncor2 (Smrt) gene were attained using 3 different shRNA clones targeting the CDS and 3’UTR regions. Successful ablation of Smrt was confirmed by RT-qPCR (Supplementary Fig. 1). The extracellular acidification rate (ECAR) upon glucose induction in the Smrt depleted DC-1940 demonstrated diminished reliance on glycolysis post 6 h CpG stimulation (Fig. 1A & Supplementary Fig. 1). In addition, concomitant decrease in the relative expression of crucial genes like Slc2a1, Hk2, Pkm2 and Ldha primarily in SMRT KD CpG condition with respect to Control CpG complemented the same (Fig. 1B). Furthermore, downregulation of Hk2 and Ldha in SMRT KD CpG in comparison to SMRT KD Unstimulated (Uns) provided enough evidence of stimulation dependent defunct glycolysis in these DCs. We used Single Cell EnergetIc metabolism by profiling Translation inHibition (SCENITH) for further validation. It allowed us to determine dependency (direct inhibition) and capacity (the ability of cells to utilize other metabolic pathways when a particular metabolic pathway is blocked). The MFI levels of incorporated puromycin following specific inhibitors of glycolysis (2-DG) and OXPHOS (Oligomycin) gave dependency and capacity values,19. SMRT KD DCs exhibited a substantial decrease in dependency on glucose as a primary energy source while demonstrating an elevated capacity for fatty acid and amino acid oxidation (FAAO) (Supplementary Fig. 1). Similar results with respect to flux assays and glycolytic gene expression were also obtained ex vivo in Flt3 differentiated BMDCs post 18 h CpG stimulation upon transient SMRT KD (Fig. 1C-D & Supplementary Fig. 1). Subsequent validations were also done at the protein level in DC-1940, where substantial decrease in the expression of HK2, PFK, GAPDH, PKM2, and LDHA corroborated with the reduced glycolytic levels (Fig. 1E). Furthermore, reduced glucose consumption alongside decreased lactate concentrations in the extracellular media and substantial reductions of crucial intracellular metabolites such as Glucose and Lactate within the SMRT-ablated condition aligned consistently with the former results (Fig. 1F). Additionally, we looked into our previously reported RNA-seq dataset18, and delved into the differentially expressed genes (DEGs) of the glycolytic pathway. Important genes like Pfkfb2, Aldh3b1, Tigar and Ldhc showed diminished expression upon CpG activation in SMRT KD DC line, however, genes like Hk3, Hk1 and Pfkp were upregulated than control CpG, but still down from the Uns SMRT KD condition (Fig. 1G).

A Representative line graph showing glucose induced glycolytic rate (ECAR) in control and SMRT KD cDC1 from Seahorse and bar showing quantification of the same upon normalisation with protein content, (n = 9). B Relative mRNA expression of glut transporter Slc2a1 and glycolytic genes Hk2, Pkm2 and Ldha in DC line, (n = 3-4). C. ECAR in control and SMRT KD BMDCs, normalised to protein content, (n = 9). D Relative mRNA expression of glut transporter Slc2a1 and glycolytic genes Hk2, Pkm2 and Ldha in BMDCs, (n = 5). E Representative western blots showing band intensities of HK2, PFK, GAPDH, PKM2 and LDHA in DC line, bar graphs depicting quantification of the same upon normalising with housekeeping controls β-tubulin and β-actin, (n = 3–4). F Glucose consumption and Lactate secretion quantified in the extracellular media and relative abundance of intracellular metabolites Glucose and Lactate as quantitated using GC-MS, (n = 4). G. Heatmap showing DEGs of glycolytic pathways from RNAseq data, (n = 3). H Box plots demonstrating ER stress levels (MFI) in DC line, quantified from flow cytometry, (n = 6). I Heatmap showing DEGs of Electron Transport Chain (ETC), (n = 3). J Reactome pathways enriched in SMRT KD CpG condition from DEGs, (n = 3). K Extracellular flux assay for OCR, line graph depicting sequential injections of oligomycin, CCCP and Rot/AA and bar graphs showing quantification for basal respiration and coupled ATP, (n = 6). *p ≤ 0.05, **p ≤ 0.01, ***p ≤ 0.001 and ****p ≤ 0.0001. p-value has been calculated using two tailed student’s t-tests (Paired for DC line and unpaired for BMDCs). Data shown in Fig. is combined from 3 independent experiments [A, C]. Error bars represent SEM.
Since, it was confirmed that reduced glycolysis is a characteristic feature of SMRT-depleted DCs, therefore we also estimated the Endoplasmic Reticulum (ER) stress levels since it varies inversely with glycolysis. A notable increase in ER stress levels were observed in SMRT-depleted conditions (Fig. 1H), important with respect to IL-23 secretion, and for inducing Th17 functions12. This was also evident from our previous study18. Several studies have indicated towards the formation of mitochondrial super complexes and enhanced mitochondrial bioenergetics during ER stress20, we speculated its involvement in driving the energy requirements in SMRT KD condition. To investigate the same, we checked the normalized expression of genes of Complex I to Complex V of ETC (Electron Transport Chain) and found them to be significantly elevated (Fig. 1I). Moreover, pathways pertaining to ‘Mitochondrial electron transport’ and ‘Mitochondrial protein import’ were also enriched (Fig. 1J). Furthermore, OCR rates in terms of basal respiration and coupled ATP were found to be significantly higher (Fig. 1K) and SCENITH, demonstrated increased mitochondrial dependence and reduced glycolytic capacity for SMRT-depleted DCs (Supplementary Fig. 1). Total intracellular levels of ATP were also determined, and found to be significantly elevated both at Uns and CpG activated conditions (Supplementary Fig. 1). As SMRT KD DCs are inflammatory in nature, they also demonstrated increased cellular ROS levels (Supplementary Fig. 1). Additionally, higher TMRM-mediated mitochondrial potential confirmed the data of higher OXPHOS (Supplementary Fig. 1). No significant differences were noticed in terms of Mitochondrial DNA (Mt DNA) copies (Supplementary Fig. 1). The above results provided useful insights into the involvement of other intermediary pathways regulating OXPHOS and thereby inflammatory responses.
Glycolysis is non-essential for functionality in SMRT KD DCs
Secretion of inflammatory cytokines upon antigenic insult is dependent on rapid increase in energy demands provided by glycolysis. This is also pivotal for migration and mediating effector immune functions. Inflammatory cytokines like IL-6 and IL-12p40/70 exhibited profound perturbation at the secretory levels in control DCs when subjected to glycolysis inhibitors like 2-DG and galactose in conjunction with pyruvate oxidation inhibitor UK-5099. On the other side, SMRT KD DCs demonstrated negligible variations (Fig. 2A& Supplementary Fig. 1), which dictates that glycolytic and pyruvate oxidative potential do not profoundly disconcert the inflammatory status of SMRT-depleted DCs. We also did concentration kinetics of the MPC-1 inhibitor, UK-5099. Control DCs showed significant decreasing levels of IL-12p40/70 with increasing concentration but SMRT KD DCs were having nonsignificant changes (Supplementary Fig. 1). To further validate the potential role of pyruvate oxidation, we performed an experiment to check the dependency by Seahorse. The data thus obtained demonstrated reduced dependency of SMRT KD DCs on pyruvate oxidation for their functionality (Supplementary Fig. 1). Hence, the above experiments provided crucial information on the role of pyruvate oxidation, and its independent regulation of inflammatory cytokine secretion in SMRT KD DCs.
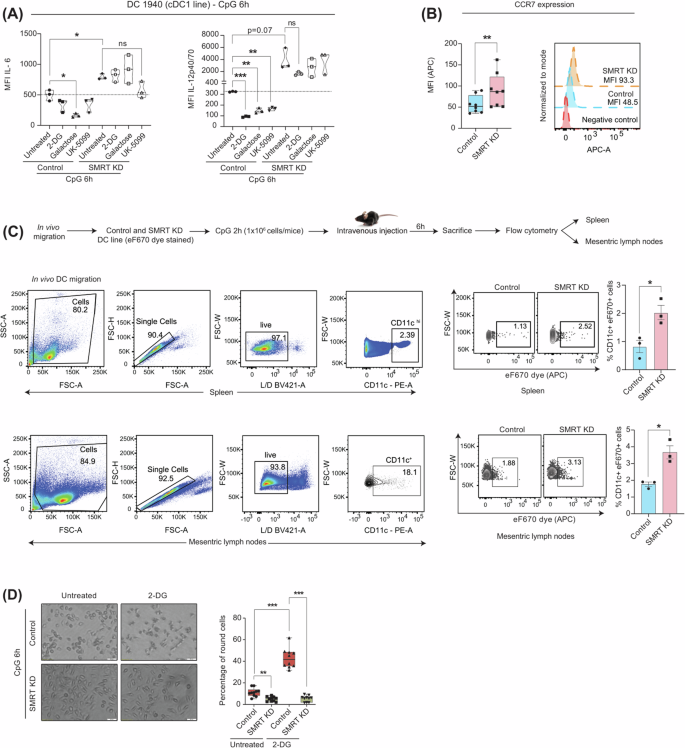
A Violin plots demonstrating the cytokine levels of IL-6 and IL-12p40/70 in control and SMRT-depleted cDC1 DCs upon 2-DG, Galactose and UK-5099 treatment, (n = 3). B Box plots and histograms showing CCR7 expression quantified from flow cytometry, (n = 8). C Schematic outline of in vivo migration assay, gating strategy and dot plots depicting the percent CD11c+eF670+ cells in MLN and spleen, bar graphs showing cumulative data points, (n = 3). D. Representative microscopic bright field images of control and SMRT KD DCs with and without 2-DG treatment, box plots depicting quantification of round cells, (n = 10). *p ≤ 0.05, **p ≤ 0.01, ***p ≤ 0.001 and ****p ≤ 0.0001. p-value has been calculated using two tailed student’s t-tests (Paired for DC line and unpaired for in vivo migration assay). Error bars represent SEM.
Glycolytic metabolism is also reported essential for DC migration and CCR7 oligomerization21. In order to corroborate the findings, we examined the CCR7 expression upon CpG challenge and found it to be significantly elevated in SMRT KD condition, despite diminished glycolysis (Fig. 2B). To analyze the impact of enhanced CCR7 levels on migration, we performed an in vivo migration assay where the presence of adoptively transferred SMRT KD DCs (CD11c+eF670dye+) in the Spleen and Mesenteric lymph nodes (MLNs) were evaluated. Increased frequencies of SMRT ablated DCs were observed than control in those areas (Fig. 2C). Additionally, we pre-incubated the control and SMRT KD DCs with glycolysis inhibitor 2-DG and stimulated them for 6 h with CpG. Morphological variations concerning cell shape were captured by microscopy and quantified. Notably, SMRT KD DCs exhibited no discernible alterations in cell shape or size even after 2-DG treatment but control DCs showed augmented rounded morphology with retraction of dendrites (Fig. 2D). Despite the well-established association between glycolysis and cellular migration, this phenomenon was not observed in inflammatory SMRT-depleted DCs, suggesting an unconventional cellular response pattern with respect to utilization of energy demands and mediating inflammatory effector functions.
Glutamine feeds the TCA cycle and succinate transport acts as a critical inflammatory signal in SMRT ablated DCs
Divergent metabolic fates of the glycolytic end product pyruvate are pivotal for differential biological functions. Pyruvate produced from glucose gets converted either into lactate or into Acetyl-CoA with the help of lactate dehydrogenase and pyruvate dehydrogenase complex (PDC), respectively. We observed a noteworthy reduction in the PDH expression at the protein level in SMRT depleted condition (Fig. 3A). Moreover, essential genes associated with PDC like Pdhb, Dlat, and Pdhx also depicted diminished expression from RNAseq data (Fig. 3B). Thus, it confirms that Acetyl-CoA generation from pyruvate might be hampered along with the lactate as noted above. Similar observations for Acetyl-CoA levels were observed in the SMRT-depleted condition (Fig. 3C). Immunogenic DCs are also reported to have increased de novo fatty acid synthesis through citrate and decreased β-oxidation5. To check the same, we first looked into the relative mRNA expression of Acc1and Fasn (important for the conversion of acetyl-CoA to malonyl-CoA and malonyl-CoA to free fatty acids respectively) along with Cpt1a. All of them demonstrated diminished expression in the SMRT KD condition (Fig. 3D). Thereafter, we used a specific inhibitor of Acc1, called TOFA, and for β-oxidation, etomoxir to check the levels of the inflammatory cytokine IL-12p40/70. In SMRT KD DCs, non-significant changes were attained (Supplementary Fig. 2). Thus, pyruvate-generating Acetyl-CoA and β-oxidation pathways were insignificant in the context of SMRT-depleted inflammation in the DC line. Additionally, reduced de novo FAS hinted towards a truncated TCA cycle22. The log2 FC of TCA cycle genes depicted 2 distinct clusters, one having reduced expression of isocitrate dehydrogenase isoforms, whereas other depicting enhanced expression of Sdha, Sdhc, Mdh1 and Mdh2 (Fig. 3E). This led us to investigate an important anaplerotic TCA cycle pathway called Glutaminolysis. Metabolic profiling demonstrated elevated levels of glutamate, α-ketoglutarate, succinate, fumarate and malate in SMRT KD compared to the control DC line (Fig. 3F). This coincided well with the transcriptomic data. Next, we checked the normalized expression of the glutamine transporter Slc1a5, and found a profound expression, along with more glutamine uptake from the extracellular media suggesting more glutamine consumption in SMRT KD DCs (Fig. 3G). To validate the same, we utilized a glutamine analogue, DON, and checked the OCR changes in the control and SMRT-depleted DC line. SMRT-depleted DCs showed significant decrease in basal respiration and coupled ATP upon treatment, whereas control cells showed little or no perturbation (Fig. 3H and Supplementary Fig. 2). This demonstrated enhanced glutamine-mediated mitochondrial respiration in SMRT KD DCs. Moreover, the levels of inflammatory cytokines like IL-6 and IL-12p40/70 also showed diminished levels upon DON treatment, indicating a pivotal role of all the glutamine-utilizing enzymes, leading to inflammation in SMRT KD DCs (Supplementary Fig. 2). Although DON treatment decreased the inflammatory cytokine levels, the percent inhibition was not stronger. The gene responsible for the conversion of glutamine to glutamate, Gls1, also depicted increased expression, substantiated by the SMRT ChIPseq data, which revealed direct binding of SMRT to the Gls gene body at CpG 6 h in control DCs, implying direct regulation of Gls expression by SMRT (Fig. 3I). Further, we strengthened our glutaminolysis data by evaluating the IL-12p40/70 secretory level upon using a specific Gls1 inhibitor, CB-839. We took one low and one high concentration of the drug and found concentration-dependent changes of IL-12p40/70 levels in SMRT KD DCs (Fig. 3J and Supplementary Fig. 2). The same was not observed for Control DCs. Upon calculating the % dependency for the secretion of IL-12p40/70 upon CB-839, we found significant changes between 1μM and 20μM concentrations of CB-839 treatment for SMRT KD DCs, whereas, absent for Control ones. These results strongly indicated the dependency of SMRT KD DCs on glutaminolysis. To investigate further, we looked into a very important metabolic signal downstream of α-KGA in inflammation i.e. Succinate. We utilized a succinate transport inhibitor called diethyl butyl malonate (DEBM) to confirm its role. Upon inhibition, the OCR for basal respiration and coupled ATP diminished for SMRT KD DCs, whereas control cells showed minimal changes (Fig. 3K). This was further confirmed independently using SCENITH (Fig. 3L). Furthermore, SMRT ChIPseq data in control DCs showed direct binding peaks at the Sdha genomic regions, confirming its role in succinate-induced metabolism (Fig. 3M). Next, upon determining the levels of IL-6 and IL-12p40/70. IL-6 showed non-significant changes, but IL-12p40/70 levels were significantly affected upon DEBM treatment (Fig. 3Nand Supplementary Fig. 2), depicting an intricate role of succinate accumulation in regulating inflammation. To provide more evidence on the critical role of succinate oxidation in maintaining inflammation in SMRT KD DCs we utilized SDH (Succinate Dehydrogenase) inhibitor Dimethyl Malonate (DM) and a permeable form of succinate, Diethyl Succinate. The levels of the inflammatory cytokine IL-12p40/70 were determined and compared with DEBM. The data showed downregulation of the IL-12 levels both in control and SMRT KD DCs, suggesting a pivotal role of Succinate in mediating inflammatory responses in DCs as such (Supplementary Fig. 2). This happened maybe because of partially defunct SDH activity. Overall, the SMRT ablated condition demonstrated decreased glycolysis, PDH expression, FAS, and β-oxidation with concurrently increased levels of glutaminolysis and succinate oxidation (Fig. 3O), indicating towards a strong metabolic adjustment shown by the truncated TCA cycle for maintaining inflammation rather than glycolysis and FAS.
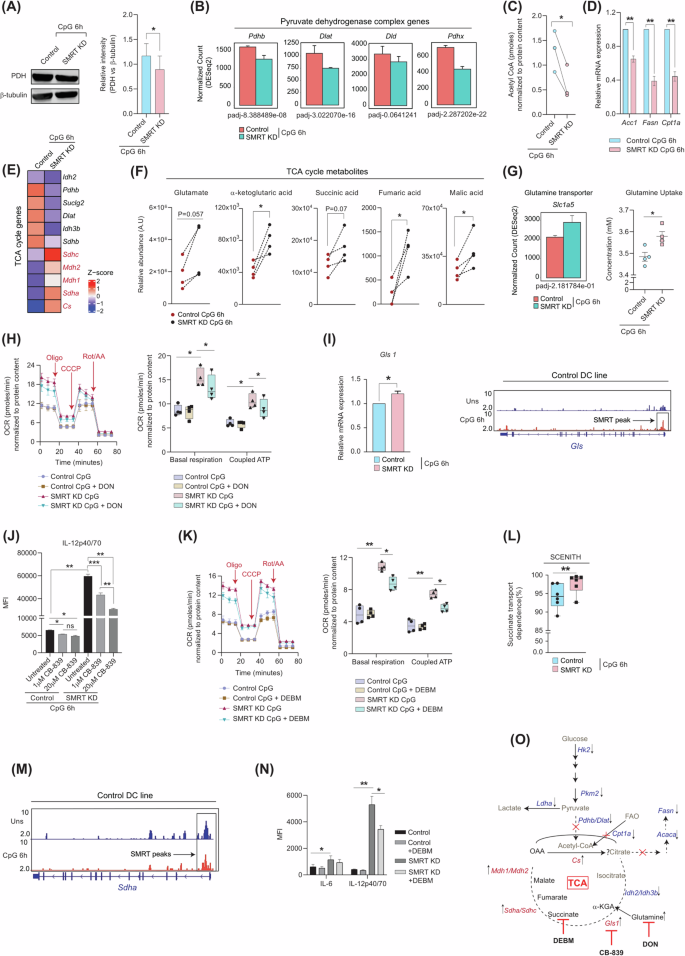
A Western blot depicting PDH expression at CpG 6 h, relative intensities were normalised to housekeeping control β-tubulin, (n = 3). B Normalised expression of Pyruvate dehydrogenase complex genes, Pdhb, Dlat, Dld and Pdhx, (n = 3). C Acetyl CoA levels in Control and SMRT KD DC line at CpG 6 h, (n = 3). D Relative mRNA expression of FAS genes Acc1 and Fasn, and β-oxidation rate-limiting gene Cpt1a, (n = 4). E DEGs of the TCA cycle pathway, (n = 3). F Relative levels of TCA cycle intracellular metabolites Glutamate, α-ketoglutarate, Succinate, Fumarate and Malate quantified from GC-MS (n = 4). G Normalised expression of glutamine transporter Slc1a5 and glutamine uptake from extracellular media in DC line (n = 3–4). H Extracellular flux assay for OCR with and without glutamine analogue DON, and box plots showing quantification for basal respiration and coupled ATP, (n = 4). I Bar graph depicting relative mRNA expression of Gls1 (n = 5) and IGV snapshot of SMRT binding peak at Gls genomic region, from SMRT ChIPseq data in control DC line. J. Bar graphs showing MFI levels of IL12p40/70 with and without Gls1 inhibitor CB-839 treatment in control and SMRT KD DCs, (n = 3). K Extracellular flux assay for OCR with and without succinate transport inhibitor DEBM, box plots showing quantification for basal respiration and coupled ATP, (n = 4). L. Translation MFI upon puromycin treatment for Succinate transport dependence upon treatment with DEBM & 2DGO. Dependency calculations were done as follows: Dependence (%) = MFI values (Untreated-DEBM)/Untreated-2DGO*100, (n = 5). M IGV snapshot of SMRT binding peak at Sdha genomic region, from SMRT ChIPseq data in control DCs. N Flow cytometry of IL-6 and IL12p40/70 with and without DEBM treatment in control and SMRT KD DCs, (n = 5). O Schematic displaying the metabolic readjustments of SMRT ablated inflammatory DCs upon 6 h of CpG stimulation. *p ≤ 0.05, **p ≤ 0.01, ***p ≤ 0.001 and ****p ≤ 0.0001. p-value has been calculated using two tailed students’s paired and unpaired t-tests. Error bars represent SEM.
mTOR induction promotes glycolysis but limits secretion of inflammatory cytokines
It is well reported that mTOR signalling in DCs regulates glycolysis and mitochondrial metabolism, which either directly or indirectly modulates the secretion of cytokines responsible for immune functions7,23. The role of mTOR as such in immune regulation is controversial24. Given that SMRT-depleted DCs showed reduced glycolysis, we hypothesized that mTOR may be involved in this process. In the SMRT KD condition, we found that the p-mTOR expression was severely compromised at the protein level, including its substrates p-S6K and p-4EBP1 (Fig. 4A and Supplementary Fig. 2). This provided insight into the direct correlation between glycolysis and mTOR23. Next, we induced the mTOR levels with a specific synthetic inducer, Mhy1485. At 5 μM concentration, significant restoration of p-mTOR and p-S6K levels were achieved (Fig. 4A and Supplementary Fig. 2). No differences in cell viability between any of the conditions were seen (Supplementary Fig. 2). Moreover, glycolytic molecules like Hk2 and Pkm2 demonstrated substantially elevated expressions at both mRNA and protein levels upon Mhy1485 treatment with respect to untreated SMRT KD condition (Fig. 4B & C). The inflammatory molecules IL-6 and IL-12 showed significant perturbation both at mRNA and protein levels upon treatment with Mhy1485 (Fig. 4D-E & Supplementary Fig. 2), which supported their regulation through mTOR. Although the level of glycolysis was restored, the results depicted an inverse relationship between mTOR and the release of inflammatory cytokines, in sync to already published reports25. Next, we employed mTOR inhibitor rapamycin to confirm the same. The data obtained depicted significant increased levels of the inflammatory cytokine IL12p40/70 in SMRT KD DCs upon inhibition, whereas control DCs demonstrated non-significant changes (Fig. 4F). This data showed decreased levels of mTOR is indeed important for maintaining inflammation in SMRT KD DCs. Additionally, we checked the proliferation of naïve CD4+ T-cells upon co-culture with SMRT KD DCs with and without Mhy1485 treatment. The MFI levels of SMRT KD co-cultured T-cells showed enhanced retention of the eF670 dye and depicted decreased proliferation, asserting the reduced inflammatory cytokine levels (Fig. 4G& Supplementary Fig. 2). Overall, mTOR induction proved to be important for inflammatory cytokine secretion in SMRT depleted DCs.
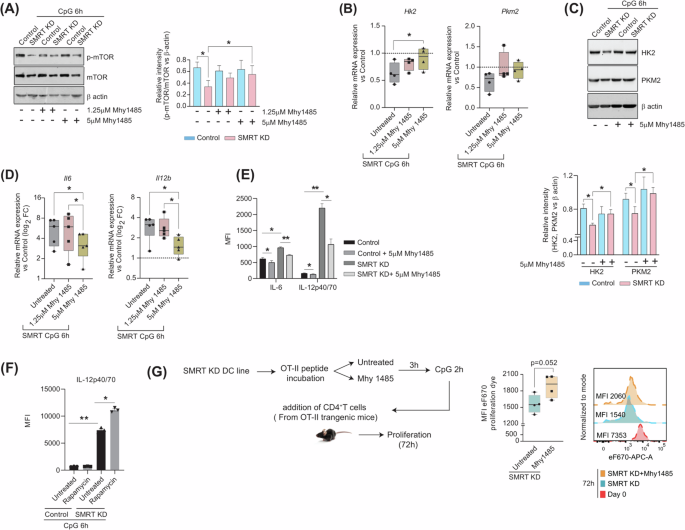
A Representative western blots showing the phosphorylated and total levels of mTOR with and without mTOR inducer Mhy1485. The relative intensity for densitometry analysis was normalized to the housekeeping control β-actin, (n = 4). B Relative mRNA expression of glycolytic genes Hk2 and Pkm2 with and without Mhy1485 (1.25 and 5 μM) treatment, values normalized to control, (n = 4). C Western blots depicting the protein level expression of HK2 and PKM2 with and without mTOR inducer Mhy1485, bar graphs showing relative intensity normalized to housekeeping control β-actin, (n = 5). D Log2 FC expression of inflammatory genes Il6 and Il12b with and without Mhy1485 (1.25 and 5 μM) treatments, values normalized to control, (n = 5). E Bar plots showing the MFI levels of IL-6 and IL-12p40/70 with and without mTOR inducer Mhy1485, quantified from flow cytometry, (n = 3). F Bar plots showing the MFI levels of IL-12p40/70 with and without mTOR inhibitor Rapamycin, quantified from flow cytometry, (n = 3). G Box plots showing MFI intensity of eF670 dye in CD4+T cells upon co-culture with SMRT KD DCs with and without mTOR inducer Mhy1485, histograms showing representative shifts, (n = 4). *p ≤ 0.05, **p ≤ 0.01, ***p ≤ 0.001 and ****p ≤ 0.0001. p-value has been calculated using two tailed student’s paired (DC line) and unpaired t-tests (co-culture assay). Error bars represent SEM.
Combined mTOR induction and succinate transport inhibition skews the global transcriptomic landscape and T-cell polarization
Since, it is commendable that SMRT KD DCs relies on mTOR and Succinate oxidation independently to derive their inflammatory potential, but neither Mhy1485 nor DEBM alone is able to suffice the release of inflammatory cytokines completely. Thus, decided to choose the combination of these 2 drugs for our further experiments. The cell viability upon dual modulator treatment was found to be intact (Supplementary Fig. 3). A specific activation marker, CD80, revealed markedly lower MFI levels in SMRT KD, although CD86 and MHC II demonstrated a similar response to modulator treatment across control and SMRT KD DCs (Fig. 5A). Furthermore, combined treatment significantly reduced the relative mRNA expression of Il6 and Il12b in SMRT KD condition (Supplementary Fig. 3). Similar significant perturbation was also reflected in the expression of IL-6 and IL-12p40/70 in protein levels (Fig. 5B & Supplementary Fig. 3). Moreover, the percent dependency for secretion of IL-12p40/70 upon dual modulator treatment for SMRT KD DCs were more enhanced than individual modulator treatments. Comparable outcomes were also drawn from the ex vivo experiment in terms of IL-6 secretion in Flt3 differentiated BMDCs (F4/80–CD11c+MHCII+CD24+) (Fig. 5C & Supplementary Fig. 3). Provided, BMDCs are more efficient at producing biologically active IL-12p70. The dual Mhy1485+DEBM treatment varied greatly between DC-1940 and BMDCs in terms of IL-12p40/70 secretion. And also, probably due to stress being induced by viral particles, metabolic modulator treatments, prolonged stimulations etc.
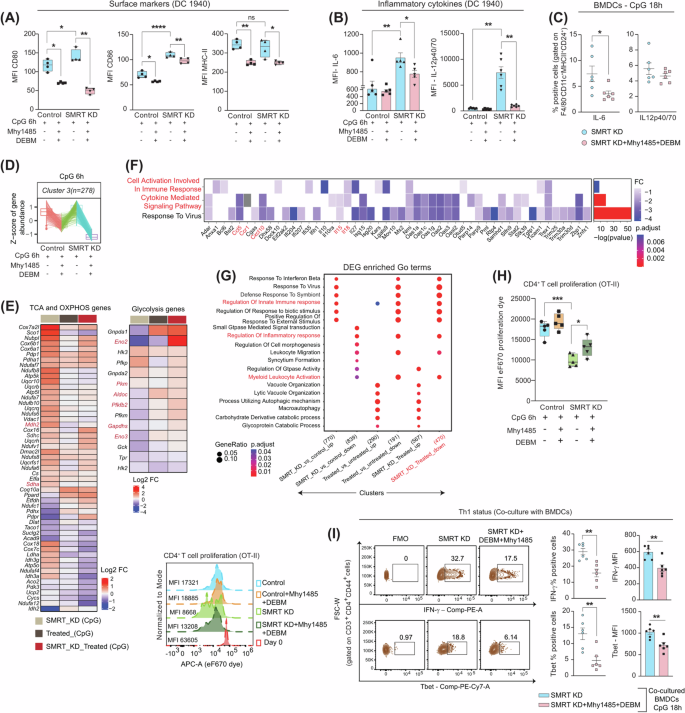
A Box plots displaying MFI levels of CD80, CD86 and MHC II with dual modulator treatment in control and SMRT KD cDC1 DCs, (n = 4). B Bar graphs showing MFI levels of inflammatory cytokines IL-6 and IL12p40/70 upon combined treatment, (n = 5–6). C Scatter plots depicting the percent of IL-6 and IL-12p40/70 in BMDCs (F4/80–CD11c+MHCII+CD24+) upon dual modulator treatment, (n = 6). D Box plots showing the z-score means for gene abundance from RNAseq data, (n = 3). E Heatmap demonstrating DEGs of TCA cycle, OXPHOS and glycolytic pathway genes before and after Mhy1485+DEBM treatment in SMRT KD DCs, (n = 3). F DEGs enriched GO terms for Inflammatory response genes, the asterisk in the heatmap denoting the significantly up or down-regulated genes (p-adjusted <0.05) from DESeq2 results, (n = 3). G Clusters showing pathways enriched for inflammatory response genes in different experimental conditions, (n = 3). H T cell proliferation index showing MFI values of co-cultured CD4+T cells from OT-II transgenic mice, histograms demonstrating representative MFI shifts under specific conditions, (n = 5). I Representative contours demonstrating IFN-γ and Tbet positive cells in SMRT KD with and without dual modulator treatment, scatter plots and bar graphs showing cumulative percentages and MFI values respectively for the same in CD4+ effector T cells co-cultured with BMDCs, (n = 6). *p ≤ 0.05, **p ≤ 0.01, ***p ≤ 0.001 and ****p ≤ 0.0001. p-value has been calculated using two-tailed student’s t-tests (Paired for DC line and unpaired for BMDCs & co-culture assay). Data shown in figure is combined from 3 independent experiments [C, H, I]. Error bars represent SEM.
To gain insight into the global transcriptomic landscape upon dual perturbation, we utilized four different setups for the analysis i.e., Control CpG, SMRT KD CpG, Control CpG+Mhy1485+DEBM, and SMRT KD CpG+Mhy1485+DEBM. The PCA of the samples showed distinct clusters where independent biological replicates clustered together (Supplementary Fig. 3). All the differentially expressed genes grouped into 9 different clusters, out of which cluster 3 depicted z-score means for inflammatory genes near -1 upon dual treatment (Fig. 5D& Supplementary Fig. 3). At the onset, to confirm the working of Mhy1485 and DEBM on the expression of glycolytic, TCA cycle and OXPHOS genes, we plotted the normalized expression of these pathways and found them to behave differently with and without combined modulator treatment. Important glycolytic genes like Pkm, Pfkfb2, Gapdhs, and Eno3 which were downregulated in SMRT KD CpG condition, got restored, and the TCA cycle and OXPHOS genes which were upregulated, got diminished (Fig. 5E). Additionally, the significantly enriched inflammatory response genes from GO terms like Ccl5, Ccr1, Cxcl10, Il5 and Il18 were downregulated along with pathways pertaining to ‘cell activation involved in immune response’ and ‘cytokine-mediated signalling pathway’(Fig. 5F). Furthermore, GO terms involved in the regulation of ‘innate immune response’ and ‘positive regulation to external stimulus’ were upregulated in SMRT KD, however, these pathways showed downregulation after treatment (Fig. 5G). Throughout the experiment, the features of the inflammatory SMRT KD DCs were maintained (Supplementary Fig. 3). Next, at the functional level, we investigated the CD4+T cell proliferation and the profiling status in these conditions. Untreated SMRT KD DCs (co-cultured with naive T-cells) showed reduced MFI levels of eF670 dye intensity, denoting enhanced proliferation, but with dual treatment, the proliferative potential was perturbed with increased retention of eF670 dye (Fig. 5H). Similarly, the Th1 responses in terms of IFN-γ and Tbet (gated on CD3+CD4+CD44+ T cells) expression were significantly decreased when CD4+T cells were co-cultured with Flt3 differentiated BMDCs upon transient SMRT KD (Fig. 5I and Supplementary Fig. 3).
Adoptive transfer of Mhy1485 + DEBM treated SMRT KD DCs lowers Th1 responses & immune cell infiltration in DSS-induced colitis disease
To validate the reduced inflammatory status of SMRT KD DCs at the physiological level with Mhy1485+DEBM treatment and its importance in ameliorating disease pathogenesis, we generated a DSS-induced inflammatory colitis model. Four treatment groups were made namely, Untreated, DSS, SMRT KD DCs and SMRT KD DCs with combined treatment. The schematic experimental plan considered for pivotal observations is depicted in Fig. 6A. Those mice which received SMRT KD DCs along with combined Mhy1485 and DEBM showed less disease severity (Fig. 6B), but without any significant changes in the body weight compared to other groups (Fig. 6C). Furthermore, on the day of sacrifice, colon lengths were measured. Mice that received only SMRT KD DCs depicted significantly reduced colon length, robust epithelial gut-barrier breakage as evident from elevated levels of FITC-dextran in the serum and increased splenomegaly in comparison to the SMRT KD DC treated group (Fig. 6D-F). This is because the inflammatory condition was exacerbated by elevated levels of IL-12p40/70 and IL-6 cytokines. On the other hand, Mhy1485+DEBM showed a lower inflammatory status, which supports the reduced levels of inflammatory cytokines being secreted under the influence. The representative H/E staining of the colon showed more infiltration of cells in those mice, which received adoptively transferred SMRT KD DCs, however, the phenotype of the treated ones differed drastically (Fig. 6G). Additionally, we profiled the MLN to check the Th1 responses, and found the levels of IFN-γ and transcription factor Tbet to be significantly decreased in the treated condition and thus effectively mitigated the heightened disease state and the overwhelming inflammation with respect to only SMRT KD DC group (Fig. 6H).
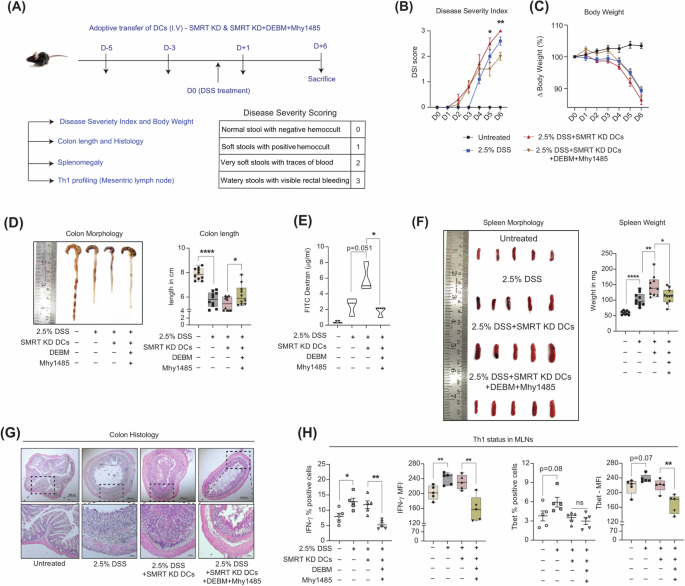
A. Schematic depicting the in vivo intravenous injection strategy of DCs (D-5, D-3, and D + 1), DSS treatment (D0), day of sacrifice (D6) and table showing scoring patterns for disease severity. B Line graph showing the change in disease severity index from the day of DSS induction in different experimental mice groups, (n = 10). C. Line graph demonstrating the change in body weights from the day of DSS induction in different experimental mice groups, (n = 10). D Representative image showing colon lengths and box plots demonstrating quantification of the same in DSS-induced colitis in different experimental setups, (n = 10 mice). E Violin plots exhibiting the availability of FITC-dextran in blood serum, an indication of epithelial damage during DSS treatment, (n = 3 mice). F Representative image and box plots showing spleen weights in mg, (n = 10 mice). G. Representative colon H/E sections showing infiltration of cells at 5x and 20x magnification under varying treatment conditions. H. Scatter plots and bar graphs depict cumulative percent positive and MFI levels of IFN-γ and Tbet, respectively in CD4+effector T cells isolated from MLNs, (n = 5 mice). *p ≤ 0.05, **p ≤ 0.01, ***p ≤ 0.001 and ****p ≤ 0.0001. p-value has been calculated using two tailed student’s t-tests (Unpaired for DSS colitis). Error bars represent SEM.
SMRT levels negatively associate with varying human inflammatory disorders (Crohn’s, Ulcerative Colitis & Rheumatoid Arthritis)
Since, SMRT depletion leads to enhanced immunogenic responses in cDC1 consequently leading to increased Th1 mediated inflammation ex vivo and in vivo without depending on glycolysis18, we aimed to see, if SMRT levels also correlate with varying degrees of inflammation in humans or not ? We examined the relationship between inflammation and SMRT expression particularly in autoimmune diseases like Crohn’s, Ulcerative Colitis and Rheumatoid Arthritis. First, we looked into a publicly available RNAseq dataset of Crohn’s disease (CD), where global transcriptome of ileal biopsy sections were analysed from 36 CD samples and 32 matched controls26. We categorically checked SMRT and the inflammatory cytokine, IL-1β levels. They were found to behave contrastingly in the CD samples (Fig. 7A). Further examination of the glycolytic transcripts (GAPDH, PKM & LDHA) in the CD samples revealed a striking reduction in their expression. In the same way, elevated levels of glutamine transporter SLC2A1 were also noted in the CD patients similar to the one found in the SMRT depleted DC line. Most probably dysregulated glycolysis and dependence on glutamine import is an important adaptation for perpetuation of inflammation in these conditions. Further, to investigate what’s happening in the Ulcerative Colitis (UC) scenario, we collected rectal punch tissue samples of 3 irritable bowel syndrome (IBS) controls and 5 UC cases. The average Activity Uceis score for the UC individuals were 5.4/8 (Supplementary Table 1). The representative colonoscopy images showed clear signs of inflammation in UC with more infiltration of cells and loss of crypt architecture (Fig. 7B). Immunofluorescence staining for SMRT was performed to assess the protein levels along with nuclei stain DAPI. Reduced expression of SMRT was observed in the crypt’s region of the UC samples as compared to IBS controls (Fig. 7B). With increased inflammation and disease severity both for CD and UC, SMRT expression found to be drastically depleted. Similarly, glycolytic proteins like GAPDH and PKM2 demonstrated reduced expression in the crypt’s regions for the UC samples with respect to IBS controls (Fig. 7C). Additionally, to broaden the association of SMRT expression change in a different category of inflammatory disease, we looked into cases of Rheumatoid Arthritis (RA). For the analysis, 11 healthy controls (HC) and 16 RA peripheral blood samples were collected from the orthopaedic department. The mean DAS score for the RA samples used for the analysis were 6.8 ± 1.6 along with other important clinical parameters like ESR and CRP (Supplementary Table 1). Elevated intracellular TBET expression in CD3+CD4+ T cells in PBMCs of RA patients as compared to HCs confirmed the heightened inflammation in the diseased state (Fig. 7D). Following which, SMRT expression was assessed in the gated cDC1 (CD11c+HLADR+CD141+ DCs) from PBMCs (Fig. 7D). The cDC1 DCs from RA samples depicted significantly lower expression of SMRT and demonstrated a strong negative correlation with TBET (Fig. 7E). This data depicted DC-mediated inflammatory response in RA, where SMRT levels were found to be inversely correlated with the inflamed disease condition. Overall, all of the inflammatory diseases showed a negative association with SMRT and hinted towards its involvement for maintenance of inflammation in patients.
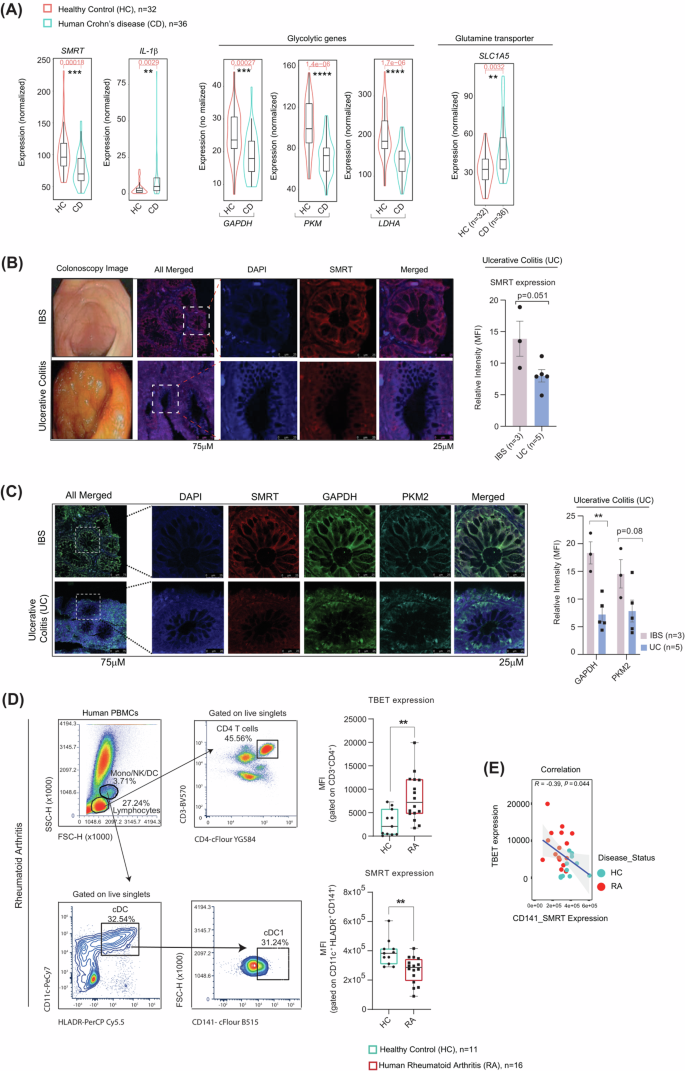
A Box plots within Violin showing the normalized expression of SMRT and IL-1β, glycolytic genes—GAPDH, PKM and LDHA, and glutamine transporter SLC1A5 (median levels and distribution) from ileal RNA-seq datasets, healthy (n = 32) and Crohn’s disease (n = 36) samples. B Representative Colonoscopy images of IBS and UC samples. Immunofluorescence microscopy images showing relative intensities of SMRT in IBS (n = 3) vs UC (n = 5). C Immunofluorescence microscopy images showing relative intensities of SMRT, and glycolytic proteins – GAPDH and PKM2 in IBS (n = 3) vs UC (n = 5). D Dot plots demonstrating the gating strategy to identify CD3+CD4+ T cells and cDC1 DCs (CD11c+HLADR+CD141+) from PBMCs. Box plots depicting the MFI levels of TBET and SMRT in Healthy (n = 11) vs RA (n = 16). E Scatter plot demonstrating the negative correlation between SMRT and TBET in Healthy (n = 11) vs RA (n = 16). *p ≤ 0.05, **p ≤ 0.01, ***p ≤ 0.001 and ****p ≤ 0.0001. p-value has been calculated using two tailed student’s unpaired t-tests. Error bars represent SEM.
Discussion
Inflammation is strongly driven by glycolysis in immune cells27,28,29,30. This occurs to meet the rapid demands of energy for the maintenance of cellular activities, achieved through metabolic readjustments31,32. DCs depleted of SMRT showed inflammatory phenotype and concurrently developed Th1 and Th17 responses when co-cultured with naive CD4+ T-cells ex-vivo18. Despite being immunogenic in nature, they demonstrated reduced glycolysis and FAS. Several reports have appreciated the role of extracellular fatty acids in regulating Th17 functions in DCs. These DCs categorically depict a lack of glycolytic potential even with higher inflammatory responses upon antigenic insult13. Since SMRT-depleted DCs showed both Th1 and Th17 priming ability, probably because of that the glycolytic capacity got compromised and thereby metabolic adjustments shown by them varied drastically. The reduced expression of p-mTOR in SMRT KD further substantiated this observation. mTOR directly regulates the expression of key rate-limiting genes of glycolysis through HIF-1α33. Additionally, the mTOR/STAT3 axis also maintains the balance between tolerance and inflammation in DCs18. Induction of mTOR by Mhy1485 restored p-mTOR levels and the expression of essential glycolytic proteins, but the levels of inflammatory cytokines like IL-6 and IL-12p40/p70 got compromised. This is in line with other reports where rapamycin treatment in cells increased inflammatory cytokine secretion23. Secondly, inflammatory DCs are also known to upregulate de novo fatty acid synthesis for effective cytokine secretion5. For SMRT KD DCs, both FAS and FAO pathways were found to be downregulated. They derived their energy from oxidative phosphorylation. Apart from the generation of reducing powers for OXPHOS from the truncated TCA cycle, inflammatory status was also potentiated through effective glutaminolysis and succinate oxidation. Accumulation of succinate is widely known in macrophages where stimulation-dependent immunometabolic reprogramming and glutamine anaplerosis facilitate the truncated TCA cycle34. More recently, it has been shown that succinate oxidation by succinate dehydrogenase (SDH) is pivotal for proinflammatory functions, and treatment with its inhibitor, dimethyl malonate (DM), impedes inflammation. However, with a succinate transport inhibitor, DEBM, results were in contrast to the ones obtained with DM. Although, in both cases, succinate accumulation was achieved35. More specifically in DCs, succinate activates intracellular calcium flux, thereby regulating pro-inflammatory cytokine secretion and migratory responses36. It also facilitates the capacity of DCs to present antigens to T-cells to induce adaptive immune responses. Specific inhibition of succinate transport by DEBM perturbed the IL12p40/70 levels robustly. Whereas mTOR induction and succinate transport inhibition in sync severely impaired the inflammatory response genes globally. Functionally, T-cell responses were dampened. From a physiological point of view, Crohn’s disease and UC, two forms of IBD, share similarities with DSS-induced colitis in terms of inflammation in the gastrointestinal tract37. SMRT dynamics and reduced expression in these human diseases yielded similar phenotypes & provided valuable clues about its relevance in clinical settings. Surprisingly we see an increased SMRT expression in the stromal region for UC, which needs further investigations. This interesting observation provided an important insight into the differential gene expression patterns at these two distinct histological regions. This is also evident from other studies where stromal PFKFB3 promotes intestinal inflammation in which fibroblasts are major players apart from immune cells38. In addition, investigating how SMRT influences DC behaviour in RA may provide novel insights into the mechanisms underlying autoimmune diseases and help design more targeted therapies.
In conclusion, our research unveils the remarkable influence of SMRT depletion in DC metabolism and inflammatory disease pathology. It is intriguing to observe that these cells can maintain their inflammatory characteristics even in the absence of glycolysis, a pathway which is widely reported and traditionally associated with rapid energy production. This study holds profound implications for understanding inflammatory diseases and potentially opens new avenues for therapeutic interventions. By demonstrating how SMRT-depleted DCs adapt and sustain their inflammatory behaviour through alternative metabolic pathways, we provided valuable insights into the complex mechanisms at play. This newfound knowledge could pave the way for potential innovative treatments that target the metabolic underpinnings of inflammatory diseases.
Methods
Mice
Wildtype C57BL/6, OT-II transgenic and FLT3 mice were bred and maintained at the ILS Animal house facility with 12 h of alternate light/dark cycles. They were fed ad libitum. Mice of 6-8 weeks of age were considered for experiments, irrespective of sex. OT-II transgenic mice (gifted by Prof. Hans Acha-Orbea) were used for the DC-T cell co-culture experiments, whereas FLT3 transgenic mice (gifted by Ton Rolink) serum were used as a supplement for differentiation of bone marrow cells towards DCs. Experiments performed on mice were in accordance with relevant guidelines and regulations. The ILS institutional committee approved the concerned experiments.
CD8α+ cDC1 Dendritic Cell culture & stable SMRT gene knockdown
CD8α+ DC line (DC1940) were cultured in IMDM-glutamax media supplemented with 10% FBS, 1% of penstrep, sodium bicarbonate and HEPES buffer and 0.1% of β-mercaptoethanol, maintained at 37 °C with 5% CO2 in a humidified incubator39. Cells were passaged upon reaching 70% confluency and at regular intervals characteristics of typical splenic CD8α+ DCs were matched from reported literature40. To generate stable empty control and SMRT KD in cDC1 DCs, three different shRNAs were utilised targeting the 3’UTR and CDS (Complementary Determining Sequence) regions, under the PLKO.1 vector backbone. The lentiviral-mediated transduced cells were selected by puromycin and mean KD levels were checked by RT-qPCR using Ncor2 and β-actin mouse primer pairs. Sequences are provided in Supplementary Table 4. All the DC line experiments were conducted with 6 h of TLR-9-specific CpG stimulation.
BMDC culture and transient transduction
6-8 weeks of age mice were sacrificed humanely by CO2 exposure. Tibia and Femur were flushed with complete RPMI-1640 media (10% FBS + 1% penstrep) to collect bone marrow cells. Single-cell suspensions were prepared, RBC lysed and seeded in 6 well plates with Flt3 sera (from Flt3 transgenic mice) supplementation. Loosely adherent cells were collected on day 6 and transduced with Empty and Ncor2-specific lentiviral particles. Following 72 h, cells were considered for experiments, RT-qPCR, extracellular flux assays, cytokine status and co-culture studies. All the primary cell experiments were conducted with 18 h of TLR-9-specific CpG stimulation for potent activation.
Metabolic modulator treatments
DC lines were processed with inhibitor treatments with 1 h pre-incubation of 2DG (10 mM), UK-5099 (1.25–10 μM), Rapamycin (20 nM), DON (10 μM), TOFA (5 μM), Etomoxir (6.25–50 μM), CB-839 (1μM and 20μM) and 3 h pre-incubation of Galactose (10 mM), Mhy1485 (1.25–5 μM), DEBM (1 mM), DM (10 mM) and Diethyl Succinate (5 mM) followed by CpG stimulation and BFA treatment for 4 h for flow cytometry. Combined metabolic modulator studies with DEBM + Mhy1485 both for DC line and BMDCs were performed in a similar manner except for CpG stimulation (6h-DC line & 18h-BMDCs). Thereafter cells were harvested and processed for experiments. All the reagents were bought from trusted manufacturers. Details are provided in Supplementary Table 4.
Flow Cytometry
Surface (L/D-ZombieUV, L/D-BV421 fixable dye, CCR7-APC, CD11c-PE, CD3-FITC, CD4-APC-Cy7, CD44-AF700, CD80-PE, CD86-APC, MHC-II-AF700, F4/80-FITC, CD11c-eF450, CD24-PeCy7, CD11b-APC-Cy7, MHC-II-PerCp-eFlour710, CD45-BUV496, and IC staining (IL-6-PE, IL12p40/70-APC, IFNγ-PE, Tbet-PeCy7) were done sequentially for experiments as followed earlier39. Cellular ROS (Abcam, according to manufacturer’s recommendations) and TMRM (Thermo Fisher Scientific, 20 nM), staining were done in the culture medium for 20 mins at 37 °C in a 5% CO2 incubator and proceeded for flow cytometry after washing with 1x FACS buffer. ER stress (Invitrogen) staining was performed according to the manufacturer’s recommendations. Briefly, Cultured DCs were washed with HBSS solution and stained with pre-warmed 1 μM of ER-Red dye for 30 mins at 37 C. After incubation, the staining solution was removed and staining was confirmed by fluorescence microscopy. After confirmation, cells were fixed with formaldehyde and quantified by flow cytometry. The primary antibody incubation for mTOR and its substrates (p-S6K and p-4EBP1), were followed with a fluorescence-conjugated secondary antibody F(ab’) 2-Goat anti-Rabbit IgG (H + L) Cross-Adsorbed AF647. FACS acquisition was done using LSRII fortessa-SORP (BD Biosciences) and Cytek Aurora. The acquired data were analyzed using FlowJo-X software. Reagent details are provided in Supplementary Table 4.
Blood sampling for Rheumatoid Arthritis (RA)
Under the supervision of Rheumatologist, 16 patients diagnosed with RA participated in the study, and they were followed at the Rheumatology Outpatient Department (OPD) of Pradyumna Bal Memorial Hospital, Bhubaneswar, India. All patients met the 2010 ACR/EULAR classification criteria while 11 healthy donors who volunteered to participate had no symptoms of RA. For each patient, comprehensive clinical indices were collected, including disease duration, levels of CRP (C-reactive protein), RF (Rheumatoid factor), anti-CCP (Anti-cyclic-citrullinated peptide) antibodies, and ESR (Erythrocyte Sedimentation Rate) and DAS (Disease Activity Score) (Supplementary Table 1). Informed Consent was obtained from all the participants prior to their involvement in the study and the study was ethically approved by the Institute and Hospital Research Ethics Committee (KIMS/KIIT/IEC/56/2022).
SMRT expression in Healthy donors and RA
500 μL of peripheral blood from RA patients and healthy donors were drawn and collected carefully in vacutainers. The blood samples were immediately lysed by RBC lysis buffer and the residual white WBC pellet was washed with 100 µl of 1xPBS and continued for L/D staining with Via dye red (Cytek) for 20 mins at RT. Subsequently, cells were stained for surface markers for 30 minutes in dark at 4 °C with the antibodies, anti-CD3-BV570 (BioLegend), anti-CD4-cFluor YG584 (Cytek), CD11c PECy7 (TONBO), CD 141 cFluor B515 (Cytek), HLADR PerCP Cy5.5 (TONBO), CD19 cFluor R685 (Cytek) followed by fixation with BD Cytofix (BD Biosciences) for 20 minutes at 4 °C. Intracellular Cytokine (IC) staining was performed by washing the cells with BD Cytoperm (BD Biosciences) and incubating them for 6 mins, followed by an additional 3 mins in Cytoperm at RT. Subsequently, a blocking step was carried out in the dark at 4 °C using a mixture of 5% goat serum and 3% BSA for 1 h. Next, the cells were stained with the primary antibody against NCoR2/SMRT (Abcam-24551) for 1 h at RT. After 3x washes, the cells were stained with a Secondary Ab labelled with Alexa Fluor 555 (Invitrogen) for SMRT and Tbet PE-Cy7 (BioLegend) for 30 mins. The expression levels were assessed using Cytek aurora (Cytek), and the data were analyzed using FCS express (version 7 plus). Reagent details are provided in Supplementary Table 4.
In vivo DC migration
Control and SMRT KD DCs were given intravenously (1×10⁶ DCs/mice). DCs were stimulated with CpG for 2 h and then stained with eF670 proliferation dye (APC). After 6 h of injection, mice were humanely euthanized by CO2 exposure. MLNs and Spleen were harvested, RBC lysed and single cell suspensions were processed to check for CD11c+eF670+ cells by flow cytometry. Gating for eF670 was done from those mice which received only vehicle control.
DSS-induced Colitis and adoptive transfer of DCs
Colitis was induced in C57/BL6 mice using 2.5% DSS (MP Biomedicals). Every 48 h DSS was renewed. Adoptive transfer of untreated and Mhy1485+DEBM treated SMRT-depleted DCs (1×10⁶ DCs/mice) were injected intravenously at D-5, D-3 and D + 1. Mice were monitored daily for body weight and disease severity. On D6, mice were deprived of food for 4 h, administered FITC-Dextran (4-40 KDa, 0.4 mg/g BW) intraperitoneally, after 3 h, mice were humanely euthanized by CO2 exposure and blood was collected for serum isolation. Fluorescence was measured in a plate reader having excitation at 488 nm and emission at 520 nm for quantification of epithelial damage. Further, colon lengths were measured along with spleen weight and Th1 profiling was done in MLNs, where IFN-γ and Tbet expressions were checked on CD3+CD4+CD44+ effector T cells upon restimulation with PMA (10 ng/ml), Ionomycin (500 ng/ml) and Brefeldin A (2.5 μg/ml). Reagent details are provided in Supplementary Table 4.
Single Cell ENergetIc metabolism by profilIng Translation inHibition (SCENITH)
Control and SMRT KD DCs (0.2×10⁶) were seeded in 48 well plates and left overnight. Next day, 6 h CpG stimulation was done. Then, 45 mins prior to completion, 15 mins of inhibitor treatment was performed by adding (Oligo-1μM, 2DG-100mM, DEBM-10mM and 2GDO-combined inhibition). After inhibition, 30 mins of Puromycin (10 μg/ml) treatment was carried out. Thereafter, cells were dissociated and collected for fixation with 2% PFA for 30 mins at RT. Finally, cells were permeabilized and stained with Anti-puromycin (PE) antibody for an hour in the dark. After washing, stained samples were acquired in BD LSR Fortessa II SORP.
DC-T cell Co-culture
OVA peptide (323-339)/OT-II was pulsed onto DC-1940 and FLT3 differentiated BMDCs (10,000 cells/condition) overnight for the ex vivo DC-T cell co-culture experiment. Enriched CD3+CD4+T cells were added to the DCs at a specific ratio (1:10, DC line and 1:5, BMDCs). Following this, after 72 hours, T cell proliferation was assessed using an amine-based dye (eFlour670-APC-1μM). After 96 h, T cells were restimulated with PMA (10 ng/ml), Ionomycin (500 ng/ml), and Brefeldin A (2.5ug/ml) simultaneously for 5 h, its differentiation into Th1 phenotype (T-bet+ and IFNγ+) were assessed by flow cytometry. Reagent details are provided in Supplementary Table 4.
Metabolite sample preparation for GC-MS analysis
Control and SMRT KD DC line samples were prepared upon stimulation with CpG for 6 h as previously described39. Briefly, for each condition, 10 × 106 cells were obtained, washed 2x with 0.9% NaCl solution, followed by adding cold methanol (800 μL) and the equivalent amount of milli-Q water to quench the metabolic reactions. Internal standard (2 mg/ml ribitol) was added for QC. Thereafter, 1.6 ml of chloroform was added, vortexed at 4 °C for 30 minutes. Upon centrifugation (10,000 g for 10 mins), the aqueous phase (300 μL) was collected and dried using Speed-Vac. The isolated compounds’ MS data were acquired using LC-MS either directly or after being derivatized with Methoxamine hydrochloride (MeOX-HCl) (2%) and N-methyl-N-(trimethylsilyl)trifluoroacetamide (MSTFA) before being run through GC-MS.
Extracellular glucose, lactate and glutamine assay
Control and SMRT KD DCs were seeded in 12 well plates in 500 μL of IMDM media and stimulated with CpG for 6 h. Following stimulation, the collected media was diluted in 1x PBS 100x times and quantified for extracellular glucose (Promega, J6021), lactate (Promega, J5021) and glutamine (Promega, J8021), according to the manufacturer’s recommendations. The standard curve was obtained by serial dilutions of known concentrations of glucose, lactate and glutamine solution provided in the respective assay kits. Luminescence was captured in a multimode reader (Perkin Elmer). Kit details are provided in Supplementary Table 4.
Immunoblotting
Whole-cell lysates were prepared using RIPA buffer (0.5 M EDTA, 1 M Tris-Cl pH7.5, 1 M NaCl, 200 mM, Roche protease inhibitor) upon 6 h CpG stimulation for control and SMRT KD DCs. Using BCA reagent (Pierce BCA Protein Assay Kit), protein concentration was estimated by measuring absorbance at 562 nm. Transferred membranes were probed with primary antibodies (p-mTOR & mTOR) and glycolytic proteins (CST-8337, PDH, HK-2, PFK, GAPDH, PKM2, LDHA) with controls, β-tubulin and β-actin. After that, HRP-conjugated secondary antibodies were added to produce signals on an X-ray film or in a Chemidoc system (Biorad) by adding an ECL solution. For western blotting of phospho and its corresponding total protein, we first probed the membrane with phospho-antibodies, stripped it, and then reprobed it with corresponding total antibodies. Prior to performing densitometric analysis, we normalized the phosphorylated form using their respective loading controls. An analogous method was applied for its corresponding total protein. The relative intensity was then represented as the ratio of normalized data. Reagent details are provided in Supplementary Table 4.
H/E staining
The colon of the humanely euthanized mice (CO2 exposure) mice was processed and stained by H-&-E staining to study the infiltration of cells among different mice groups. The steps included deparaffinization in xylene 2 times for 6 mins each, rehydration with decreasing alcohol concentrations, i.e. 100%, 95%, 70%, for 5 mins each followed by washing in DW 2x times. Haematoxylin was added with a dropper and held for 7 mins & washed with Scott’s tap water for 1 min. Eosin was added after that using a dropper and kept for 6 minutes. Following, which, DW was used to wash the slides. Once more, they received two 2-minute treatments of 95% and 100% alcohol, followed by two 2-minute treatments of xylene. After removing the extra xylene, DPX was used for mounting the slides. Images were captured in Apotome.
Mt DNA copies
Control and SMRT KD DCs (0.5 × 10⁶) were seeded in 12 well plates and left overnight. DNA was extracted from a conventional method39 for the Uns and 6 h CpG stimulated DCs. The DNA was subsequently processed for RT-qPCR utilizing Power SYBR green using the primer pairs for genes Nd-1 & HkII. Sequences are provided in Supplementary Table 4. Mitochondrial DNA copies were calculated as 2*2^ (dCT). Ct of Hk-II – Ct of Nd-1 gave the dCT value.
RNA isolation & RT-qPCR
RNA extraction was performed using Trizol reagent (RNA isoplus) as previously reported39. Briefly, chloroform was added and vortexed vigorously. After centrifuging the Trizol-chloroform mixture, the aqueous phase was collected, and a comparable amount of isopropanol was added and incubated. The mixture was then precipitated utilizing ethanol upon incubation. The pellet was subsequently reconstituted in NFW, and the amount was measured using a nanodrop (Thermo). Following that, cDNA was prepared using an Applied Biosystems high-capacity cDNA Reverse Transcriptase kit. Power SYBR Green (Applied Biosystems) was used for quantitative PCR, and PCR amplification was monitored in real-time with the Quant Studio 6 Instrument (Applied Biosystems). The relative mRNA expressions were determined for the following genes, Hk2, Pkm2, Ldha, Acc1, Fasn, Cpt1a, Gls1, Il6, Il12b, Slc2a1. Primer sequences are provided in Supplementary Table 4.
Intracellular ATP extraction and quantitation
ATP extraction was carried for Control and SMRT KD DCs at Uns and stimulated conditions (CpG 6 h) as previously described39. ATP was determined using an ATP measurement kit (Invitrogen, A22066) and a particular solution including prescribed proportions of dH2O, reaction buffer, dTT, d-luciferin, and luciferase enzyme, according to the manufacturer’s recommendations. Serial dilutions of a known ATP solution were used to generate the ATP standard curve. The luminescence was recorded using a Perkin Elmer multimode reader. Kit details are provided in Supplementary Table 4.
Seahorse-XFP extracellular flux assay
DC line (40 × 103) and BMDCs (10 × 104) were seeded in culture miniplates for the assay and allowed to settle overnight. Serial injections of Oligomycin (2 μM), (CCCP-2μM) and Rotenone + Antimycin A (0.5 μM each) were used for the Mito stress test. Serial doses of Glucose (10 mM), Oligomycin (2 μM), and 2-DG (50 mM) were employed in the Glyco-stress test. Glutamine and Succinate mediated OXPHOS experiments were executed with 1 h and 3 h pre-treatment of DON (10 μM) and DEBM (1 mM) respectively. For pyruvate oxidation, first injection of UK-5099 (2 μM), followed by a combined inhibition of Fatty acid oxidation by Etomoxir (4 μM), and Glutaminolysis by BPTES (3 μM), were used. Based on the target inhibitor OCR and all inhibitors OCR, dependency for pyruvate oxidation was calculated. The respiratory characteristics thus obtained were estimated using the WAVE software. The plotted OCR and ECAR values were normalized to the total protein content of each condition. The chemicals used were purchased from Sigma and prepared according to the manufacturer’s protocol (Seahorse Bioscience, Agilent Technologies). Reagent details are provided in Supplementary Table 4.
Human Colonic tissue isolation
Under the supervision of a Gastroenterologist, 5 patients diagnosed with Ulcerative Colitis (UC) participated in the study. Informed Consent was obtained from all the participants and fit into the Montreal classification of Inflammatory Bowel Diseases, while 3 IBS donors who consented to take part exhibited no symptoms of UC. Participants’ comprehensive clinical indicators pertaining to the disease severity were noted (Supplementary Table 1). All subjects provided written informed consent prior to participation in the study. For the study, tissue samples were collected as pinch biopsies from the rectal area and ethically approved by the Institute Ethics Committee (IEC)/Institutional Review Board (IRB) – 122/HEC/23.
Immunofluorescence
SMRT, GAPDH and PKM2 expressions were checked in IBS and UC colonic tissue samples. Tissues were fixed in 10% formalin at RT. Histological sections were prepared and processed overnight with an anti-NCOR2/SMRT, anti-GAPDH and anti-PKM2 primary antibody (1:100; CST). After the primary antibody incubation, cells were incubated with a fluorescence-conjugated secondary antibody F(ab’) 2-Goat anti-Rabbit IgG (H + L) Cross-Adsorbed Secondary Antibody (AF488, AF594 & AF647) for 120 mins and mounted with ProLong™ Gold antifade mountant with DAPI (Invitrogen). Finally the cells were observed and intensities were quantified under a STED confocal microscope.
RNA-seq sample preparation & Sequencing
The RNA-seq sample preparation & sequencing guidelines are followed as previously reported39. In brief, 6 h CpG stimulated (Control, Control+DEBM+Mhy1485, SMRT KD & SMRT KD DEBM+Mhy 1485) were processed for RNA extraction and library preparation. RNA extraction was performed using a kit from Macherey-Nagel according to manufacturer’s recommendations. Quantification was done by Nanodrop and purity was checked by Tapestation. Magnetic beads and an mRNA isolation kit were used to isolate mRNA from 1 μg of total RNA for library preparation (Poly-A mRNA isolation module, NEB). Following the manufacturer’s instructions, NEB’s mRNA library preparation kit Ultra II was used to prepare RNAseq libraries. The library concentrations were determined using Qubit 2.0 (Invitrogen), and fragment sizes were examined using Tapestation (Agilent). cDNA samples were denatured for 5 mins at RT with 0.2 N NaOH. To counteract the impact of the NaOH, 10 mM Tris-Cl pH-8.5 was utilized. HT1 buffer was used to dilute 4 nM cDNA libraries to a final loading concentration of 1.6 pM. The libraries were then sequenced on the Illumina NextSeq 550 platform. Kit details are provided in Supplementary Table 4.
RNA-seq analysis
Data analysis process started by subjecting the paired-end raw reads to rigorous quality control assessment using FASTQC. Following this, alignment to the mouse reference genome (mm10) was executed using HISAT2. Subsequently, gene count data extraction was accomplished using the feature Counts function, an integral component of the RSubRead R package. Our analysis pipeline continued with principal component analysis and differential gene expression analysis, which were skillfully conducted employing the DESeq2 package. For functional insights, we conducted Gene Ontology (GO) term enrichment analysis, leveraging the cluster Profiler package, and utilized GO (biological processes) terms sourced from MSigDb.
ChIP-seq for SMRT-NGS library preparation & Sequencing
SMRT ChIP-seq data in control Uns and at 6 h CpG stimulation has been utilized from our previous study18 to denote SMRT binding peaks at the genomic regions of Gls and Sdha.
Statistical analysis
Data are reported as mean values with associated standard error of the mean (SEM), unless categorically specified. Statistical comparisons were performed using a two-tailed Student’s t-test. Differences were regarded as significant if the calculated p-value (P) was less than or equal to 0.05, ensuring robust statistical significance determination.
Responses