Insulin resistance reduction, intermittent fasting, and human growth hormone: secondary analysis of a randomized trial

Introduction
Intermittent fasting safely produces significant weight loss and consequent cardiometabolic health improvements in controlled trials of alternate-day fasting, twice-per-week fasting, and time-restricted eating1,2,3,4,5,6,7. Compared to standard caloric restriction dieting, though, fasting does not produce clinically superior results for weight loss or related changes in fat mass1,2,4,6. The time-restricted eating form of intermittent fasting may, however, also produce health benefits that are independent of weight loss. Time-restricted eating may act in part through chronobiological changes that normalize metabolic circadian rhythms through the timing of meals8,9. Other intermittent fasting regimens may also have effects that are independent of weight loss, such as prolonged duration water-only fasting regimens whose calorie-free period of more than 20 hours may trigger survival-enhancing physiological adaptations that optimize and renew cellular, tissue, and organ-level functions10,11,12,13,14,15,16,17,18,19.
Prolonged water-only fasting induces a profound increase in human growth hormone (HGH)12,13,14,15, with a rapid 24-hour rise in HGH of 5- to 14-fold in males and females, respectively15. Fasting alters HGH independent of acute weight loss during extended episodes of fasting20, and basal HGH concentrations and the fasting-induced increases of HGH may be inversely related to cardiometabolic risk20,21,22,23. During fasting, HGH stimulates protein synthesis and conserves lean muscle12,13. Through HGH, fasting regulates insulin13, alters insulin-like growth factor 1 (IGF-1)13, and activates the conversion of triglycerides into free fatty acids13,24.
While HGH is a key mediator through which fasting acts to adapt the human body to a low-food-intake environment, it is unknown whether HGH has a larger role in personalizing the clinical improvements from intermittent fasting. One report from a crossover trial examining acute biomarker changes during one episode of 24-hour water-only fasting suggested that basal HGH concentration may modify the effect of fasting on changes in homeostatic model assessment of insulin resistance (HOMA-IR)20. Individuals with lower basal HGH experienced qualitatively greater reductions in HOMA-IR from fasting than those with higher baseline HGH, but the difference across 1 day of fasting was not statistically significant20. The present study is a post hoc examination of a 26-week randomized controlled trial of low-frequency 24-hour water-only intermittent fasting18. Through existing data from that trial, this study evaluated the interaction of HGH and intermittent fasting on changes in HOMA-IR or, secondarily, changes in its components (i.e., insulin or glucose) and changes in HGH.
Results
General characteristics
As expected, baseline HGH was different (p = 0.002) between females [median: 0.37 ng/mL, interquartile range (IQR): 0.09 to 0.90 ng/mL] and males (median: 0.09 ng/mL, IQR: 0.05 to 0.28 ng/mL). Baseline HGH in subjects randomized to intermittent fasting (n = 36) had median 0.29 ng/mL (IQR: 0.07 to 0.81 ng/mL) and was not different (p = 0.46) from controls (n = 32) who had median 0.15 ng/mL (IQR: 0.07 to 0.45 ng/mL). Baseline HOMA-IR was also not different between those randomized to intermittent fasting (2.51 ± 1.31) and controls (2.82 ± 1.74, p = 0.40), but had a trend to higher baseline HOMA-IR in subjects with lower vs. higher baseline HGH (3.22 ± 1.65 vs. 2.43 ± 1.43, respectively, p = 0.056). In those with lower and higher baseline HGH, age averaged 45.3 ± 10.5 and 50.4 ± 11.3 years (p = 0.10), females included 68.4% and 61.2% (p = 0.37), and weight averaged 103.1 ± 16.6 and 99.8 ± 25.4 kg (p = 0.60), respectively. Other baseline characteristics are provided in Table 1 stratified by trial randomization and baseline HGH category.
Overall (as previously reported in 71 subjects)18, in the N = 68 subjects with available HGH at baseline and 26 weeks (96% of completers, where 3 of the original 71 were missing baseline HGH), intermittent fasting substantially reduced HOMA-IR (−0.77 ± 0.81) compared to the ad libitum control arm (−0.07 ± 1.06, p = 0.003). This was a result of fasting profoundly reducing insulin (fasting: −2.85 ± 2.65 mIU/L; control: −0.16 ± 3.42 mIU/L; p < 0.001), but was not significant for reducing glucose (fasting: −6.81 ± 8.98 mg/dL; control: −2.38 ± 11.15 mg/dL; p = 0.07) (although glucose had p = 0.04 in the 71 subjects previously)18. As previously18, 26-week weight change was not different for fasting vs. control (−1.74 ± 4.81 kg vs. 0.21 ± 3.50 kg, p = 0.08).
Correlations of baseline and 26-week study outcomes
The 26-week change in weight was not correlated with 26-week changes in HGH (r = −0.12, p = 0.33), HOMA-IR (r = 0.03, p = 0.81), insulin (r = 0.12, p = 0.34), glucose (r = −0.10, p = 0.44), or changes in any other study variables except it was weakly correlated (i.e., r < |±0.40|) with diastolic blood pressure (DBP) change (r = 0.282, p = 0.020) and moderately correlated (i.e., r ≥ |±0.40| and r < |±0.70 | ) with change in waist circumference (r = 0.408, p < 0.001). Baseline weight was not correlated with 26-week changes in HGH (r = −0.227, p = 0.06), HOMA-IR (r = −0.135, p = 0.27), insulin (r = −0.135, p = 0.27), or glucose (r = −0.065, p = 0.60), or with baseline HGH (r = −0.115, p = 0.35) or glucose (r = 0.207, p = 0.09). However, baseline weight was strongly correlated (i.e., r≥ |±0.70 | ) with baseline waist circumference (r = 0.909, p < 0.001) and body mass index (BMI) (r = 0.859, p < 0.001), moderately correlated with baseline levels of HOMA-IR (r = 0.517, p < 0.001), insulin (r = 0.530, p < 0.001), and red cell distribution width-coefficient of variation (RDW-CV) (r = 0.431, p < 0.001), moderately inversely correlated with baseline high-density lipoprotein cholesterol (HDL-C) (r = −0.436, p < 0.001), weakly inversely correlated with baseline total cholesterol (r = −0.241, p = 0.048) and low-density lipoprotein cholesterol (LDL-C) (r = −0.311, p = 0.010), and weakly inversely correlated with 26-week change in HDL-C (r = −0.255, p = 0.036).
Baseline HGH moderately correlated with baseline HDL-C (r = 0.452, p < 0.001) and weakly correlated with subject age (r = 0.290, p = 0.016), baseline systolic blood pressure (SBP) (inversely: r = −0.259, p = 0.033), and 26-week changes in HDL-C (r = 0.373, p = 0.002). Change in HGH was inversely weakly correlated with age (r = −0.254, p = 0.036), but not with other baseline variables listed in Table 1 or 26 week changes in those variables.
Effect modification of fasting by baseline HGH
An interaction of intermittent fasting and baseline HGH was found (Fig. 1) in which lower basal HGH (females: baseline HGH ≤ 0.15 ng/mL; males: baseline HGH ≤ 0.05 ng/mL) modified the effect of fasting on 26-week declines in HOMA-IR and both of its components, insulin and glucose. In subjects with lower baseline HGH, mean 26-week changes in HOMA-IR were −1.04 ± 0.99 in the intermittent fasting arm and 0.60 ± 1.04 in the control arm (p = 0.003; Fig. 1A). In contrast, 26-week HOMA-IR changes in those with higher baseline HGH were −0.69 ± 0.75 for fasting subjects and −0.42 ± 0.92 for controls (p = 0.26). A test of interaction showed a significant effect modification of the intermittent fasting intervention by basal HGH (p-interaction=0.004).

Boxplots showing the interaction of baseline HGH in modifying the effect of intermittent fasting on 26-week changes in: (A) HOMA-IR (p-interaction=0.004), (B) insulin (p-interaction=0.028), and (C) glucose (p-interaction=0.006). These comparisons examined interactions across trial randomization arms and previously-defined categories of baseline HGH (Lower HGH: females, ≤0.15 ng/mL; males, ≤0.05 ng/mL. Higher HGH: females, >0.15 ng/mL; males, >0.05 ng/mL)20. Sample sizes in panels A, B, and C were n = 8, 11, 28, 21 for lower HGH/fasting, lower HGH/control, higher HGH/fasting, and higher HGH/control strata, respectively. For panel A), 26-week changes in HOMA-IR had p = 0.003 for the comparison of intermittent fasting to control subjects with lower HGH and p = 0.26 for those with higher HGH. For panel B), 26-week changes in insulin had p = 0.009 between fasting and control for lower HGH and p = 0.040 for higher HGH and, for panel C), 26-week changes in glucose had p = 0.019 between fasting and control for lower HGH and p = 0.94 for higher HGH. Median HOMA-IR, insulin, and glucose changes are bolded and next to the corresponding bold line inside the box, while IQR values on the figure define the lower and upper limits of the box. The whiskers above and below the boxes are 1.5 times the height of the specific box (or the limits of the actual data) and open circles are outliers >1.5 times the height of the box.
For 26-week changes in insulin (Fig. 1B) and glucose (Fig. 1C) in subjects with lower baseline HGH, intermittent fasting substantially reduced insulin (-3.40 ± 2.93 mIU/L) and insulin increased in controls (1.64 ± 4.07 mIU/L, p = 0.009), with a similar pattern for glucose (fasting: −9.13 mg/dL vs. control: 4.45 mg/dL, p = 0.019). In contrast, in subjects with higher baseline HGH, fasting had a more modest effect on insulin compared to control (fasting: −2.70 ± 2.59 mIU/L vs. control: −1.10 ± 2.68 mIU/L, p = 0.040) and no difference was found for glucose (fasting: −6.14 ± 7.68 mg/dL vs. control: −5.95 ± 10.23 mg/dL, p = 0.94). In a test of interaction, lower baseline HGH modified the effect of fasting on changes in insulin (p-interaction=0.028) and changes in glucose (p-interaction=0.006). Evaluations for interactions of age (above vs. below the median), sex (females vs. males), or baseline levels (above vs. below the median) of SBP, DBP, total cholesterol, LDL-C, HDL-C, triglycerides, weight, high-sensitivity C-reactive protein (hsCRP), hemoglobin, sodium, B-type natriuretic peptide (BNP), and RDW-CV with trial arm for changes in HOMA-IR, insulin, and glucose found no differences in the effect of intermittent fasting based on categories of those baseline variables (all p > 0.10). A sensitivity analysis of the interaction of HGH and intermittent fasting when excluding the subject with type 2 diabetes (a member of the control arm) showed similar results to overall for changes in HOMA-IR (p-interaction=0.007), insulin (p-interaction=0.041), and glucose (p-interaction=0.009).
Potential 26-week changes in HGH
HGH at 26 weeks in subjects randomized to intermittent fasting was median 0.48 ng/mL (IQR: 0.11 to 1.47 ng/mL) and in controls was median 0.16 ng/mL (IQR: 0.06 to 0.47 ng/mL). In a secondary evaluation, the 26-week change in HGH (Fig. 2A) qualitatively appeared to increase in intermittent fasting subjects (median change: 20.6%, IQR: −55.1% to 378%) and decline in controls (median change: −18.9%, IQR: −59.1% to 57.9%), but these changes were not significantly different (p = 0.23). When both baseline HGH category and randomization assignment were evaluated, the change in HGH due to intermittent fasting (Fig. 2B) also appeared qualitatively to be more substantial in subjects with lower baseline HGH (median changes: fasting 45.0%, IQR: 10.5% to 1,518%; controls -15.7%, IQR: −42.6% to 130%) than those with higher baseline HGH (median changes: fasting 13.2%, IQR: −64.0% to 373%; controls -22.0%, IQR: −69.4% to 29.6%), but these differences between fasting and control were not significant for lower baseline HGH (p = 0.32) or higher baseline HGH (p = 0.33) and, thus, no interaction existed between baseline HGH and fasting on HGH changes (p-interaction = 0.88).
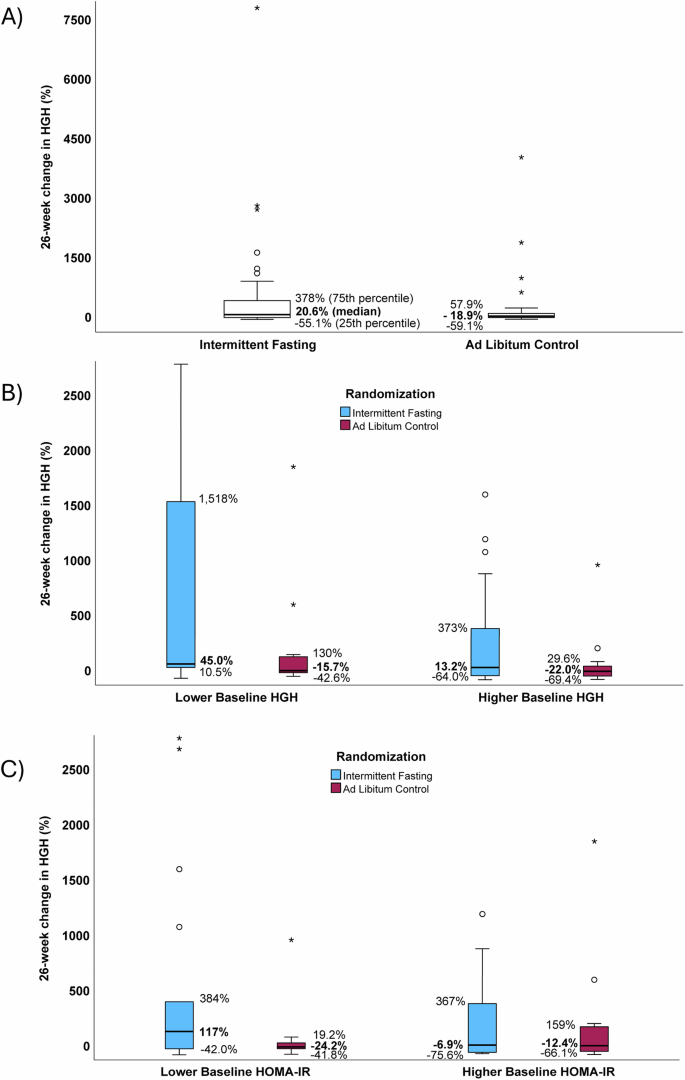
Boxplots presenting the relative 26-week changes in HGH, showing: (A) no difference between fasting and control arms (p = 0.23), (B) no interaction of baseline HGH and fasting on HGH change (p-interaction=0.88), and (C) a potential interaction of baseline HOMA-IR (lower: ≤2.20, higher: >2.20) in modifying the effect of fasting on HGH change (p-interaction = 0.07). Sample sizes in panel A were n = 36 for intermittent fasting and n = 32 for ad libitum control, while for panels B and C they were n = 8, 11, 28, 21 for lower HGH/fasting, lower HGH/control, higher HGH/fasting, and higher HGH/control subgroups, respectively. Median HGH changes are bolded and correspond to the bold line inside the box, while IQR values on the figure define the lower and upper limits of the box. The whiskers above and below the boxes are 1.5 times the height of the specific box (or the limits of the actual data), while open circles are outliers >1.5 times the box height and asterisks are outliers >3.0 times the box height. For readability, B, C have omitted two outlying HGH change datapoints whose changes were >3000% (A shows that one of these omitted values was in the fasting arm and one in the control arm).
In exploratory analyses, 26-week changes in HGH interacted with baseline HOMA-IR (Fig. 2C; baseline HOMA-IR was defined as follows: lower was ≤2.20, n = 34, and higher was >2.20, n = 34), with nominal statistical significance revealed for a 26-week increase in HGH among subjects with lower baseline HOMA-IR (median HGH changes: fasting 117%, IQR: −42.0% to 384%, n = 18; control −24.2%, IQR: −41.8% to 19.2%, n = 16; p = 0.035), but not in those with higher baseline HGH (median changes: fasting −6.9%, IQR: −75.6% to 367%, n = 18; control −12.4%, IQR: −66.1% to 159%, n = 16; p = 0.92). In a test of interaction, the effect modification on fasting by lower baseline HOMA-IR had a trend to significance (p-interaction=0.07). No effect modification on fasting-related HGH changes was found in interaction analyses with age, sex, or baseline levels of weight, glucose, insulin, SBP, DBP, total cholesterol, LDL-C, HDL-C, triglycerides, hsCRP, hemoglobin, sodium, BNP, or RDW-CV (all p > 0.10).
Discussion
In a secondary analysis of a randomized controlled trial of intermittent fasting, subjects with baseline HGH below normal or in the lower end of the normal range (that is, females with baseline HGH ≤ 0.15 ng/mL and males with baseline HGH ≤ 0.05 ng/mL) were more likely to experience substantial declines in HOMA-IR, insulin, and glucose due to the 26-week trial fasting intervention (note that, according to ARUP, the normal HGH range for adult females is 0.05-8.0 ng/mL and for adult males is 0.05–3.0 ng/mL). Subjects with higher baseline HGH had more modest declines in HOMA-IR, insulin, and glucose that were either not significantly different from changes in controls (i.e., for HOMA-IR and glucose) or, in the case of insulin, did achieve p < 0.05 compared to controls but the effect size was less profound than the difference between fasting and controls recorded in the lower HGH group. Tests of effect modification were highly significant for an interaction of lower HGH and fasting in triggering substantial changes of HOMA-IR, insulin, and glucose. Changes in HGH, HOMA-IR, insulin, and glucose were not correlated with weight loss, and changes in HGH were only correlated with HDL-C. Baseline weight was moderately correlated with a high-risk phenotype, being correlated with initial HOMA-IR, insulin, and RDW-CV, and inversely moderately correlated with initial HDL-C, while baseline HGH was moderately positively correlated with initial HDL-C. Changes in HGH over the 26-week trial intervention due to fasting were not modified by baseline HGH or other baseline variables, with the exception of a potential interaction of baseline HOMA-IR with fasting in the 26-week change of HGH where HGH was more likely to be increased by fasting if HOMA-IR was initially lower than the median.
Prolonged fasting and ketogenic diets are well-established triggers of the metabolic shift of energy substrates from glucose to fatty acid-derived ketones10,11,16,17,19. Fasting induces an increase in circulating ketones independent of weight loss19. Extended fasting also activates autophagy25,26,27,28, removing dysfunctional organelles, eliminating pathogens, and leading to improved cellular energy regulation29,30,31,32,33,34. Prolonged fasting reduces anemia15,35, triggers natriuresis15,35,36, and alters inflammatory processes, the microbiome, and immune function independent of weight loss16,27,37,38,39. Other biological mechanisms are affected by fasting, with more than 1000 plasma proteins significantly altered during water-only fasting out of just 2923 proteins that were examined by one trial19. Most of those one thousand changed proteins were altered independent of weight loss19.
In adults, HGH regulates a variety of key systems related to growth and metabolism through pleiotropic effects such as the conversion of stored triglycerides in adipose cells into circulating fatty acids24, the activation of insulin and IGF-112,13, the stimulation of protein synthesis, and the protection of lean muscle12,13. HGH may impact heart function directly by empowering improved myocardial contraction and protecting the heart from the nutritional stress of fasting through elevated ketones that occur in a consequence of increased circulating fatty acids. This effect is reported both in animals40, and in human cardiac cells derived from people with heart failure41. HGH actions may also reduce insulin resistance, perhaps by reducing the mass of adipose tissue, even in fasting regimens that do not substantially alter weight18. Reduced insulin resistance is linked to improved cardiovascular health and better long-term outcomes.
In contrast, HGH deficiency is linked to poor cardiovascular health, with diminished expression of the HGH/IGF-1 axis connected to earlier aging and higher levels of adiposity21,22,23,42, thus increased HGH may ameliorate risk factors for cardiovascular disease. Because chronically elevated HGH is linked to poor outcomes23,24, though, intermittent fasting regimens permitting only water intake during 24-40 hours may provide an important balance of HGH through substantial but temporary increases in HGH without causing chronically high levels14,15,20,43. Optimal HGH levels may, thus, lead to lower insulin resistance that subsequently reduces risk for cardiovascular diseases, while also raising ketones that strengthen the contraction of the heart muscle, in addition to other cardioprotective effects.
In a prior randomized trial, findings hinted at HOMA-IR being reduced more in participants with lower basal HGH, primarily due to a reduction in insulin, but the finding was based on changes experienced during a single 24-hour fasting episode20. Over 26 weeks in the present study, however, intermittent fasting substantially reduced insulin resistance (measured as HOMA-IR), and did so more profoundly in patients with initially lower basal HGH. For subjects with lower basal HGH herein, the middle 50% (the box component of a boxplot) of subjects randomized to fasting had 26-week HOMA-IR changes that were all lower than the middle 50% of changes in HOMA-IR for subjects in the control arm. Fasting reduced insulin resistance in a more nuanced manner for people with higher basal HGH (the boxes of HOMA-IR values for the fasting and control arms of subjects with higher baseline HGH in Fig. 1A overlapped to a great extent). The interaction of baseline HGH with intermittent fasting was highly significant (p-interaction=0.004).
This fasting-triggered and HGH-dependent personalization of HOMA-IR change resulted in substantial optimization of insulin sensitivity for individuals who potentially had the greatest cardiovascular need for improvement (i.e., whose lower basal HGH levels potentially marked higher risk of future adverse cardiovascular outcomes). This suggests that HGH may be useful as a guide for the selection of the type and intensity of a fasting regimen since both HGH deficiency and chronic HGH elevation are linked to poor cardiovascular health. This is potentially both an issue of efficacy and safety in which HGH may be useful in monitoring fasting dose to ensure that individuals with lower HGH achieve a meaningful therapeutic reduction in HOMA-IR, resulting in efficacious health improvement. The safety concern is regarding whether fasting repeatedly over time also increases HGH and if too much fasting can result in chronically high HGH levels.
In a previous trial evaluating changes in plasma biomarkers due to water-only fasting, HGH not only increased by 5-14-fold during fasting15, that acutely-increased HGH was greater in subjects with lower basal HGH than for people with initially higher HGH20. That finding, though, was during the fasting period when HGH is known to be substantially increased15. No study has previously evaluated whether basal HGH increases after repeated episodes of fasting. In the present 26-week study of a once-per-week 24-hour fasting regimen, exploratory analyses revealed an increase in HGH concentrations for subjects with initially low baseline HOMA-IR (≤2.20) but no difference in HGH change for those with higher baseline HOMA-IR (>2.20), with a weak trend for the presence of effect modification (p = 0.07). This hypothesis-generating finding may be nothing, but it is intriguing because it suggests that a feedback mechanism may exist in which HGH and insulin resistance are intertwined. Through the relationship of HGH and insulin resistance, the profound reduction in HOMA-IR reported here due to fasting may further promote an increase in HGH to aid in the maintenance of homeostasis. It may be that decreased insulin and glucose due to fasting activate a positive feedback mechanism in which continued long-term use of intermittent fasting leads to longer-term increases in HGH for the optimization of health. If long-term increases in HGH do occur, it could be part of a cycle that ameliorates cardiac risk factors such as high SBP and low HDL-C that were correlated with low basal HGH in this study. In other populations, low HGH was associated with elevated cardiovascular risks21,22,23,42.
While such increases in HGH could be one of the mechanisms of fasting-triggered health improvements, the safety issue of having an HGH concentration that is perpetually too high may also be a concern for people who fast too often or use regimens that are too intense. Because chronically elevated HGH is associated with elevated health risks23,24, ensuring that HGH does not become continually elevated is a therapeutic concern. Realizing optimal therapeutic HGH levels that are in the upper end of the normal range may be needed, but further study of the implications of HGH in health and the consequences of increasing HGH through fasting are required.
Weight loss during the 26-week trial was not correlated with baseline levels of HGH, HOMA-IR, insulin, or glucose, or with 26-week changes in those measures. Prior studies documented a lack of connection between short-term weight loss and acute changes in plasma proteins during the calorie-free period of a fasting episode19,20. This study extends those findings to elucidate a lack of correlation of HGH, changes in HGH, insulin resistance, and changes in insulin resistance with 6-month weight changes. These findings suggest that those factors appear more influenced by the length of a water-only fast and not by weight loss.
The potential limitations of this post hoc analysis of prospectively generated data from a randomized clinical trial include that the primary endpoint of the trial was not HOMA-IR (it was a pre-specified secondary endpoint) and that an interaction of fasting with baseline HGH was not originally hypothesized18. While baseline characteristics here did not differ significantly based on trial randomization, and only insulin was significantly different between categories of baseline HGH, it may be that the randomization process did not balance all potential confounders that were unmeasured, thus interpretation of causality should be considered carefully. Also, the sample size that was studied here, although it included 96% of the final trial population (68 out of 71 subjects, with those 3 missing baseline HGH), was not large and subgrouping by HGH separated the population into even smaller strata. These findings require replication in a larger population through a randomized trial designed to prospectively test the primary hypothesis of an HGH interaction with fasting. The original trial did collect data about adherence to fasting and about major changes in diet that may have occurred across the 26-week intervention (no major changes were recorded)18, but detailed caloric intake information was not recorded by the trial, thus some unmeasured dietary nuance may exist. Because the level of HGH may be affected by variations in metabolic status, these findings may not generalize to other populations such as people with type 2 diabetes, those receiving medications that alter metabolic health, individuals with rare or severe metabolic derangements, and others with conditions affected by the metabolism. Further, longitudinal changes in HGH may in theory cause variation in the benefits derived from intermittent fasting. Additionally, other determinants may play a role in individual response to intermittent fasting, thus factors connected to HGH should also be studied in future investigations. For example, IGF-1 was not evaluated here but its interrelationship with HGH and insulin is well-established44, thus future investigations should examine potential intermittent fasting-induced changes in IGF-1 or interactions with baseline IGF-1. Finally, the population of the trial was selected from individuals in a community with a predominantly White racial composition and inclusion specifying those who were free of cardiovascular and other chronic diseases, thus the generalizability of the findings to other races and to people with varied metabolic status is unclear. The hypothesis requires testing across all races and among people who are free of cardiac risk factors, individuals with early and progressing metabolic derangements, and those who have existing chronic disease diagnoses.
In summary, in a population evaluated previously via randomized controlled trial, lower baseline HGH was common and it modified the effect of a low-frequency water-only 24-hour fasting intervention on HOMA-IR change during 26 weeks, resulting in a profoundly greater reduction in HOMA-IR compared to controls and to subjects with higher baseline HGH. Lower HGH and fasting also interacted in the change of both insulin and glucose. In exploratory analyses, a complementary positive feedback mechanism was found in which subjects with lower HOMA-IR had a trend to greater 26-week increase in HGH that may personalize health improvements and support restoration of homeostasis specifically in those individuals with poor cardiovascular health (e.g., high SBP and low HDL-C). Further investigations in larger randomized trials are needed to validate that basal HGH interacts with prolonged fasting to improve measures of health such as reducing HOMA-IR, what the implications of low HGH are in general populations of people who are otherwise free of chronic diseases, and especially to investigate whether basal HOMA-IR interacts with fasting to personalize the increase in HGH for individuals with poor cardiovascular risk profile.
Methods
Objectives
This study examined whether a lower baseline HGH modified the effect of intermittent fasting over 26 weeks in reducing HOMA-IR more than in subjects with higher baseline HGH. HGH was dichotomized based on thresholds from a prior study with lower basal HGH for females being HGH ≤ 0.15 ng/mL (males: HGH ≤ 0.05 ng/mL) and higher HGH defined for females as HGH > 0.15 ng/mL (males: HGH > 0.05 ng/mL)20. Secondarily, this study also evaluated similar interactions of baseline HGH and intermittent fasting in differentially changing the individual components of HOMA-IR (i.e., insulin and glucose) or changing HGH over the 26-week trial. Finally, correlations of baseline HGH and changes in HGH with weight, weight loss, and other variables at baseline and over 26 weeks of fasting were examined along with exploratory hypotheses regarding interactions of other baseline variables with fasting in differentially changing HOMA-IR, insulin, glucose, or HGH over the 26-week trial.
Trial design and subjects
The previously published single-site unblinded randomized controlled Weekly ONe-Day watER-only Fasting interventionaL (WONDERFUL) trial compared a 26-week low-frequency intermittent fasting regimen to an ad libitum control18. Using a 1:1 block design, the trial randomized 50 subjects to 24-hour water-only twice per week on non-consecutive days for 4 weeks followed by once per week for 22 weeks and 53 subjects to control (38 fasting and 33 control subjects, n = 71, completed the final 26-week visit). A CONSORT diagram and description of sample size calculations and randomization techniques were previously published18. The trial found substantial significant reductions of both HOMA-IR and a metabolic syndrome score by intermittent fasting even after correction for multiple comparisons, but no difference in weight loss was found18. The trial was approved by the Intermountain Healthcare Institutional Review Board (IRB 1050163), registered in May 2016 at clinicaltrials.gov (NCT02770313), enrollment began in November 2016, and the final subject’s 26-week visit was 19 February 2020. All subjects provided written informed consent prior to participation. This analysis and reporting of trial data followed CONSORT guidelines.
Subject recruitment was accomplished primarily by screening electronic health records for Intermountain Health patients who appeared to meet inclusion and exclusion criteria. A physician executive who was not involved in the study mailed those individuals a letter describing the study and how to participate if interested. Additional recruitment efforts used advertising at outpatient clinics, at health fairs, and through media and social media. Enrollment was completed at the Intermountain Medical Center research clinic by clinical coordinators. Subjects were aged 21-70 years with LDL-C elevated but not high enough to meet clinical guidelines for statin therapy (LDL-C had to be 90-189 mg/dL for ages 21–39 years, 90-159 mg/dL for ages 40–70 years, or ≥90 mg/dL for any who previously stopped a statin due to contraindications or intolerance). Other inclusions were males or non-pregnant females who had ≥1 metabolic syndrome factor [i.e., high waist circumference (females: ≥88.9 cm, males: ≥101.6 cm) or BMI (>25 kg/m2), elevated fasting glucose (>100 mg/dL), high triglycerides (≥150 mg/dL or triglyceride-lowering medication use), low HDL-C (females: <50 mg/dL, males: <40 mg/dL), or high SBP (≥130 mmHg), DBP (≥85 mmHg), or antihypertensive use]. Exclusions included the use of statin medications, anti-diabetes medications, prior solid organ transplantation, or carrying a chronic disease diagnosis such as coronary heart disease, cancer, cerebrovascular disease, dementia, type 1 diabetes, chronic kidney disease, peripheral vascular disease, chronic obstructive pulmonary disease, immunodeficiency, or an eating disorder18. Type 2 diabetes was not excluded, but few individuals with the diagnosis were included due to a requirement to not be using anti-diabetes medications.
Four study visits were conducted to start the study (baseline) and at 4 weeks, 13 weeks, and 26 weeks where surveys, fasting logs (i.e., adherence tracking), dietary change tracking, laboratory testing, and physical exams were completed. As reported18, 8 subjects in the control arm (but 0 fasting subjects) withdrew due to a dislike of their randomization assignment, while other reasons for drop-outs were similar between the two arms (12 in each arm). Fasting diaries for the intervention arm showed adherence of 95 ± 12% (36 had ≥80%, 1 had 70%, 1 had 37%)18. No subject died during the trial based on data from the US Social Security Administration, Utah death certificates, and Intermountain electronic health records, and adverse events related to the intervention were mild18.
Baseline study variables
Circulating concentrations of HGH were tested in the Intermountain cardiovascular research laboratory using the Quantikine human HGH ELISA (R&D Systems, assay DGH00). EDTA-stabilized blood was collected by venipuncture, stored immediately at 2 °C, and within 60 minutes centrifuged at 2400 g at 4 °C for 15 min. Plasma was pulled from the sample immediately after centrifugation, aliquoted into multiple tubes, and stored at −80 °C. A frozen plasma aliquot for each subject was thawed and equilibrated to room temperature before conducting the 4.5-hour assay. HGH testing was performed in batches after the trial concluded, with baseline and follow-up samples included in the same ELISA plates.
Baseline age, sex, race, pre-diabetes status, and type 2 diabetes diagnosis were gathered at baseline from subject interview. Baseline weight, height, waist circumference, SBP, and DBP were measured during the initial physical exam, as previously described18. BMI was calculated as the weight in kilograms divided by the square of the height in meters. Clinical chemistry testing for baseline glucose, insulin, sodium, total cholesterol, LDL-C, HDL-C, triglycerides, and hsCRP used peripheral blood samples tested in the Intermountain central clinical laboratory on a VITROS laboratory system (Ortho Clinical Diagnostics, Raritan, NJ). HOMA-IR was calculated from measured concentrations of glucose (mg/dL) and insulin (mIU/L): HOMA-IR = (insulin × glucose)/405. Clinical laboratory testing of the complete blood count was performed on Sysmex hematology analyzers (Sysmex America, Lincolnshire, IL) to obtain hemoglobin and RDW-CV. BNP was assayed using peripheral blood samples in high-sensitivity ELISA test kits from MyBiosource, Inc.
Study outcome variables
The primary outcome evaluated in this study was 26-week change in HOMA-IR, with secondary outcomes designated as 26-week changes in glucose, insulin, and HGH. Measurements of 26-week insulin, glucose, and HGH and calculation of 26-week HOMA-IR used the methods noted above on samples from the final trial visit. Changes in HOMA-IR, insulin, glucose, and HGH were defined as change scores (26-week value minus the baseline measurement). HGH, insulin, and glucose were tested on samples drawn after a 12-hour fast and follow-up samples at 26 weeks were drawn at the same time of day for each participant as the time of the baseline sample to standardize factors such as sleep and timing of dietary intake that might impact HGH level.
Statistical methods
Subject characteristics were evaluated by category of baseline HGH and by randomization arm, with comparisons by baseline HGH category analyzed using Student’s T-test or the chi-square test, as appropriate. Comparisons between trial arms used similar methods. Because their distributions were non-normal based on the Kolmogorov-Smirnov test, differences for baseline hsCRP and BNP were compared using the non-parametric Mann-Whitney-Wilcoxon test, with data reported as medians with IQRs. The Kolmogorov-Smirnov test showed changes in HOMA-IR, insulin, and glucose approximated the normal distribution here (p ≥ 0.20), but continuous-valued baseline HGH and HGH change were non-normally distributed (p < 0.001). Because of those non-normal HGH distributions and for consistency of presented data, all correlation coefficients were calculated using the non-parametric Spearman’s rho test statistic.
Interaction analyses for changes in HOMA-IR, insulin, or glucose as the dependent variable used general linear modeling that entered, as fixed factors, the main effect variables for trial randomization and for dichotomous baseline HGH category along with the interaction variable of randomization*HGH category and entered age and sex as covariates given that HGH varies by those factors. Exploratory analyses for those dependent variables of interactions of fasting with other baseline variables were performed by replacing the HGH category with sex or baseline variables dichotomized at the median: age, weight, SBP, DBP, total cholesterol, LDL-C, HDL-C, triglycerides, hsCRP, hemoglobin, sodium, BNP, or RDW-CV. Due to the non-normal distributions of HGH change, comparison of HGH change by baseline HGH categories, randomization arm, or other variables (e.g., baseline HOMA-IR) used the non-parametric Mann-Whitney-Wilcoxon rank sum test. Further, interaction analyses of randomization arm and baseline HGH category for the dependent variable of HGH change used quantile regression with fixed factors and covariates modeled as noted above for general linear modeling. Medians with IQRs are provided for HGH and HGH changes.
Analyses by trial randomization employed the intent-to-treat approach. Subjects were excluded if they had missing data (including 3 subjects with missing baseline HGH and 32 subjects with missing 26-week HGH, glucose, and insulin data, for a total of N = 68 subjects studied herein). A p-value at p ≤ 0.05 was used to define statistical significance for the 26-week change in HOMA-IR. Other analyses were not adjusted for multiple comparisons because they were either subanalyses (i.e., the evaluations of insulin and glucose since they are components of HOMA-IR) or were exploratory hypothesis-generating analyses in need of further study. Statistical analyses used SPSS v29.0 (IBM SPSS, Armonk, NY).

Responses