Conducting marine genetic research for whom? Mapping knowledge flows from science to patents
Introduction
Having evolved over 3.7 billion years, marine biodiversity constitutes a highly rich yet understudied pool of genetic diversity1. Conceptualized as ‘marine genetic resources’, genetic materials from the ocean and the sequence data derived thereof have attracted increased economic interest as a source for biotechnological innovation in recent decades2. For instance, scientists have turned to the deep sea to search for new antibiotics in the face of emerging multidrug resistance3. Microorganisms of the genus Pseudomonas were found to degrade plastics, which has led scientists to consider these properties in bioremediation strategies4. The market value for marine biotechnology has been projected to reach $6.4 billion by 20255. Beyond commercial value, genes and genetic diversity provide essential ecosystem services6. This includes ecological benefits, as the genetic variability of a species can play a crucial role in its adaptive capacity and resilience to environmental pressures7,8, such as ocean warming9,10, acidification9, or decreases in salinity levels11. As most attributes of organisms are encoded within genes, marine genetic resources also bear value to humanity and to Indigenous and local communities, more specifically as a source of nutrition12 and an important element in socio-cultural practices13,14.
In light of their multiple benefits, marine genetic resources and related biotechnological applications are considered an important pillar of the ‘blue economy’, which aims to promote environmentally sustainable and equity-focused economic activities in the ocean15. Due to the richness of marine biodiversity in many places of the Global South, marine genetic resources bear particularly great potential among various sectors of the blue economy in supporting more equitable use of ocean resources16. However, achieving benefits from marine genetic resources requires economic, scientific and technical capacities to collect and use the necessary materials and data17. At present, these capacities are highly unequally distributed at the global level18,19,20,21,22,23. Capacities to conduct marine biological research, measured in terms of publication output, are dominated by developed countries22,23,24. Developing countries have increased their capacities over the past years, but they are still comparatively low23,24. This can also be observed in the number of vessels nationally available for scientific explorations25. Global imbalances in capacity shape the distribution of intellectual property on marine genetic resources as well, as patent applications are highly concentrated in only a handful of countries and companies18,19,20. New policies and practices of resource management will be needed for marine genetic resources to reach their full potential.
Capacity-building and benefit-sharing for developing countries have thus been central issues for biodiversity governance in recent years. Following international frameworks on plant and viral genetic resources under the Food and Agricultural Organization of the United Nations (FAO) and the World Health Organization (WHO), the Nagoya Protocol26 to the Convention on Biological Diversity (CBD) was the first step to regulate marine genetic resources27. Having entered into force in 2014, this protocol aims to prevent cases of inequitable extraction of terrestrial and marine genetic resources by obliging users to enter bilateral agreements with those countries in which they collect materials. In the context of a recent decision to develop access and benefit-sharing measures for genetic sequence data (also called ‘digital sequence information’—DSI)28, Parties to the CBD are now considering how to extend or transform these existing arrangements29. These discussions have carried over to negotiations on a legally binding treaty on the conservation and sustainable use of Biodiversity Beyond National Jurisdiction (BBNJ), which was adopted in June 2023. States contentiously negotiated for over five years on how benefits arising from the use of marine genetic resources should be shared multilaterally. While developing countries aimed for a treaty that draws on the so-called ‘common heritage of humankind principle’ with substantive provisions to alter inequities in access and abilities to conduct research on marine genetic resources, developed countries aimed for provisions more in line with the status quo, namely the ‘freedom of the High Seas’30,31,32. Parties eventually agreed on a compromise that includes the sharing of scientific data, international research opportunities, and the regular redistribution of monetary benefits arising from the use of marine genetic resources to capacity-building and conservation projects through a purposed fund33. However, no concrete provisions affecting intellectual property regimes were introduced34 and heavy bureaucratic burdens on scientific researchers will likely be avoided35. Many details of the capacity-building and benefit-sharing schemes under the BBNJ treaty and the CBD still need to be negotiated moving forward. In the meantime, there is an acute need for research on how such international frameworks may effectively increase the equitability and inclusivity of marine genetic research and related innovation practices.
The literature on genetic resource governance provides insights into mechanisms that, on the one hand, contribute to inequities in the global distribution of scientific and technical capacities and, on the other hand, could be leveraged to create more equity. A frequently highlighted point is the importance of infrastructure in enabling marine genetic research, such as sequencing equipment and other scientific tools36, research vessels25, funding37, and data-sharing38,39. Development of infrastructure can be supported by the above-mentioned biodiversity treaties and their mechanisms for capacity-building23,40 and benefit-sharing25,41,42,43, as well as through other public or private investments. Another line of research focuses on social relations between scientists, highlighting how international collaboration choices can re-produce global imbalances as they favor countries that are already within the scientific elite21. Without concrete interventions in existing social networks, there are little opportunities for new relationships and practices to emerge that would strengthen the capacities of developing countries and their scientists21,44,45. A third line of argumentation points to the importance of creating interactions between academic research and corporate activities to strengthen blue economies, including in developing countries17,46,47,48. A few case studies49,50 provide insights into how such interactions may develop at different stages of typical marine bioprospecting pipelines51. Described cases include a bacteria isolated from the deep sea worm Alvinella Pompejana, which was collected by French researchers and later used to develop a face cream49,52, and the ‘bengamide’ molecule, which U.S. American scientists found in a sea sponge from Fiji and which inspired anticancer clinical trials by Novartis50,53. However, it remains unclear how insights from these studies generalize to interactions between marine genetic research and corporate activities beyond these cases. A separate body of literature in innovation studies has researched relations between scientific and corporate activities in more generalizable terms as knowledge flows between actors54,55,56,57,58,59,60. However, this literature has not yet informed the discussions or the research on equity related to marine genetic resources.
To address this lack of systematic research on relations between marine genetic research and corporate activities, we identified 23,417 scientific papers associated with genetic sequences from 31,578 marine species in GenBank, the biggest repository of sequence data. By tracing knowledge flows from these studies, we established connections to a set of 7170 patents that cite these papers on their front page. Finally, we linked scientific papers to provider countries and patents to user countries through a combination of available metadata and manual curation. We focus on the nation-state level as this has been the primary level of analysis in studies of global capacity in marine genetic research and innovation activities. Even though nation-states are not the immediate producers or users of knowledge flows, they can nevertheless be understood as actors themselves as they regulate, fund and benefit from national science and innovation systems61. Furthermore, they establish the conditions for accessing and using genetic resources within their jurisdiction and are entangled with the interests of affiliated companies and scientists62,63.
Our analysis first reveals which countries contributed most to the publication of marine genetic studies. Second, it estimates the relevance of these studies for either follow-up scientific publications (from here on ‘secondary science’) or patents and compares this at the national level. Third, it explores which research content was most relevant to either secondary science or patents. Fourth, it examines how science and patenting activities balanced across countries, measured in terms of aggregate publication and patent counts, as well as via estimation of knowledge flow from science provider to patenting countries.
Results
Global imbalances characterize scientific capacity to sequence marine genetic resources
Figure 1 displays how many marine genetic studies researchers from economic groups and countries contributed to, either as lead or co-authors. Organisation for Economic Co-operation and Development (OECD) countries were responsible for around 77% of all papers. Brazil, Russia, India, China, and South Africa (BRICS) accounted for 16%, Group of 77 (G77) countries for 4%, and others for 2%. Researchers from the U.S., China, and Japan alone covered almost 50% of all papers. The most active G77 country was Thailand with 1%, and the biggest provider outside of the economic blocs was Taiwan with 2% of all publications (publication numbers for the top 20 countries are visible in Table S1).
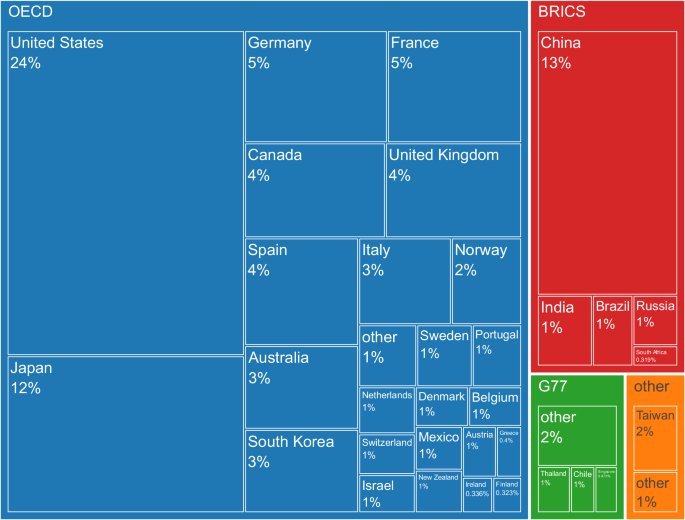
Box sizes represent shares of total publications.
To estimate the relevance of publications to follow-up scientific studies, we contrasted publication numbers with average citations by secondary science. The countries with the highest average citations by science among the top 20 were the United States, Germany, and Switzerland (Table S1). Countries like China and South Korea had many publications but relatively small average citations by science. We found that the number of publications was moderately correlated (p < 0.05, r = 0.27) with average citations by science, and not correlated with average citations by patents (Table S2). The data used for national-level analysis are available in Supplementary data file 3.
As relevant to science, as relevant to patents: comparing citation frequencies
We compared how often a country’s marine genetic research got cited by secondary science and by patents. We found a moderate positive and significant correlation (p < 0.01, r = 0.36), implying that if a country’s research is relevant for secondary science, it is also likely to be of some interest for patenting (Table S2; Fig. 2).
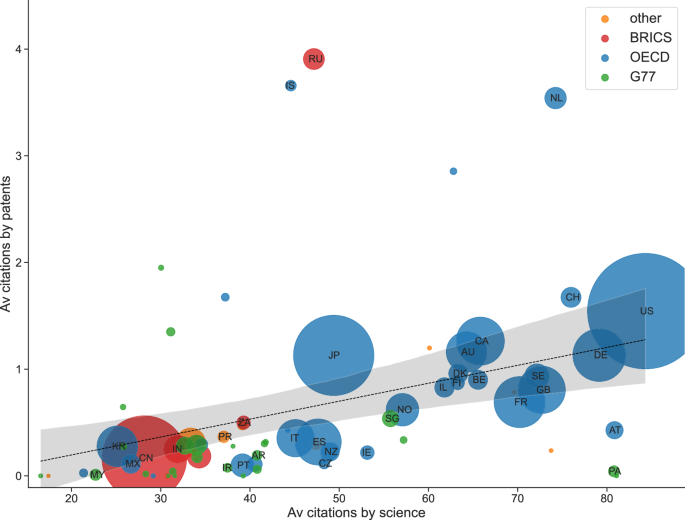
Figure is based on countries with more than 5 publications (n = 70). Node size displays the number of publications and color displays economic group. 95% confidence intervals are displayed. Countries: US United States of America, AT Austria, PA Panama, DE Germany, CH Switzerland, NL Netherlands, GB United Kingdom of Great Britain and Northern Ireland, SE Sweden, FR France, CA Canada, BE Belgium, AU Australia, DK Denmark, FI Finland, IL Israel, NO Norway, SG Singapore, IE Ireland, JP Japan, NZ New Zealand, RU Russian Federation, CZ Czechia, ES Spain, IS Iceland, IT Italy, AR Argentina, ZA South Africa, PT Portugal, IR Iran, PR Puerto Rico, IN India, CN China, MX Mexico, KR South Korea, MY Malaysia.
However, for some countries, the relevance of their research for patenting lay below the linear prediction. For instance, research that included authors from Panama (‘PA’) had many citations from secondary science, but close to no citations from patents. Countries whose research was similarly relevant to science would receive, on average, about one more patent citation per paper. This is a lot, considering that the country most relevant to patenting displayed here, Russia, only received around four citations by patents per scientific paper. Other countries with low relevance to patents were Austria (‘AT’), Czech Republic (‘CZ’), and Ireland (‘IE’). At the other end of the spectrum, countries above the trend were Russia (‘RU’), Iceland (‘IS’), and the Netherlands (‘NL’). These latter countries’ research got more cited in patents than would be expected from their relevance to secondary research.
Semantic polarization between science and patenting
To explain why certain types of research may be more or less relevant to science or patenting, we constructed an indicator that ranks terms found in the titles of marine genetic studies based on their average citations from both scientific publications and patents (Fig. 3). The indicator weights the words by their frequency to reveal semantic leaning of commonly used words64.
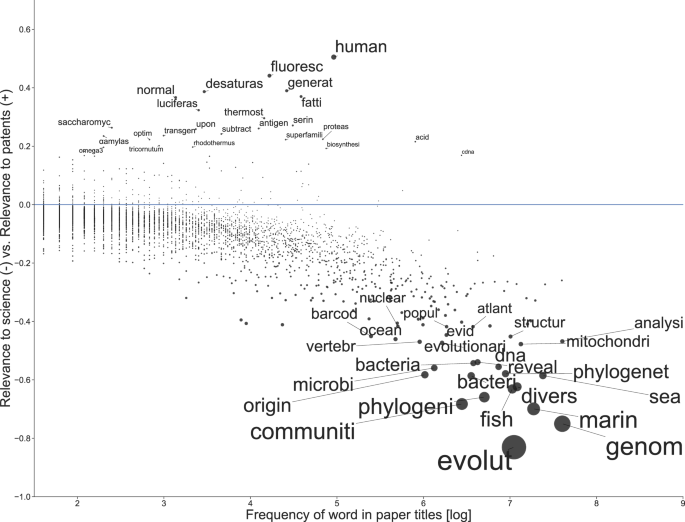
Node size corresponds to how polarized a word was according to the relevance indicator. The indicator ranges from −1, indicating exclusive relevance to science, to +1, indicating exclusive relevance to patents; 0 indicates that a word was equally relevant to both science and patents. Words above the 0.995 quantile and below the 0.005 quantile were labeled to highlight most polarized words.
Many of the words with the highest relevance to patenting were based on one or two specific outlier publications that had received many patent references (see Fig. S1). The relevance of the term ‘fluoresc’ related to a publication titled ‘Fluorescent proteins from nonbioluminescent Anthozoa species’ by a team of Russian scientists65, which had received over 300 patent citations. The significance of ‘human’ to patenting was based on ‘Generation and initial analysis of more than 15,000 full-length human and mouse cDNA sequences’66, published by Canadian and U.S. American researchers. ‘Desaturase’ is a type of enzyme, and the word was linked to two publications of high relevance to patenting: one from a team of researchers from the University of Hamburg and the company BASF that together had explored a marine diatom for cloning genes encoding fatty acid desaturases67; the other from Canadian and U.S. American researchers that had also been interested in fatty acids and biosynthesis68. Considering the words of high relevance to science, ‘genom’ and ‘evolut’ often appeared together in publications, such as the study ‘The genomic basis of adaptive evolution in threespine sticklebacks’69, published by a multinational team.
Selection and analysis of exclusively relevant words for patenting revealed that many of them refer to specific marine organisms (such as ‘rhodothermus’, ‘tricornutum’, ‘tertiolecta’—indications of bacterial species names) or molecular biology terms (for instance, biomolecules like fatty acids, serine, and desaturase). On the contrary, words that were exclusively relevant to scientific literature tend to be broader. Based on our selection criteria (see methods section), only 72 words were identified as more exclusive to patents in contrast with 1475 words more relevant to secondary science. For studies where at least one of the researchers was affiliated with a G77 country, the difference was similar: 10 and 177, respectively. The full list of publications used for this analysis is available in Supplementary data file 1 and a list of words that were most exclusively relevant to patents and science in Supplementary data file 2.
National science-patent balances
Next, we contrasted countries’ number of marine genetic studies to the number of granted patents citing those studies (Fig. 4a). The assignment of patent holders to countries was based on headquarters location (for companies) or institutional location (for universities or public institutions). Publication and patent counts for the top 20 countries can be found in Table S1 and for the top 20 institutions in Tables S3 and S4.
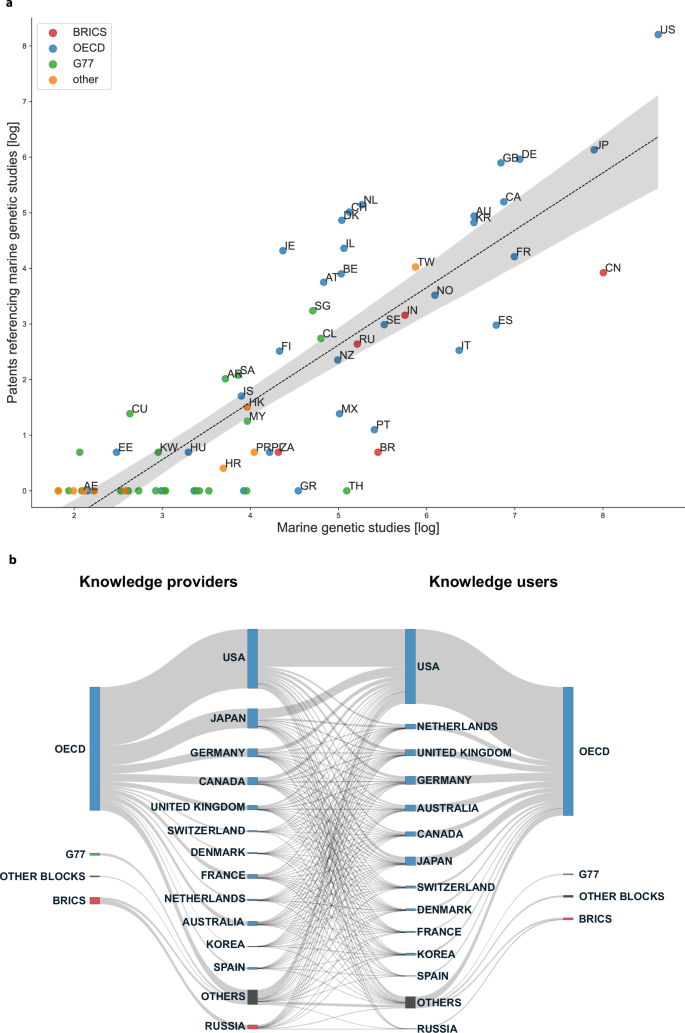
a Comparing counts of marine genetic studies and patents for countries with more than 5 publications (N = 70). Counts were transformed using log(x + 1) and log(y + 1) to avoid hiding countries without patents. A 95% confidence interval is displayed. Countries: US United States of America, CN China, JP Japan, DE Germany, FR France, CA Canada, GB United Kingdom of Great Britain and Northern Ireland, ES Spain, KR South Korea, AU Australia, IT Italy, NO Norway, TW Taiwan, IN India, SE Sweden, BR Brazil, PT Portugal, NL Netherlands, CH Switzerland, RU Russian Federation, TH Thailand, MX Mexico, BE Belgium, IL Israel, NZ New Zealand, DK Denmark, AT Austria, CL Chile, SG Singapore, GR Greece, IE Ireland, FI Finland, ZA South Africa, PL Poland, PR Puerto Rico, MY Malaysia, HK Hong Kong, IS Iceland, SA Saudi Arabia, AR Argentina, HR Croatia, HU Hungary, KW Kuwait, CU Cuba, EE Estonia, AE United Arab Emirates. b Knowledge flows from provider countries to user countries grouped by economic blocks. Top 10 countries in each category are labeled.
Figure 4a shows a strong and significant positive correlation (p < 0.001, r = 0.84) between the number of published studies and patents (Table S2). The more a country publishes the more likely it is to own patents that rely on marine genetic research. At the same time, the varying distances of each country to the linear prediction line show that some countries contributed relatively more in terms of science than they patented, and, vice versa, others patented more than they provided. Countries like Portugal (‘PT’), Mexico (‘MX’), and Italy (‘IT’) published a lot while not patenting a lot, while the United States (‘US’), the Netherlands (‘NL’), Denmark (‘DK’), and Switzerland (‘CH’) patented a lot compared to how much they published. The BRICS countries China (‘CN’) and Brazil (‘BR’) also fell far below the predicted number of granted patents, and countries like Thailand (‘TH’) or Greece (‘GR’) did not own any patents citing marine genetic studies. G77 countries were generally underrepresented in this plot, but a few exceptions included Singapore (‘SG’), Chile (‘CL’), and Saudi Arabia (‘SA’).
Finally, we illustrate the knowledge flow between science provider and user countries, measured via patent references to science (Fig. 4b). All top 10 users and 9 out of 10 biggest providers belonged to the OECD block, whereas the share of other coalitions was very modest. Among the two biggest providers of knowledge, Japan provided 2.8 times as much scientific knowledge to other countries as it used from them for patenting and the United States only contributed 0.6 times the amount it used from other countries (Table S1).
Discussion
This study established a relational perspective on the provision and use of marine genetic research by tracing how it becomes relevant to future scientific and corporate activities and by identifying actors involved in the process. We found research that employed molecular biological terms and bacterial species names to have attracted the most references from patents, unlike research on other scientifically relevant species. Nationally, our findings reveal the dominance of marine genetic research in OECD countries, while the G77 was largely absent. Yet, important differences existed even among OECD countries. Being the largest provider of scientific knowledge and owner of patents, the U.S. used more knowledge from other countries’ science than it provided to them. These findings have important implications for international capacity-building and benefit-sharing.
Our analysis of national capacities to conduct marine genetic research resembles findings of previous studies on marine biological research capacities21,22,23,24. Alongside publication counts, we considered how frequently a country’s research received citations from either secondary science or patents and found a significant correlation between these indicators. Thus, if a country’s research is considered valuable by other researchers, it would likely also be valuable for patenting. However, a few outliers like Russia and Iceland existed. A closer look at those two countries revealed that the deviation may have been caused by the work of two scientific groups that later became founders of highly successful biotechnological startups, Evrogen in Russia (https://evrogen.com/about/about.shtml) and Prokazyme in Iceland (https://prokazyme.com/about-us/). Other explanations may be found in research content (such as applied versus basic research), language70, types of sequencing techniques (e.g., whole-genome sequencing papers may receive more scientific citations than from patents), or international collaboration patterns.
Our semantic analysis of marine genetic studies’ titles revealed words polarized in their relevance either for patenting or for secondary science. While some terms of high scientific relevance, such as genomic (‘genom’) and evolutionary (‘evolut’), related to basic research contexts, others may indicate potentials for future natural product discovery. This included terms like ‘mykiss’ (The rainbow trout O. mykiss), ‘dinoflagel’ (Dinoflagellates, a group of marine plankton), ‘diatom’ (large taxonomic group of microalgae), and ‘ciona’ (a genus of sea squirts), which referred to a specific taxonomic group of marine organisms. These latter terms were highly used by scientific articles that studied molecular adaptation or contributed with full genome sequence data yet did not receive much attention from patents. As genome mining has become a time and cost-efficient method for predicting novel biological enzymes71, these organisms may become relevant to future innovation efforts. Words that were mostly relevant to patenting related most to bacterial organisms, such as ‘rhodothermus’ and ‘tricornutum’, and molecular biology terms and applications. For instance, the term ‘fluoresc’ points to research on fluorescent proteins, which have been a major source of marine biotechnological innovation1.
The method of categorizing marine genetic research based on its relevance to different applications holds significance to international capacity-building initiatives and the broader design of research and innovation systems. By moving beyond abstract and unrefined concepts of research capacity in policy-making, we can identify concrete research content that is likely to lead to particular research or innovation and invest in local collaboration networks around corresponding scientific fields21,57. This method could, for instance, be a useful guide to identify environmental and capacity-building projects that should be funded via the purposed multilateral fund under Article 52 of the BBNJ treaty72. Subsequent research may further refine these findings and employ a more differentiated scheme of application than the simple distinction between patents and secondary science employed here. For example, it might be reasonable to single out scientific research or technologies that demonstrate a high potential in achieving the Sustainable Development Goals, such as microbial73 or microalgal biotechnology74, and explore which semantic content they are related to. While we are currently not aware of any research that evaluates applications of marine genetic resources in terms of sustainability, planned future research should provide concrete ideas in this regard.
After examining citation frequencies at the publication and country levels, we ‘followed’ knowledge flows from science to the actual patent documents to understand how much marine genetic research each country ‘contributed’ and ‘used’, in the sense of referencing it as prior art in patent applications. We found that scientific capacity corresponded to more intellectual property on the basis of this research. The link between national science and patenting activities might, to some extent, be related to the central role of universities in patenting and commercializing research findings58,75,76. Another plausible explanation is knowledge flows from research to corporate activities that are not directly channeled via university researchers yet still geographically bounded57. Looking more concretely at the role of countries in the provider-user relationship, countries such as the U.S., the Netherlands, or Switzerland owned considerably more patents than expected based on the number of published studies, and, vice versa, other countries owned fewer than expected (Fig. 4a). Overall, OECD countries were by far the biggest producers of marine genetic research and owned the most patents referencing this science. The predominant role of OECD countries was even stronger when looking at knowledge flows between provider and user countries, in which the U.S. and Japan acted as the biggest knowledge providers (Fig. 4b). However, when disregarding inner-country knowledge flows, we discovered that the U.S., Australia, Great Britain, and others provided less knowledge to other countries than they used, while Japan, Russia, France, and Spain provided distinctively more than they used (Table S1). Despite their high dependence on marine ecosystems77, G77 countries were nearly absent in marine genetic research that contributed to technological innovations, which urges the need for broader and more inclusive scientific collaborations.
Considering the status of genetic research as a public good that, at least in terms of the genetic sequence data, is openly accessible and usable to anyone78,79, these divergences raise the question of whether we are observing a freeriding problem: some countries ‘use’ a lot of research for their innovations without contributing much to the availability of that knowledge. The freeriding, in this case, does not necessarily occur via the subtractability of the scientific knowledge resource due to overuse, as referencing a study in a patent does not directly diminish another user’s ability to do the same. However, in mere economic terms, patents can lead to monetary benefits for their owners, and science creates non-monetary value in the form of public knowledge, arguably constituting a provider-user relationship. Such a perspective extends research on genetic resource user-provider balances, which has focused on relations between countries of origin (i.e., countries where genetic materials were collected) and scientific user countries80,81. In contrast, our research revealed user-provider relations in the later stages of the marine genetic resource pipeline, namely in the flow of knowledge from science to patenting. It might be important to consider this relationship in benefit-sharing arrangements under the CBD and the BBNJ treaty. One of the options for assessing monetary contributions under the BBNJ treaty is to rely on ‘indicators measuring the aggregate level of activities by a Party’, as stated in paragraph 14.8., not necessarily requiring individual tracing of activities29,32,82. Accounting for science-patent balances, as we did here, could be a way to calculate contributions: countries that patent a lot, but contribute little research would have to pay according to how much above the linear trend they lie. The introduction of a ‘BBNJ standardized batch identifier’ (Article 12 of the BBNJ treaty) will likely allow future calculations to specify whether used resources are of BBNJ origin. Similar discussions on benefit-sharing modalities are currently taking place in response to the recent CBD decision to develop a multilateral benefit-sharing system on DSI28.
In conclusion, our study hopes to provide new impetus to discussions about how to make marine genetic research and related patenting activities more equitable. While we found scientific capacities to be generally concentrated in developed countries, our perspective on science-patent relations revealed that, even among the OECD, countries may act either as net providers or net users of marine genetic research. In order to build an equitable scientific knowledge commons around marine genetic resources, it may thus be important for international frameworks, such as the BBNJ treaty or the CBD, to consider how to recognize scientists in their crucial role as providers of knowledge, while putting responsibility on those patenting actors who benefit more from such research than they provide. Benefit-sharing schemes may be designed accordingly and, in connection with capacity-building measures, may allow for gradually integrating a wider community of users, making marine genetic resources an integral part of sustainable and equitable ocean economies.
Methods
Identifying marine genetic studies
It is not a straightforward task to define marine genetic resources. While certain organisms live exclusively in the sea, there are many cases of organisms that traverse marine, freshwater, and terrestrial ecosystems. This is often the case for bacteria but may also include animals like sea birds. Various biological databases may be used to identify marine species, including the World Register of Marine Species (WORMS), the Ocean Biodiversity Information System (OBIS), and the Global Biodiversity Information Facility (GBIF)22. For the purpose of identifying marine species that receive patenting interest, OBIS is of limited value as it underrepresents potential marine bacteria that attract a lot of interest22. We thus used a combination of 130,973 marine species identified via OBIS and a manually curated list of additional 1270 patented marine species from a recent study on marine bioprospecting20, which followed a methodology described in an earlier study19. The hereby selected 132,243 marine species constituted the starting point for the curation of the scientific publication and patent datasets for our study. We did not distinguish between species from areas beyond national jurisdiction and within national jurisdiction—our study addresses both legal contexts.
We identified relevant marine genetic studies by querying the species names in GenBank for corresponding genetic sequence data via Python scripts. GenBank is the main U.S. American public genetic sequence database. As it is part of the International Nucleotide Sequence Data Collaboration (INSCD), it mirrors the two other largest databases, the European Molecular Biology Laboratory (EMBL) and the DNA Data Bank of Japan (DDBJ), daily, constituting by far the biggest pool of genetic sequence data available. We chose to work with sequence data rather than samples (which are ‘closer’ to the notion of genetic material83), as GenBank’s Bio Sample data are often not linked to readily identifiable publications81 and thus not as useful to our approach. Within the broad term genetic sequence data, we chose nucleotide sequences (DNA and RNA) as they lie at the core of the definition of digital sequence data in relevant policy debates84. Previous analyses on genetic sequence data user-provider relations in the CBD context took the same methodological choice80,81. Additionally, other forms of genetic sequence data, like proteins, are usually derived from nucleotide sequences, so nucleotide sequences are a useful starting point for analysis81. When searching GenBank, we identified 31,578 species that had at least one sequence entry. Overall, we found 36,849,850 sequence entries, out of which 10,294,029 were linked to a total of 23,438 PubMed identifiers. Due to the high volume of data, searches were performed for multiple weeks between 23rd of February and 8th of May 2023.
To get standardized and curated bibliometric data on those publications, we queried the PubMed identifiers via the scholarly API of the database The Lens (www.lens.org). 15 out of 23,438 PubMed identifiers turned out to be non-existent after querying on The Lens, and 5 publications did not list any authors. As such, the analysis proceeded with 23,417 publications.
Mapping scientific publication counts and citation frequencies to countries
We mapped scientific publications onto countries based on The Lens’ country classification, which was usually the location of the university. In some cases, no country classifications were available, but institutional names were, for which we tried re-constructing them using a set of manually defined rules. For instance, we applied a rule that any given author affiliation that entails the strings ‘univ’ and ‘harvard’ would be labeled as U.S. American, or if it entails ‘tokyo’, it would be labeled as Japanese. We also searched for country names entailed in the affiliation strings (e.g., ‘NRC-Biotechnology Research Institute, 6100 Royalmount Ave., Montreal, Que., Canada’) to label the cases accordingly. We tested each rule and adjusted them to prevent false positives. For cases where country labels were still missing after applying these rules, we looked them up and added them manually for all institutions that registered more than 5 publications. Remaining unlabeled affiliations that were either unclear (e.g., ‘Marine Science Institute’) or with less than 5 publications were not considered for any analysis displaying country-level information. Out of the 23,417, we connected 23,231 publications to at least one affiliation country via this method.
While some studies on genetic resources limited their observations either to first authors80 or first and last authors23 to assess country affiliations, we followed a study that considered all authors85. This made sense as we were interested in all providers of scientific knowledge, even if not listed as lead authors. Including non-leading authors may matter in scenarios of North-South collaboration, such as joint research cruises led by a country of the Global North or when genetic materials were sourced by researchers from the Global South but analyzed by researchers from the Global North. In any case, we compared the distribution of national publication counts if constructed either based on first, last, or all authors and found that they are all strongly correlated across the authorship types. The same was the case for citation frequencies. This means that the choice is unlikely to have a big impact on country-level trends. However, working with all authors instead of the first or last authors results in a much larger set of countries (149 instead of 104, which would be the case for first-author countries), though none of these added countries registered more than 9 publications.
Working with all authors requires consideration of how much each authorship ‘adds’ to the national affiliation counts. We adopted a fractional scoring approach85 for this purpose. If a publication had one author from France and one from China, 0.5 would be added to the publication counts of both countries. If it had two authors from France and one from China, the same scores would apply. If a country had five authors from the U.S., it would be counted as one publication. This way of counting prevented overweighting publications that included authors from a very large number of countries, which was not unlikely.
To identify instances of knowledge flow from marine genetic studies to subsequent research and innovation activities, we retrieved citations to the studies from both patents and secondary research publications via The Lens’ scholarly API and mapped them onto the countries (single-country and multi-country publications were treated according to the same logic as described above).
For the correlation table (Table S2) and Figs. 2 and 4a, we further reduced our sample to 70 countries with more than 5 publications to prevent outliers from skewing overall trends. Using median values instead of means was not a better solution, because there was too little variation in the citation rates from patents.
Semantic analysis
The semantic analysis was based on a set of all words present in the titles of the marine genetic studies. The words were processed as lower cases. Using the Python package NLTK’s stop word list for English, we removed words with little semantic content, like ‘for’ or ‘that’. We also stemmed the words using NLTK’s snowball stemmer, which reduced the heterogeneity of the words, e.g., by joining ‘genome’ and ‘genomic’ to ‘genom’. This resulted in a set of 29,000 uniquely occurring terms. After some testing, we also removed words that occurred in less than five or more than 2500 publications, as it would have been hard to interpret citation rates for such infrequent or overly frequent words. This reduced the corpus to 5181 terms.
To construct the indicator that classifies the processed terms in their relevance to science as compared to relevance for patents, we iterated through each term and calculated how often a publication entailing the term got cited on average. We excluded words higher than the 0.995 quantile of most frequently cited words for both scores to prevent outliers, which further reduced the list of terms to 5154. We weighted the average scores by multiplying values with the square root of the terms’ frequency, in order to foreground terms that were polarized and occurred frequently64. We then normalized the score for average citations by science to correspond to the same scale as average citations by patents, as there were generally way more citations from science than from patents and calculated the difference between the corresponding values of the two variables. This difference was scaled and transformed into an orientation value within the range of −1 (exclusively relevant to science) to 1 (exclusively relevant to patents). For all words with orientation values lower than zero (more relevant to science), we selected words lower than the 0.3 quantile and for those with orientation values greater than zero (more relevant to patents) those higher than the 0.7 quantile as the most exclusive words to science and patents respectively. We analyzed the publications linked to the selected words in more detail to interpret why they have achieved relevance for either of the domains. We then repeated the same selection for scientific papers that were co-authored by at least one researcher from a G77 country.
Tracing patents that cite marine genetic studies and mapping patent owners to countries
To construct national science-patent balances, we used The Lens’ patent API to collect data on the patents that had cited the identified publications. We found that 3247 out of the overall 23,417 publications were referenced by a total of 7170 granted patents. We also found 5243 patent applications but did not analyze these further, as it was unclear whether they actually resulted in ownership status.
Patent citations to science are a common indicator in economics to study the sources and nature of innovation in firms54,55,56,86 or to study science-patent linkages in countries24. Researchers have evaluated this method through survey research86, concluding that it is useful for studying knowledge flows from publicly available science while missing out on relevant other sources of privately communicated scientific knowledge. Patent citations to science achieve a degree of reliability as national patent laws usually require some indication of the relevant prior art, which includes previously published science. While applicants in the U.S. are required to disclose prior art themselves, references to science in non-U.S. jurisdictions are usually added by patent examiners56. Even though patent practices differ across jurisdictions, we decided not to distinguish between them, as either type indicates knowledge flow from science to patents.
Assigning patents to countries is more complicated than it is for scientific publications. Corporate entities tend to be more dynamic than scientific institutions, as companies may merge with other companies, or they may split off sections from a parent company, yet maintaining subsidiary status87. Additionally, companies can be multinational and run multiple subsidiary branches in various countries87. This is visible in patent data, which usually shows the owner’s addresses: Not infrequently does a patent link to addresses across several countries for one and the same company with multiple subsidiaries listed. For our purposes, it was most reasonable to identify the country of a corporate actor’s headquarters, rather than considering multiple countries per company.
We thus applied the following rules for linking each corporate entity to one country: First, we identified the parent company or university of a given corporate entity detected as a patent owner. We did this via desk research. Where we detected subsidiaries, we merged them into their parent entity. Second, we checked which country affiliations The Lens returned for the merged entities. In cases where all country affiliations matched, we considered these as a proxy for the headquarters location. If they did not match, we manually looked up the location of the entity’s headquarters. We repeated this process for each entity that we found to own more than five patents. For entities below this number, we also applied the second set of rules for country addresses but, due to time constraints, without first checking whether they needed to be merged with another entity. We excluded individuals, uninterpretable entities, and entities where we could not find sufficient information. This resulted in a reduced set of 7150 granted patents, out of which 6434 were connected to at least one country. We compared the hereby assembled national patent counts with scientific publication counts for Fig. 4a.
To measure knowledge provision and use patterns for Fig. 4b, we configured our data in a manner that tied provider countries and patenting countries together via each scientific publication cited by patents of the respective country (Supplementary data file 4). The fractional counting approach needed to be considered in the calculation. If a publication has been published by exclusively Japan-based researchers and cited by five exclusively Japanese-owned patents and one exclusively Swizz-owned patent, it would result in a Japan-Japan knowledge flow of 5 and a Japan-Switzerland flow of 1. If a publication was published by Dutch and German researchers and cited by four exclusively U.S. American-owned patents and four mixed U.S. American- and South Korean-owned patents, this would result in the following flows: NL-US (3); DE-US (3); NL-KR (1); DE-KR (1). The measured flow total thus corresponds to the number of granted patents per case. We repeated this counting procedure for each cited publication and aggregated the provider-user flows. Finally, we constructed external provision-use balances for each country by dividing the amount of used knowledge flow from other countries by the amount of knowledge provided to other countries. Self-loops (e.g., U.S. American research that got cited by U.S. American companies) were thus not considered in this equation. The resulting balances are visible for the top 20 countries in Table S1 and in Supplementary data file 3.

Responses